HAL Id: hal-01543644
https://hal.sorbonne-universite.fr/hal-01543644
Submitted on 21 Jun 2017HAL is a multi-disciplinary open access archive for the deposit and dissemination of sci-entific research documents, whether they are pub-lished or not. The documents may come from teaching and research institutions in France or abroad, or from public or private research centers.
L’archive ouverte pluridisciplinaire HAL, est destinée au dépôt et à la diffusion de documents scientifiques de niveau recherche, publiés ou non, émanant des établissements d’enseignement et de recherche français ou étrangers, des laboratoires publics ou privés.
Nanophase Segregation of Self-Assembled Monolayers on
Gold Nanoparticles
Santosh Kumar Meena, Claire Goldmann, Douga Nassoko, Mahamadou
Seydou, Thomas Marchandier, Simona Moldovan, Ovidiu Ersen, François
Ribot, Corinne Chanéac, Clément Sanchez, et al.
To cite this version:
Santosh Kumar Meena, Claire Goldmann, Douga Nassoko, Mahamadou Seydou, Thomas Marchandier, et al.. Nanophase Segregation of Self-Assembled Monolayers on Gold Nanoparticles. ACS Nano, American Chemical Society, 2017, 11 (7), pp.7371-7381. �10.1021/acsnano.7b03616�. �hal-01543644�
1
Nanophase Segregation of Self-Assembled Monolayers
on Gold Nanoparticles
Santosh Kumar Meena1, Claire Goldmann2, Douga Nassoko2,3, Mahamadou Seydou4, Thomas Marchandier2, Simona Moldovan5, Ovidiu Ersen5, François Ribot2, Corinne Chanéac2, Clément Sanchez2, David Portehault2*,Frederik Tielens2*,Marialore Sulpizi1*
1 Institute of Physics, Johannes Gutenberg University Mainz, Staudingerweg 7, 55099, Mainz, Germany
2 Sorbonne Universités, UPMC Univ Paris 06, CNRS, Collège de France, Laboratoire de Chimie de la Matière Condensée de Paris, 11 place Marcelin Berthelot, 75005 Paris, France
3 Ecole Normale Supérieure, Rue du 22 Octobre 1946, Quartier du Fleuve, BP:241 Bamako, Mali
4 Université Paris Diderot, Sorbonne Paris Cité, ITODYS, UMR 7086 CNRS, 15 rue J.-A. de Baïf, 75205 Paris cedex 13, France
5 Institut de Physique et Chimie des Matériaux de Strasbourg, UMR 7504 du CNRS, 23, rue du Loess, 67087 Strasbourg, France
* Corresponding authors:
Jr. Prof. Marialore Sulpizi: [email protected] Dr. Frederik Tielens: [email protected] Dr. David Portehault: [email protected]
2
Abstract: Nanophase segregation of a bi-component thiol self-assembled monolayer is predicted
using atomistic molecular dynamics simulations and experimentally confirmed. The simulations suggest the formation of domains rich in acid-terminated chains, on one hand, and of domains rich in amide-functionalized ethylene glycol oligomers, on the other hand. In particular, within the amide-ethylene glycol oligomers region, a key role is played by the formation of inter-chain hydrogen bonds. The predicted phase segregation is experimentally confirmed by the synthesis of 35 and 15 nm gold nanoparticles functionalized with several binary mixtures of ligands. An extensive study by transmission electron microscopy and electron tomography using silica selective heterogeneous nucleation on acid-rich domains to provide electron contrast supports simulations and highlights patchy nanoparticles with a trend towards Janus nano-objects depending on the nature of the ligands and the particle size. These results validate our computational platform as an effective tool to predict nanophase separation in organic mixtures on a surface and drive further exploration of advanced nanoparticle functionalization.
Keywords: Janus particles • gold nanoparticles • molecular dynamics • Density Functional
3
Introduction
Janus particles are composed of two chemically/physically distinct regions,1-5 which make them
suitable for applications including biosensors, nanoscale motors, anti-reflective coatings, optical sensing devices, and two phase stabilizers, building blocks of multiscale materials.6-12 Since the
late 1980s researchers aim at exploiting the remarkable properties of dissymmetrical particles and, by extension, of particles exhibiting partial segregation between two components.9, 13-18 Nanophase segregation of bi-component organic shells, or self-assembled monolayers (SAMs), on nanoparticles is a straightforward way to reach such asymmetric nano-objects.14, 19-22 Hence, identifying the driving forces at play toward phase separation in nanoscaled SAMs can help to select the optimal components for the design of dissymetric particles. This fundamental knowledge will ultimately yield better understanding of structure-property relationships of inorganic/organic hybrid nanoparticles.
Modeling provides valuable information on the nature of interactions of organic molecules on a surface.23 Thus, computational approaches may help identifying driving forces to guide the design of new dissymetric, Janus or patchy nanoparticles by the rational choice of reagents and synthesis conditions. Coarse-grain molecular dynamics (MD),24-27 Atomistic MD,28 and Monte Carlo simulations,28 have identified conformational entropic effects as the driving force for nanophase separation in binary thiol SAMs on gold nanoparticles, provided that the two kinds of molecules are not miscible and have sufficiently different chain lengths.24, 27-28 Similar conclusions were
reached for ternary and quaternary thiol SAMs.25-26, 29 However, the role of specific inter-chain
interactions on phase segregation has been mostly eluded in simulations, except in very recent reports based on discrete MD simulations, where tail-tail repulsive interactions have been suggested to contribute to nanophase segregations for some specific ligand types.27 Besides, modeling could also address mechanisms of phase segregation at the molecule-scale, such as surface diffusion or desorption-adsorption processes, although studies in this direction have been only scarcely reported.30
The aim of this work is the development of rational and reliable models to study the behaviors and properties of mixed organic SAMs at the surface of gold planar surfaces and nanoparticles exhibiting full (Janus) or partial (patchy) phase segregation. We focus on the role of the ligands side chains and their strong inter-chain interactions, such as H-bonds, available within a binary
4
SAM containing ligands specifically designed and available from modern synthetic chemistry. In particular, we analyze planar gold surfaces immersed in water and capped with single- or bi-component thiol SAMs. We use a combination of force field MD simulations and Density Functional Theory (DFT) calculations. This “hybrid” approach enables deciphering mechanisms of phase segregation in a mixed SAM and rationalising the forces driving nanophase segregation. Contrary to previous reports, we show that attractive inter-chain interactions – dipolar, dispersion and especially H-bonding – can play a dominant role, thus opening new roads to the design of multiphase surfaces and nanoparticles. As a proof-of-concept for the predictive ability of our calculations, we demonstrate how it is possible to experimentally obtain patchy gold nanoparticles, using mixed SAMs derived from the one studied in calculations.
RESULTS and DISCUSSION
To validate our models we first discuss the structure of the monolayers of pure mercaptododecanoic acid (MDA) and a pure "PEG-amide" alkylthiol (TegA) (Figure 1), where an amide group bridges a short alkylthiol with an ethylene glycol oligomer as end-group. Then we discuss the stability of mixed and phase-separated combinations of the two components.
Figure 1. Formula of the studied ligands. MDA and TegA are used for computations.
The MDA SAM is 1.67 nm thick (See Table 1) in agreement with previous reports.31 The MDA molecules present an average tilt angle of 26.4°, in agreement with the experimental value 30° ± 10°32-33, values from previous MD simulations (25°31 and 28°31) and Density Functional Theory
5
(DFT) calculations (30°34-35). Instead, TegA forms a thicker SAM about 1.72 nm thick (Table 1),
with the TegA molecules presenting an average tilt angle of 19°.
The values for the tilt angles obtained from the MD simulations are smaller than those obtained from the geometry optimization at the DFT level, 35.6° and 36.0° for MDA and TegA (Table 1), respectively. This discrepancy is possibly due to two reasons. On one side an accurate description of the Au-S chemical bond, as obtained in the DFT calculation, has an impact on the tilt angle as previously discussed.36. On the other side the finite temperature (300 K for the MD simulation, vs 0 K in the DFT calculations) also reduces the tilt angle.37
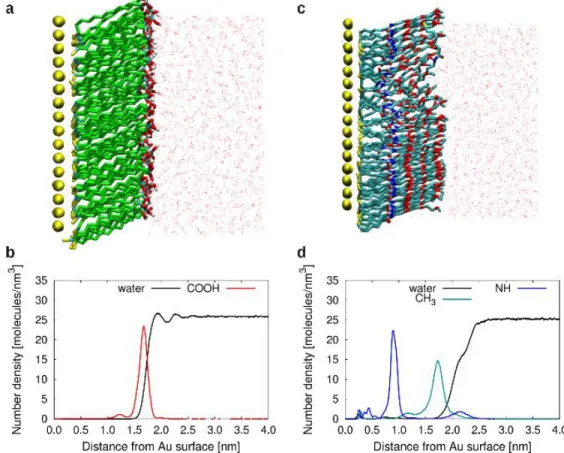
Snapshots of the simulations of the pure SAMs on Au(111) in water after 200 ns of equilibration are presented in Figure 2a and Figure 2c for MDA and TegA, respectively. The structure of the MDA and TegA SAMs can be further characterized by the density profiles across the gold/SAM/water interfaces. The density profiles (Figure 2b) for the COOH groups and for the water molecules overlap, and the water density also presents a well-defined first peak. This behavior suggests an hydrophilic character for the MDA SAM surface. On the other hand, the CH3
-terminated TegA SAM surface is expected to be hydrophobic[FR1][D2]. Accordingly, density profiles of terminal TegA CH3 groups and of water are more separated (Figure 2d). Moreover, the water
density profile does not show the well-defined first peak, which is characteristic of hydrophilic surfaces.38 you don’t speak about figure S1, S2, S3 and S4… is it normal? If you don’t speak about
6
Figure 2[FR3][D4]. Snapshots from simulation of MDA (a) and TegA (c) SAMs in water on an
Au(111) surface. Snaphots after 200 ns of equilibration at 300K. Number density as a function of distance from the Au (111) surface for the MDA SAM (b) and the TegA SAM (d). The density profiles of water are scaled by a factor 4.[D5]
Table 1. Tilt angles and thicknesses of the SAMs studied, at the FF and DFT level of calculation
(angles in degrees and distances in nm). The thickness of the MDA SAM is determined by the distance between the S atom and the C atom of the -COOH group. The tilt angle of the MDA SAM is determined as the angle between the surface normal and the line passing through the S atom and C atom of -COOH. The thickness of the TegA SAM is determined by the distance between the S atom and the terminal C atom (-CH3 group). The tilt angle of the TegA SAM is determined as the
angle formed between the surface normal and line passing through the S atom and C atom of -CH3.
System Tilt angle [degree] Thickness [nm] MDA (FF) 26.4±0.6 1.67±0.01
7 TegA (FF) (system 1) 18.7±0.9 1.72±0.02 TegA (FF) (system 2) 19.0±0.7 2.02±0.02 TegA (DFT) 36.0 1.82 TegA/MDArandom (FF) - TegA/MDAsegregated (FF) 21.5±0.6/36.1±0.5 2.10±0.01, 1.69±0.01
In order to understand whether MDA and TegA molecules mix in the SAM or segregate to form a bi-phasic SAM we have prepared a system containing MDA and TegA molecules with a 1:1 ratio and random mixing on Au(111) in aqueous solution (top view Figure 3a, water molecules not shown). During the MD runs, both MDA and TegA molecules are able to diffuse on the surface and to rearrange in order to reach more favorable configurations. In our computational model, MDA and TegA diffusion is possible thanks to a simple Lennard Jones description of the Au-S bond between the Au surface and the MDA and TegA sulfur atoms. Although this is not the most realistic description for a bond with a covalent character, such simplification allows enhancing the molecular diffusion on the surface and, in turn, to accelerate the sampling of more energetically favorable configurations. The desorption/adsorption process is simplified with respect to what is taking place in the experiments, since protonation/deprotonation events, possibly accelerating ligands exchange, are not taken into account within the framework of a non-reactive force field. Interestingly, after 600 ns, MDA and TegA molecules already show the tendency to segregate and to form islands (top view in Figure 3b and side view in Figure 3c). The systems at t = 0 ns (random mixing) and at t = 600 ns (partial segregation) can be compared through the analysis of the MDA-MDA and TegA-TegA radial distribution functions, RDF(MDA-MDA) and RDF(TegA), respectively (Figure 4). The middle CH2 (C8) groups for MDA and the NH groups for TegA are used to
calculate such RDFs. As the simulation proceeds, the number of neighbors (integral of the first peak of the RDF) of the same type increases (Figure 4b) pointing to segregation and to islands formation. The density profiles of S of MDA and TegA (Figure S2) show that during the segregation, desorption and adsorption of molecules occur, which is also consistent with experimental observations33.
To demonstrate that the segregated MDA/TegA is actually energetically favorable with respect to the mixed one, we have prepared a segregated bi-phasic SAM of MDA and TegA molecules with
8
a 1:1 ratio (Figure 3e), i.e. with the same number of MDA, TegA and water molecules as in the initially randomly mixed SAM (Figure 3a). The bi-phasic SAM remains segregated and stable during 600 ns of simulation at 300 K (Figures 3f and 3g). The density profiles of -COOH for MDA, -NH and -CH3 for TegA (Figure 3h) show that the SAM is more ordered in the bi-phasic system
than in the randomly mixed SAM. In the fully segregated SAM, the thicknesses (Table 1) of the TegA and MDA domains are 2.10 nm and 1.69 nm, respectively, versus 1.72 nm and 1.67 nm the pure TegA and MDA SAMs, respectively. Likewise, in the bi-phasic SAM, the tilt angles (Table
1) in the TegA and MDA domains are 21.5° and 36.1°, respectively, versus 19.0° and 26.4° for the
pure systems. Due to interaction of –COOH groups of MDA with the O-ether and NH groups of TegA, 15.4% of the MDA molecules (located at the interface between MDA and TegA domains) are more tilted, explaining the increased average tilt angle of MDA in the fully segregated MDA/TegA SAM (Table 1, Figures S1 and S3). We have also calculated the tilt angle of MDA molecules excluding the interfacial molecules, recovering an average value of 27.4°, which is very close to the value obtained for the pure MDA SAM (Table 1).
Since our partially (Figures 3a-d) and fully (Figures 3e-h) segregated systems have exactly the same number of molecules, we can also directly calculate the energy difference between the two systems. In particular, after 550 ns of equilibration, the fully segregated system shows an energy gain of 6.03 kJ/mol per molecule with respect to the partially segregated system reached from the randomly mixed system. Such a substantial difference suggests that the biphasic (fully segregated) SAM of MDA and TegA is considerably more stable than a mixture of MDA and TegA. Our study strongly supports the possibility to reach Janus (fully segregated) or patchy (partially segregated) nanoparticles from gold cores capped with a mixture of MDA and TegA molecules.
9
Figure 3. Snapshots from the simulation of the MDA/TegA mixed SAM (a) at t = 0, top view,
(b) at t = 600 ns (c) side view at t= 600 ns. Snapshots from the simulation of the MDA/TegA bi-phasic SAM (MDA:TegA ratio 1:1). (e) at t = 0, top view, (f) at t = 600 ns (g) side view at t = 600 ns. MDA is shown in green and TegA in blue. Number density profiles as a function of the distance from the Au(111) surface for the (d) mixed and (h) bi-phasic SAMs. Density profiles of water are scaled by 4.
10
Figure 4. (a) Radial distribution functions of MDA and TegA in a random mixed SAM between
t = 0 and t= 600 ns (dashed lines) and integral numbers corresponding to the same curves
(continuous line); (b) integral number as function of the time for the biphasic system (black) and mixed system (red).
In order to provide more accurate energy estimates for the interchain interactions, the same systems were investigated using DFT (Table 2). Overall TegA is more strongly adsorbed on Au(111) (Eads = -4.44 eV, Eq. 1) than MDA (Eads = -3.79 eV[FR6][F7]), although the Au-S bond strength
approached by Ebind (SeeEq. 3), is similar in both cases (-2.59 and -2.66 eV for MDA and TegA,
respectively).
Hence, the adsorption energy difference between the two molecules clearly stems from the inter-chain interactions. Indeed, Eint.chain is 0.59 eV higher in absolute value for TegA. This increased
contribution is attributed to the formation of strong H-bonds between the amide groups (N-H···O=C) [D8](Figure 5). It should be noted that the optimal H-bond configuration between the terminal –COOH groups (in the case of MDA SAM) is not included here. However, even if the carboxylic group would be in an optimal configuration (to be able to make a geometrically optimized H-bond with its neighbor), the resulting energy gain interaction would be much smaller than that at play between the TegA chains, as shown in our earlier calculations35. These strong H-bonds drive the TegA chains together and lead to segregation in the mixed MDA-TegA SAM.
Table 2. Adsorption energy, dispersion energy, inter-chain interaction energy for the different
11
System Eads Edisp Einter-chain Ebind
MDA -3.48 -2.05 -0.90 -2.59 TegA -4.15 -2.33 -1.49 -2.66[D9]
Figure 5. TegA SAM from DFT calculations. In the inset the hydrogen bond interaction between
contiguous chain is highlighted. (H: white, O: red, C: grey, N: blue,S: yellow, Au: orange).
Based on the predictive calculations detailed above, we have run experiments by using a very similar system to confirm the tendency to segregation of a mixed MUA/TegA SAM. We have designed hybrid nanoparticles, made of a gold inorganic core functionalized with a SAM based on TegA molecules and a mercaptocarboxylic acid with a long chain: mercaptoundecanoic acid (MUA, Figure 1) that differs from MDA by only one CH2 moiety, so that the same behaviors are
expected. The 35 nm gold nanoparticles are synthesized in aqueous solution by using the well-known Turkevich method39. The as-obtained particles functionalized with citrate ions (Figure 6a) are ligand-exchanged first with the TegA thiol, and then with the MUA thiol, in order to reach a total coverage ratio of 5 thiol·nm-2, close to the value employed for calculations and commonly used to reach full coverage40-41. To assess phase segregation in the organic corona, we use transmission electron microscopy (TEM) in combination with a strategy to enhance contrast. To provide electron contrast within the organic SAM, we take benefit of the carboxylic moieties of the MUA molecules to trigger silica heterogeneous nucleation on these specific sites, through a precipitation process derived from the Stöber method.42 Hence, the distribution of silica at the surface of the particles should be an indicator of the MUA distribution in the mixed SAM. As a
12
proof-of-concept, we first designed two systems: nanoparticles covered only with MUA or only with TegA. As expected, silica grows homogeneously on the fully MUA SAM (Figure 6b), leading to gold-silica core-shell nanoparticles. A similar behavior is obtained when the longer mercaptohexadecanoic acid (MHA, Figure 1) is used instead of MUA (Figure 6c, d), thus suggesting that silica growth does not depend on the molecule length. On the contrary, silica does not nucleate on the TegA SAM (Figure 6e). The same TEM investigation on the mixed TegA/MUA SAM highlights ~10 nm silica patches at the surface of the gold cores (Figure 6f). Therefore, nanophase segregation occurs in the SAM, leading to MUA-rich and TegA-rich domains, with typical length-scale of ~10 nm.
Figure 6. (a) TEM image of bare 35 nm gold nanoparticles covered with citrate ligands. TEM
images of nanoparticles after silica deposition for different surface functionalizations: (b) MUA; (c, d) MHA; (e) TegA[FR10][D11] (showing no silica deposition); (f) TegA/MUA (3.5/1.5 mol., 2.0 eq. of silica precursor vs. gold); (g, h) TegA/MHA (3.5/1.5 mol., 2.0 eq. of silica precursor vs. gold); (i, j) TegA/MHA (3.5/1.5 mol., 1.5 eq. of silica precursor vs. gold). The silica patches are more easily distinguished in (i, j), when the amount of silica precursor is lowered compared to (g, h). Silica domains are indicators of mercaptoacid-rich domains and red arrows in (f), (h) and (j) show “holes” in the silica shell, thus highlighting TegA-rich domains.
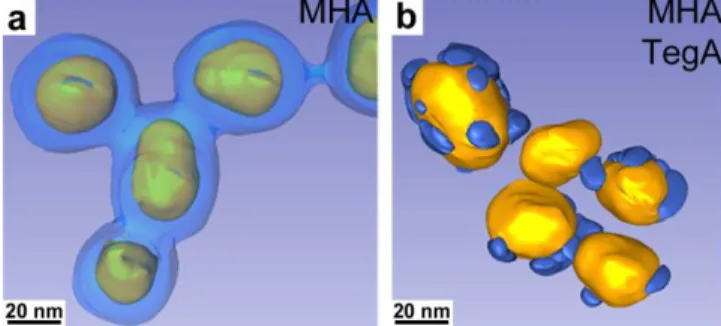
To confirm the patchy character as well as to extend our study of phase segregation in SAMs to a wider range of ligands, we have first changed the molecular length of the mercaptocarboxylic acid, by using mercaptohexadecanoic acid (MHA), which has similar length than TegA. After silica nucleation, TEM shows again several silica patches per particle evidenced by a "flower-like" pattern (Figure 6g, h). To increase the spatial resolution of “silica contrasting”, the amount of silica precursor was decreased from 2.0 to 1.5 eq. vs. gold atoms. A similar pattern was observed, although with more distinct patches (Figure 6i, j). Electron tomography on this latter sample
13
provides 3D images of these particles bearing a mixed ligand shell, with clear evidences of their patchy character (Figure 7b). The difference is significant when compared with a fully mercaptoacid SAM that yields homogeneous gold-silica core-shell nanoparticles (Figure 7a). In this latter case, slight fusion of the silica shells can be distinguished, presumably due to beam damage, as it is not observed by regular TEM imaging (Figure 7c, d). The 3D reconstruction of five patchy nanoparticles (Figure 7b) shows that the patches are not homogeneously distributed from one particle to the other, in agreement with TEM (Figure 6i, j), as expected from a kinetically limited process that could be sensitive to e.g. surface defects varying from one particle to the other. However, the silica patches are well separated and cover approximately 20% of the gold surface, which is consistent with the proportion of MHA ligands added in the reaction medium (30% mol.). Interestingly, TEM tomography indicates that the areas besides patches are silica-free, i.e. that the nanoparticle surface is clearly bifunctional, exposing selectively silica and organic ethylene glycol domains. This is confirmed by similar tomographs (not shown) obtained by scanning-TEM tomography with High Angle Annular Dark Field detection to bypass potential effects of the very high electron contrast between gold and silica. Such features open ways to tune overall surface energies,43. membrane permeation abilities for biomedical imaging,44. as well as surface multifunctionality.
Figure 7. TEM tomographic reconstructions of 35 nm nanoparticles reacted with silica precursors,
for two different surface functionalizations: (a) MHA (2.0 eq. of silica precursor vs. gold); (b) TegA/MHA (3.5/1.5 mol., 1.5 eq. of silica precursor vs. gold). Silica domains are drawn in blue. These domains are indicators of mercaptoacid-rich domains.
One can expect that the number of thiocarboxylic ligand patches per particle would decrease when decreasing the particle size, thus trending toward only one patch per particle, i.e. the Janus state. We have tested this hypothesis by replacing the 35 nm particles by 15 nm ones for the TegA/MHA system (3.5/1.5 mol.). As reference samples, 15 nm nanoparticles covered only by MHA
14
(Figure 8a) or TegA (Figure 8b) yield only core-shell or silica particles nucleated separately from gold particles, respectively. The bifunctional TegA/MHA nanoparticles (Figure 8c) bear only one or two silica patches, thus confirming the trend toward the Janus character with decreasing particle size. Note that no clear evidence of particle size effect on the dimensions of the patches is detected. These results are in agreement with reports of Stellacci et al. who extensively discussed the dependence of ligands distribution versus particle size, highlighting an enthalpically-driven trend toward the Janus state for small particle sizes covered by dissimilar ligands.22In the TegA/MHA system intermolecular H-bonds between amide groups of neighboring TegA ligands (Figure 5) 23,
45 must drive phase separation in the ligand shell, as expected from simulations (Figure 3a).
Noteworthy, in most cases, the Janus state could not be reached, even after longer mixing time before silica nucleation. Hence, the nanophase segregation experimentally reached is in very good agreement with calculations from an initially random distribution of ligands (Figure 4a-d). Although the exact mechanism of self-organization may be different between a planar SAM of thiol radicals (Figure 4), and a curved SAM formed from thiols where hydrogen (or proton) exchange may take place, the consistency between calculations and experiments suggest that in all cases, the intermolecular interactions and especially H-bonding drive the assembly.
This part is complicated but I think it provides an interesting and potentially important extension. If you feel like it is out of scope, we can discuss about the pertinence to keep or remove it: As an extension towards further surface functionalization, we have replaced the TegA ligand by another molecule bearing also an amide group and ethylene glycol units, but with a longer chain and dithiol functionality: DHLA-jeffamine (DHLA-J, Figure 1) with ca. 20 ethylene/propylene glycol units. Dithiols are known to bind gold surfaces stronger than single thiols,46 so that kinetics of mixed SAM reconfiguration should be strongly slowed down. TEM (Figure S5a) confirms that silica does not nucleate on DHLA-J domains, as for TegA (Figure 8b). A mixed DHLA-J/MHA functionalization of 15 nm nanoparticles (Figure 8d and S5b) yields similar results to those of a mixed TegA/MHA SAM (Figure 8c). To probe kinetic effects, the order of functionalization was reversed, by adding first the carboxylate-functionalized ligand (MHA/TegA and MHA/DHLA-J) instead of the glycolated molecule as presented up to now (TegA/MHA and DHLA-J/MHA). While results on the TegA/MHA system are indistinguishable for both addition orders (Figure 8c, not shown for MHA/TegA), the MHA/DHLA-J functionalization (Figure S5c-e) yields a very
15
different result than DHLA-J/MHA (Figure 8d and S5b): the latter yield gold particles bearing one or two patches, but the former yield gold-silica core-shell particles surrounded by silica-free gold particles as shown by cryo-TEM study of the as-obtained suspensions (Figure S5c, d). The proportion of core-shell and bare particles is directly correlated to the MHA/DHLA-J ratio (Figure S6). Hence, complete phase segregation occurs, yielding MHA-functionalized gold nanoparticles and DHLA-J-functionalized ones. The strong discrepancy between both addition orders can be tentatively explained by (i) irreversible grafting of the DHLA-J dithiol, (ii) its stronger surface affinity compared to the MHA thiol, and (iii) further stabilization of DHLA-J SAMs by intermolecular H-bonding. When DHLA-J is added to nanoparticles partially covered by MHA, the dithiol is able to displace MHA molecules in order to maximize intermolecular H-bonds, thus expelling MHA and yielding pure DHLA-J SAMs that do not allow silica nucleation. As the amount of DHLA-J is not sufficient to cover all particles, MHA adsorbs on the remaining ones, yielding pure MHA SAMs that form core-shell particles after nucleation of silica. On the opposite, when DHLA-J is added first, it binds readily and irreversibly to all gold surfaces available, yielding few patches on all particles. Subsequently added MHA ligands then occupy the surface sites that are left free, leading to mixed DHLA-J/MHA SAMs on each nanoparticles. These results experimentally show how the final state in such systems depends dramatically on the initial state and then the ligand grafting pathways, as was foreseen from our computations on planar monothiol SAMs, from fully segregated or random mixed SAMs (Figure 3).
16
Figure 8. TEM images after silica deposition for different surface functionalizations of 15 nm gold
nanoparticles. (a) MHA (3.0 eq. of silica precursor vs. gold); (b) TegA where the gold particles are deposited during drying of the suspension in the interstices between silica particles nucleated separately; (c) TegA/MHA (3.5/1.5 mol., 3.0 eq. of silica precursor vs. gold); (d) DHLA-J/MHA (4.0/1.0 mol., 3.0 eq. of silica precursor vs. gold). Silica domains are indicators of mercaptoacid-rich domains.
Conclusion
In this work we have presented a combined experimental and computational approach, which aims at identifying the driving forces responsible for phase separation in nanoscaled SAMs. In particular we focused on bi-component SAMs. The simulations predict the formation of domains formed by the acid-terminated chains and domains formed by ethylene glycol-rich chains, the latter being especially stabilized [D12]by strong inter-chain interactions. In particular the assembly of thiol molecules bearing polyethylene glycol-amide groups is stabilized by the formation of inter-chain hydrogen bonds. The predicted phase segregation is experimentally confirmed by transmission electron microscopy and electron tomography on designed gold nanoparticles functionalized by mixtures of similar thiol molecules. It is also observed for a wider range of particle size and ligand functionality. These results validate our calculation platform as a perform[FR13]ing tool for
identification of specific organic moieties to target complex patterns in mixed SAMs on planar surfaces or nanoparticles. Besides, we provide herein new insights into the role of kinetics on organic layers phase segregation and show that the adequate choice of molecular ligands drives the formation of Janus particls. Hence, our study paves the way to new means to tailor nanoscale surfaces.
METHODS
Computational Details
Force field (FF) molecular dynamics calculations
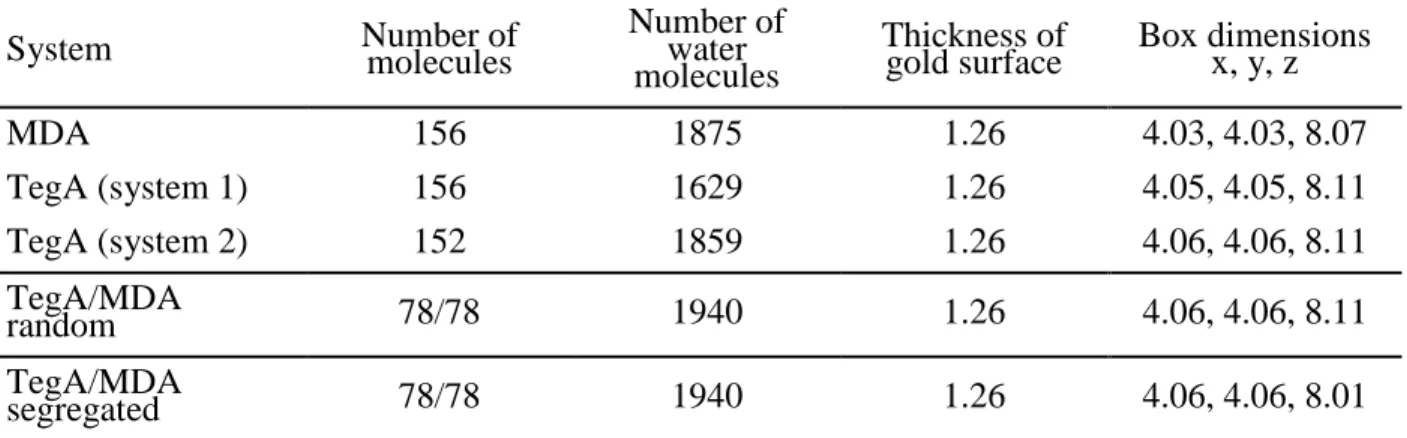
In Table 3 the details of the model systems for the gold/thiol water interface containing different compositions and organizations. In particular box sizes and number of atoms for the
17
mercaptododecanoic acid (MDA), PEG-amide alkanethiol (TegA), MDA/TegA random mix and MDA/TegA Janus-type SAM on Au(111) are reported.
A typical simulation system consists of a monolayer of thiol radicals on both sides of the gold surface, solvated with Simple Point Charge (SPC) water. For the TegA system we consider two different initial configurations, namely the vertically standing SAM and 30° tilted SAM (Table 3, system 1 and 2, respectively). After equilibration similar values for the tilt angles are obtained, showing that the initial conformation does not affect the final result (Table 1, system 2, Figure S1 in Supporting Information).
The packing density of the thiols on Au(111) is considered to be 4.7 - 4.8 molecules/nm2 which is the experimentally estimated value,1-2 and corresponding to a (√3×√3)R30º unit cell. All MD simulations are performed using the GROMACS package (version 5.0.5).47-50 Periodic boundary conditions are applied in all three directions. Energy minimization is performed after the addition of water and ions to keep the maximum force on any atom below 1000 kJ/mol.nm. A constant temperature of 300 K and a constant pressure of 1 bar are maintained by the Berendsen and Parrinello-Rahman coupling scheme. A time step of 2 fs is employed and trajectories are stored every 2 ps.
The systems have been first equilibrated in the NVT ensemble (constant Number of particles, Volume, and Temperature) for 100 ps, subsequently NPT ensemble simulations are performed. MD production runs are performed for at least 200 ns (for some systems we performed runs up to 600 ns in order to achieve equilibrium configuration) for each interface model listed in
Table 3. Trajectories from the last 50 ns are used for analysis.
Table 3. Model details of different SAM in water on Au(111) surface. Distances in nm.
System Number of molecules Number of water molecules
Thickness of
gold surface Box dimensions x, y, z MDA 156 1875 1.26 4.03, 4.03, 8.07 TegA (system 1) 156 1629 1.26 4.05, 4.05, 8.11 TegA (system 2) 152 1859 1.26 4.06, 4.06, 8.11 TegA/MDA random 78/78 1940 1.26 4.06, 4.06, 8.11 TegA/MDA segregated 78/78 1940 1.26 4.06, 4.06, 8.01
18
GROMOS96 53a6 force field51 is employed for all our MD simulations. Force field parameters for
MDA and TegA (Figure 9[D14]) are generated by the procedure followed in ref. 52 in which bonded
and van der Waals parameters are taken from the GROMOS parameter set (see Supporting Information). The Lennard-Jones parameters for gold as from Heinz et al.53 are used for the metal description.
Table 4. Chemical formula and chosen simplified nomenclature of the thiol (radical) molecules
studied)
Chemical Formula Simplified name
S-(CH2)11-COOH MDA
S-(CH2)5-CO-NH-(CH2)2-O-(CH2)2-O-(CH2)2-O-CH3 TegA
Description of the DFT models
Thiolate SAM structure on Au(111) is calculated at the DFT PBE-level with a (√3×2√3)R30º unit cell containing two thiol molecules. The surface layer is modeled by a minimal slab consisting of 5 hexagonal layers containing 6 Au atoms each.36, 54 The adsorption site is taken to be on the displaced bridge54 without considering any possible drastic reconstruction of the gold surface, such as the formation of gold adatoms.
The interaction energies were also calculated using the ab initio plane-wave pseudopotential approach as implemented in the VASP code.55-56 The Perdew-Burke-Ernzerhof (PBE) functional57-58 was chosen to perform the periodic DFT calculations with accuracy on the overall convergence tested elsewhere.59-62 The valence electrons were treated explicitly and their
interactions with the ionic cores are described by the Projector Augmented-Wave method (PAW),28, 37-38 which allows to use a low energy cut off equal to 400 eV for the plane-wave basis. The integration over the Brillouin zone was performed on the -point, in all calculations.
In the geometry optimizations at 0 K, the positions of all atoms in the supercell are relaxed in the potential energy determined by the full quantum mechanical electronic structure until the total energy differences between the loops is less than 10-4 eV.
In order to account for the dispersion interaction in the SAM system, DFT-D363 is used, as implemented in VASP, which consists in adding a semi-empirical dispersion potential to the conventional Kohn-Sham DFT energy.
19
Rationalization of the adsorption energy
The adsorption energies perchainEads of the thiol radicals on the surface are calculated as follows:
Eads = Eads.PBE + Edisp (1)
Where Eads,PBE is the adsorption energy calculated from the pure DFT-PBE electronic energies:
Eads,PBE = ½. [E(thiolA/Au(111)) – 2.E(thiolA) - E(Au(111)) (2)
E(thiolAB/Au(111)), E(thiolA), and E(Au(111)) are the total electronic energy at the PBE level of
the optimized adsorption complex formed by thiolA radicals and aAu(111) slab, the electronic
energy of the thiolA radical in vacuum, and the optimized clean defect free Au(111) slab,
respectively. Eads,PBE in Eq. 2 is then the adsorption energy of one thiolA chain in a perfectly
ordered SAM where dispersion interaction are not taken into account.
In a second step the dispersion interaction energy (Edisp) is added to the system (Eq. 1) by means
of the DFT-D approach63 to yield the full dispersion-corrected adsorption energy Eads.
The Au-S binding energy Ebind is evaluated as follows:
Ebind = ½. [E(thiolA/Au(111)) – E(thiolA.SAM) - E(Au(111))] (3)
with E(thiolA.SAM) the single point (not geometrically relaxed) electronic energy of the thiol radicals
(2 in the (2√3×√3)R30º unit cell) in the configuration of the SAM but without considering the Au(111) slab.
From Ebind one can obtain an approximation for the inter-chain interaction energy Eint.chain as
following:
20
Experimental Details
All reagents, including mercaptoundecanoic acid (MUA), mercaptohexadecanoic acid (MHA) were purchased from Sigma-Aldrich and used as received.
Nanoparticles synthesis. The 35 nm gold nanoparticles (AuNPs) are synthesized by the well-known Turkevich's method39. Briefly, 9.85 mg of HAuCl4,3H2O (1.0 eq., 2.5·10-5 mol) are dissolved in
95 mL of water. The solution is boiled in a glass bottle. 5 mL of a solution of trisodium citrate dihydrate 7.5.10-3 mol·L-1 (molar citrate-to-gold ratio 1.5) are prepared and added to the gold precursor solution under vigorous stirring. The mixture is heated for 30 minutes and cooled to room temperature. The 15 nm particles were prepared by a similar procedure, with a molar citrate-to-gold ratio of 3.5.
Ligand synthesis. TegA (N‐{2‐[2‐(2‐methoxyethoxy)ethoxy]ethyl}‐6‐sulfanylhexanamide) is synthesized using the method reported by Pengo et al.64 Peptide coupling for TegA is performed using the protocol described by Kleinert.65 DHLA-jeffamine was kindly provided by the
Laboratoire de Physique et d’Etude des Matériaux.
Mixed SAMs formation on gold nanoparticles. The 35 nm TegA/MUA-capped nanoparticles are given as example. A suspension of 35 nm gold nanoparticles (initial gold concentration [Au]=2.5·10-4 mol·L-1) is gently centrifuged for 30 minutes at 3000 g and the supernatant is removed in order to reduce 6 times its initial volume. The concentrated suspension is divided into 500 µL batches and 1500 µL of absolute ethanol was added to each batch so that the final Au concentration in each aliquot is [Au] = 3.75·10-4 mol·L-1. Separately, solutions of each ligands in absolute ethanol are prepared, with a concentration of 2.6·10-4 mol.L-1. 30 µL of the TegA solution
are added to a gold nanoparticles aliquot, corresponding to a surface coverage of 3.5 TegA·nm-².
Then, 13 µL of the MUA solution are added, corresponding to a surface coverage of 1.5 MUA·nm -². Consequently, the total surface coverage is 5 thiols·nm-², which corresponds to full surface
coverage. The vial is then closed and the reaction medium is put in an oven at 40°C for 1 hour in order to allow reorganization of monolayer and eventual ligand exchange. Similar experiments are performed with only TegA (5 TegA·nm-²) and only MUA (5 MUA·nm-²), respectively, for references. Note that the same experiment for a 1:1 TegA:MUA composition leads to poorly stable suspensions that hinder precise TEM investigations.
21
Bringing contrast in the SAM. After 1 h of equilibration, tetraethylorthosilicate (TEOS) is added (40 µL of an ethanolic solution at 0.375 mol·L-1, for a molar ratio Au:TEOS = 1:2). Ammonia is
immediately added (90 µL, 14.8 mol·L-1). The reaction medium is stirred manually between each
addition and finally heated again in an oven at 40°C for 15 hours. Then, after centrifugation and redispersion in ethanol, a drop of the suspension is deposited and dried on a carbon-coated copper grid for further analyses by transmission electron microscopy (TEM) using a Tecnai Spirit 2 microscope operating at a 120 kV voltage.
Similar protocols have been applied for the other nanoparticles, by varying the ligand ratios, the ligand nature (TegA, MUA, MHA, DHLA-jeffamine), the silica precursor (TEOS)-to-gold ratio, and the particle size (35 and 15 nm nanoparticles. The 15 nm citrate-capped particles are centrifuged for 2 hours at 7000 g).
Acknowledgements
We thank Condensed Matter Theory Group KOMET 331 for providing access to its computational facilities and the Deutsche Forschungsgemeinschaft for financial support (SU 752/1). Our simulations were performed on ZDV cluster. This work was performed using HPC resources from GENCI- [CCRT/CINES/IDRIS] (Grant 2015-[x2015082022]) and the CCRE of Université Pierre et Marie Curie. For experimental work, we acknowledge funding by C’Nano Ile de France - DIM Nano-K under the project NaJaH. We thank the Laboratoire de Physique et d'Etude des Matériaux for DHLA-jeffamine synthesis. Sorbonne Universités-UPMC, the Centre National de la Recherche Scientifique, Collège de France and the METSA (Microscopie Electronique et Sonde Atomique) network are also acknowledged for financial support.
22
References
1. Strong, L.; Whitesides, G. M. Structures of Self-Assembled Monolayer Films of Organosulfur Compounds Adsorbed on Gold Single-Crystals - Electron-Diffraction Studies.
Langmuir 1988, 4, 546-558.
2. Bolintineanu, D. S.; Lane, J. M. D.; Grest, G. S. Effects of Functional Groups and Ionization on the Structure of Alkanethiol-Coated Gold Nanoparticles. Langmuir 2014, 30, 11075-11085.
3. De Gennes, P. G. Noble Lecture.
http://nobelprize.org/nobel_prizes/physics/laureates/1991/gennes-lecture.html.
4. Casagrande, C.; Fabre, P.; Raphael, E.; Veyssie, M. Janus Beads - Realization and Behavior at Water Oil Interfaces. Europhysics Letters 1989, 9, 251-255.
5. Casagrande, C.; Veyssie, M. Janus Beads - Realization and 1st Observation of Interfacial Properties. Comptes Rendus De L Academie Des Sciences Serie Ii 1988, 306, 1423-1425.
6. McConnell, M. D.; Kraeutler, M. J.; Yang, S.; Composto, R. J. Patchy and Multiregion Janus Particles with Tunable Optical Properties. Nano Letters 2010, 10, 603-609.
7. Kim, J. W.; Lee, D.; Shum, H. C.; Weitz, D. A. Colloid Surfactants for Emulsion Stabilization. Advanced Materials 2008, 20, 3239-+.
8. Liang, F. X.; Shen, K.; Qu, X. Z.; Zhang, C. L.; Wang, Q. A.; Li, J. L.; Liu, J. G.; Yang, Z. Z. Inorganic Janus Nanosheets. Angewandte Chemie-International Edition 2011, 50, 2379-2382.
9. Rodriguez-Fernandez, D.; Liz-Marzan, L. M. Metallic Janus and Patchy Particles.
Particle & Particle Systems Characterization 2013, 30, 46-60.
10. Wang, F.; Cheng, S.; Bao, Z. H.; Wang, J. F. Anisotropic Overgrowth of Metal
Heterostructures Induced by a Site-Selective Silica Coating. Angewandte Chemie-International
Edition 2013, 52, 10344-10348.
11. Miyanohata, R.; Matsushita, T.; Tsuruoka, T.; Nawafune, H.; Akamatsu, K. A Facile Template Synthesis of Asymmetric Gold Silica Heteronanoparticles. Journal of Colloid and
Interface Science 2014, 416, 147-150.
12. Rodriguez-Fernandez, D.; Langer, J.; Henriksen-Lacey, M.; Liz-Marzan, L. M. Hybrid Au-Sio2 Core-Satellite Colloids as Switchable Sers Tags. Chemistry of Materials 2015, 27, 2540-2545.
13. Jackson, A. M.; Myerson, J. W.; Stellacci, F. Spontaneous Assembly of Subnanometre-Ordered Domains in the Ligand Shell of Monolayer-Protected Nanoparticles. Nature Materials
2004, 3, 330-336.
14. Perro, A.; Reculusa, S.; Ravaine, S.; Bourgeat-Lami, E. B.; Duguet, E. Design and Synthesis of Janus Micro- and Nanoparticles. Journal of Materials Chemistry 2005, 15, 3745-3760.
15. Desert, A.; Chaduc, I.; Fouilloux, S.; Taveau, J. C.; Lambert, O.; Lansalot, M.; Bourgeat-Lami, E.; Thill, A.; Spalla, O.; Ravaine, S.; Duguet, E. High-Yield Preparation of
Polystyrene/Silica Clusters of Controlled Morphology. Polymer Chemistry 2012, 3, 1130-1132. 16. Rodriguez-Fernandez, D.; Altantzis, T.; Heidari, H.; Bals, S.; Liz-Marzan, L. M. A Protecting Group Approach toward Synthesis of Au-Silica Janus Nanostars. Chemical
Communications 2014, 50, 79-81.
17. Crane, C. C.; Tao, J.; Wang, F.; Zhu, Y. M.; Chen, J. Y. Mask-Assisted Seeded Growth of Segmented Metallic Heteronanostructures. Journal of Physical Chemistry C 2014, 118, 28134-28142.
23
18. Sun, Y. Y.; Chen, M.; Zhou, S. X.; Hu, J.; Wu, L. M. Controllable Synthesis and Surface Wettability of Flower-Shaped Silver Nanocube-Organosilica Hybrid Colloidal Nanoparticles. Acs
Nano 2015, 9, 12513-12520.
19. Ni, W. H.; Yang, Z.; Chen, H. J.; Li, L.; Wang, J. F. Coupling between Molecular and Plasmonic Resonances in Freestanding Dye-Gold Nanorod Hybrid Nanostructures. Journal of the
American Chemical Society 2008, 130, 6692-+.
20. Chen, T.; Chen, G.; Xing, S. X.; Wu, T.; Chen, H. Y. Scalable Routes to Janus Au-Sio2 and Ternary Ag-Au-Sio2 Nanoparticles. Chemistry of Materials 2010, 22, 3826-3828.
21. Percebom, A. M.; Giner-Casares, J. J.; Claes, N.; Bals, S.; Loh, W.; Liz-Marzan, L. M. Janus Gold Nanoparticles Obtained Via Spontaneous Binary Polymer Shell Segregation.
Chemical Communications 2016, 52, 4278-4281.
22. Kim, H.; Carney, R. P.; Reguera, J.; Ong, Q. K.; Liu, X.; Stellacci, F. Synthesis and Characterization of Janus Gold Nanoparticles. Advanced Materials 2012, 24, 3857-3863.
23. Goldmann, C.; Ribot, F.; Peiretti, L. F.; Quaino, P.; Tielens, F.; Sanchez, C.; Chanéac, C.; Portehault, D. Quantified Binding Scale of Competing Ligands at the Surface of Gold
Nanoparticles: The Role of Entropy and Intermolecular Forces. Small 2017, 10.1002/smll.201604028.
24. Singh, C.; Ghorai, P. K.; Horsch, M. A.; Jackson, A. M.; Larson, R. G.; Stellacci, F.; Glotzer, S. C. Entropy-Mediated Patterning of Surfactant-Coated Nanoparticles and Surfaces.
Physical Review Letters 2007, 99.
25. Pons-Siepermann, I. C.; Glotzer, S. C. Design of Patchy Particles Using Ternary Self-Assembled Monolayers. Soft Matter 2012, 8, 6226-6231.
26. Pons-Siepermann, I. C.; Glotzer, S. C. Design of Patchy Particles Using Quaternary Self-Assembled Monolayers. Acs Nano 2012, 6, 3919-3924.
27. Ge, X. W.; Ke, P. C.; Davis, T. P.; Ding, F. A Thermodynamics Model for the Emergence of a Stripe-Like Binary Sam on a Nanoparticle Surface. Small 2015, 11, 4894-4899.
28. Ghorai, P. K.; Glotzer, S. C. Atomistic Simulation Study of Striped Phase Separation in Mixed-Ligand Self-Assembled Monolayer Coated Nanoparticles. Journal of Physical Chemistry
C 2010, 114, 19182-19187.
29. Santos, A.; Millan, J. A.; Glotzer, S. C. Facetted Patchy Particles through Entropy-Driven Patterning of Mixed Ligand Sams. Nanoscale 2012, 4, 2640-2650.
30. Costa, D.; Pradier, C.-M.; Tielens, F.; Savio, L. Adsorption and Self-Assembly of Bio-Organic Molecules at Model Surfaces: A Route Towards Increased Complexity. Surface Science
Reports 2015, 70, 449-553.
31. Vasumathi, V.; Natalia, M.; Cordeiro, D. S. Molecular Dynamics Study of Mixed Alkanethiols Covering a Gold Surface at Three Different Arrangements. Chemical Physics
Letters 2014, 600, 79-86.
32. Porter, M. D.; Bright, T. B.; Allara, D. L.; Chidsey, C. E. D. Spontaneously Organized Molecular Assemblies .4. Structural Characterization of Normal-Alkyl Thiol Monolayers on Gold by Optical Ellipsometry, Infrared-Spectroscopy, and Electrochemistry. Journal of the
American Chemical Society 1987, 109, 3559-3568.
33. Nuzzo, R. G.; Dubois, L. H.; Allara, D. L. Fundamental-Studies of Microscopic Wetting on Organic-Surfaces .1. Formation and Structural Characterization of a Self-Consistent Series of Polyfunctional Organic Monolayers. Journal of the American Chemical Society 1990, 112, 558-569.
34. Tielens, F.; Costa, D.; Humblot, V.; Pradier, C. M. Characterization of Omega-Functionalized Undecanethiol Mixed Self-Assembled Monolayers on Au(111): A Combined
24
Polarization Modulation Infrared Reflection-Absorption Spectroscopy/X-Ray Photoelectron Spectroscopy/Periodic Density Functional Theory Study. Journal of Physical Chemistry C 2008,
112, 182-190.
35. Tielens, F.; Humblot, V.; Pradier, C.-M. Exploring the Reactivity of Mixed Omega-Functionalized Undecanethiol Self-Assembled Monolayers - a Dft Study. International Journal
of Quantum Chemistry 2008, 108, 1792-1795.
36. Tielens, F.; Santos, E. Aus and Sh Bond Formation/Breaking During the Formation of Alkanethiol Sams on Au(111): A Theoretical Study. Journal of Physical Chemistry C 2010, 114, 9444-9452.
37. Ghorai, P. K.; Glotzer, S. C. Molecular Dynamics Simulation Study of Self-Assembled Monolayers of Alkanethiol Surfactants on Spherical Gold Nanoparticles. Journal of Physical
Chemistry C 2007, 111, 15857-15862.
38. Janecek, J.; Netz, R. R. Interfacial Water at Hydrophobic and Hydrophilic Surfaces: Depletion Versus Adsorption. Langmuir 2007, 23, 8417-8429.
39. Turkevich, J.; Stevenson, P. C.; Hillier, J. A Study of the Nucleation and Growth Processes in the Synthesis of Colloidal Gold. Discussions of the Faraday Society 1951, 55-&. 40. Love, J. C.; Estroff, L. A.; Kriebel, J. K.; Nuzzo, R. G.; Whitesides, G. M.
Self-Assembled Monolayers of Thiolates on Metals as a Form of Nanotechnology. Chemical Reviews
2005, 105, 1103-1169.
41. Hinterwirth, H.; Kappel, S.; Waitz, T.; Prohaska, T.; Lindner, W.; Laemmerhofer, M. Quantifying Thiol Ligand Density of Self-Assembled Monolayers on Gold Nanoparticles by Inductively Coupled Plasma-Mass Spectrometry. Acs Nano 2013, 7, 1129-1136.
42. Stober, W.; Fink, A.; Bohn, E. Controlled Growth of Monodisperse Silica Spheres in Micron Size Range. Journal of Colloid and Interface Science 1968, 26, 62-&.
43. Kuna, J. J.; Voitchovsky, K.; Singh, C.; Jiang, H.; Mwenifumbo, S.; Ghorai, P. K.; Stevens, M. M.; Glotzer, S. C.; Stellacci, F. The Effect of Nanometre-Scale Structure on Interfacial Energy. Nature Materials 2009, 8, 837-842.
44. Verma, A.; Uzun, O.; Hu, Y. H.; Hu, Y.; Han, H. S.; Watson, N.; Chen, S. L.; Irvine, D. J.; Stellacci, F. Surface-Structure-Regulated Cell-Membrane Penetration by Monolayer-Protected Nanoparticles. Nature Materials 2008, 7, 588-595.
45. Clegg, R. S.; Hutchison, J. E. Control of Monolayer Assembly Structure by Hydrogen Bonding Rather Than by Adsorbate-Substrate Templating. Journal of the American Chemical
Society 1999, 121, 5319-5327.
46. Chinwangso, P.; Jamison, A. C.; Lee, T. R. Multidentate Adsorbates for Self-Assembled Monolayer Films. Accounts of Chemical Research 2011, 44, 511-519.
47. Berendsen, H. J. C.; Vanderspoel, D.; Vandrunen, R. Gromacs - a Message-Passing Parallel Molecular-Dynamics Implementation. Computer Physics Communications 1995, 91, 43-56.
48. Van der Spoel, D.; Lindahl, E.; Hess, B.; Groenhof, G.; Mark, A. E.; Berendsen, H. J. C. Gromacs: Fast, Flexible, and Free. Journal of Computational Chemistry 2005, 26, 1701-1718. 49. Hess, B.; Kutzner, C.; van der Spoel, D.; Lindahl, E. Gromacs 4: Algorithms for Highly Efficient, Load-Balanced, and Scalable Molecular Simulation. Journal of Chemical Theory and
Computation 2008, 4, 435-447.
50. Pronk, S.; Pall, S.; Schulz, R.; Larsson, P.; Bjelkmar, P.; Apostolov, R.; Shirts, M. R.; Smith, J. C.; Kasson, P. M.; van der Spoel, D.; Hess, B.; Lindahl, E. Gromacs 4.5: A High-Throughput and Highly Parallel Open Source Molecular Simulation Toolkit. Bioinformatics
25
51. Oostenbrink, C.; Villa, A.; Mark, A. E.; Van Gunsteren, W. F. A Biomolecular Force Field Based on the Free Enthalpy of Hydration and Solvation: The Gromos Force-Field Parameter Sets 53a5 and 53a6. Journal of Computational Chemistry 2004, 25, 1656-1676. 52. Malde, A. K.; Zuo, L.; Breeze, M.; Stroet, M.; Poger, D.; Nair, P. C.; Oostenbrink, C.; Mark, A. E. An Automated Force Field Topology Builder (Atb) and Repository: Version 1.0.
Journal of Chemical Theory and Computation 2011, 7, 4026-4037.
53. Heinz, H.; Vaia, R. A.; Farmer, B. L.; Naik, R. R. Accurate Simulation of Surfaces and Interfaces of Face-Centered Cubic Metals Using 12-6 and 9-6 Lennard-Jones Potentials. Journal
of Physical Chemistry C 2008, 112, 17281-17290.
54. Luque, N. B.; Santos, E.; Andres, J.; Tielens, F. Effect of Coverage and Defects on the Adsorption of Propanethiol on Au(111) Surface: A Theoretical Study. Langmuir 2011, 27, 14514-14521.
55. Kresse, G.; Furthmuller, J. Efficient Iterative Schemes for Ab Initio Total-Energy Calculations Using a Plane-Wave Basis Set. Physical Review B 1996, 54, 11169-11186. 56. Kresse, G.; Joubert, D. From Ultrasoft Pseudopotentials to the Projector Augmented-Wave Method. Physical Review B 1999, 59, 1758-1775.
57. Perdew, J. P.; Burke, K.; Ernzerhof, M. Generalized Gradient Approximation Made Simple. Physical Review Letters 1996, 77, 3865-3868.
58. Perdew, J. P.; Burke, K.; Ernzerhof, M. Generalized Gradient Approximation Made Simple (Vol 77, Pg 3865, 1996). Physical Review Letters 1997, 78, 1396-1396.
59. Tielens, F.; Gervais, C.; Lambert, J. F.; Mauri, F.; Costa, D. Ab Initio Study of the Hydroxylated Surface of Amorphous Silica: A Representative Model. Chemistry of Materials
2008, 20, 3336-3344.
60. Calatayud, M.; Tielens, F.; De Proft, F. Reactivity of Gas-Phase, Crystal and Supported V2o5 Systems Studied Using Density Functional Theory Based Reactivity Indices. Chemical
Physics Letters 2008, 456, 59-63.
61. de Bocarme, T. V.; Chau, T. D.; Tielens, F.; Andres, J.; Gaspard, P.; Wang, R. L. C.; Kreuzer, H. J.; Kruse, N. Oxygen Adsorption on Gold Nanofacets and Model Clusters. Journal of
Chemical Physics 2006, 125.
62. Tielens, F.; Andres, J.; Chau, T. D.; de Bocarme, T. V.; Kruse, N.; Geerlings, P. Molecular Oxygen Adsorption on Electropositive Nano Gold Tips. Chemical Physics Letters
2006, 421, 433-438.
63. Grimme, S.; Antony, J.; Ehrlich, S.; Krieg, H. A Consistent and Accurate Ab Initio Parametrization of Density Functional Dispersion Correction (Dft-D) for the 94 Elements H-Pu.
Journal of Chemical Physics 2010, 132.
64. Pengo, P.; Polizzi, S.; Battagliarin, M.; Pasquato, L.; Scrimin, P. Synthesis,
Characterization and Properties of Water-Soluble Gold Nanoparticles with Tunable Core Size.
Journal of Materials Chemistry 2003, 13, 2471-2478.
65. Kleinert, M.; Winkler, T.; Terfort, A.; Lindhorst, T. K. A Modular Approach for the Construction and Modification of Glyco-Sams Utilizing 1,3-Dipolar Cycloaddition. Organic &
26
Table of Contents Figure
Driven by simulations, phase segregation at the nanoscale is evidenced and controlled by