HAL Id: inserm-01795610
https://www.hal.inserm.fr/inserm-01795610
Submitted on 18 May 2018HAL is a multi-disciplinary open access archive for the deposit and dissemination of sci-entific research documents, whether they are pub-lished or not. The documents may come from teaching and research institutions in France or abroad, or from public or private research centers.
L’archive ouverte pluridisciplinaire HAL, est destinée au dépôt et à la diffusion de documents scientifiques de niveau recherche, publiés ou non, émanant des établissements d’enseignement et de recherche français ou étrangers, des laboratoires publics ou privés.
Development of a bar code-based exposure assessment
method to evaluate occupational exposure to
disinfectants and cleaning products: a pilot study
Catherine Quinot, Sylvie Amsellem-Dubourget, Sofia Temam, Etienne Sévin,
Christine Barreto, Arzu Tackin, Jérémy Félicité, Sarah Lyon-Caen, Valérie
Siroux, Raphaële Girard, et al.
To cite this version:
Catherine Quinot, Sylvie Amsellem-Dubourget, Sofia Temam, Etienne Sévin, Christine Barreto, et al.. Development of a bar code-based exposure assessment method to evaluate occupational exposure to disinfectants and cleaning products: a pilot study. Occupational and Environmental Medicine, BMJ Publishing Group, 2018, Epub ahead of print. �10.1136/oemed-2017-104793�. �inserm-01795610�
1
DEVELOPMENT OF A BARCODE-BASED EXPOSURE ASSESSMENT METHOD TO EVALUATE OCCUPATIONAL EXPOSURE TO DISINFECTANTS AND CLEANING PRODUCTS – A PILOT STUDY
Catherine Quinot1,2, Sylvie Amsellem-Dubourget3, Sofia Temam1,2,4, Etienne Sévin5, Christine Barreto3,6,
Arzu Tackin7, Jérémy Félicité5, Sarah Lyon-Caen8, Valérie Siroux8, Raphaële Girard6, Alexis Descatha1,2,9,
Nicole Le Moual1,2, Orianne Dumas1,2
1. INSERM, VIMA: Aging and chronic diseases. Epidemiological and public health approaches, U1168, F-94807, Villejuif, France
2. UVSQ, UMR-S 1168, University Versailles St-Quentin-en-Yvelines, F-78180, Montigny Le Bretonneux, France
3. ProdHyBase, CClin Sud-Est, Saint-Genis-Laval, France
4. University Paris-Sud, Faculty of Medicine, Le Kremlin-Bicêtre, France 5. Epiconcept, Paris, France
6. ProdHyBase, Unit of hygiene and epidemiology, Hospices Civils de Lyon, Pierre-Bénite, France
7. AP-HP UVSQ, Equipe opérationelle d’hygiène hospitalière, University Hospital of Poincaré, Garches, France
8. INSERM, CNRS, Univ. Grenoble-Alpes, U1209, Institute for Advanced Biosciences (IAB), Team of Environmental Epidemiology applied to Reproduction and Respiratory Health, Grenoble (La Tronche), France
9. AP-HP UVSQ, Occupational Health Unit/Population-Based Epidemiological Cohorts Unit, UMS 011, University Hospital of Poincaré, Garches, France Corresponding author: Catherine Quinot, 16 avenue Paul Vaillant Couturier 94800 Villejuif France catherine.quinot@inserm.fr 0145595196 Word count (excluding title page, abstract, references and figure and tables): 3355 Number of tables and figures: 3 Key words: Cleaning products – Smartphone application – Occupational exposure – Hospital workers
Funding: Anses-PNR-EST-2015-1-022/Ademe-1594C0091; Univ Paris-Sud/IRESP; thesis grant UVSQ; Open Health Institute grant
2 ABSTRACT Objectives Healthcare workers are highly exposed to various types of disinfectants and cleaning products. Assessment of exposure to these products remains a challenge. We aimed to investigate the feasibility of a method, based on a smartphone application and barcodes, to improve occupational exposure assessment among hospital/cleaning workers in epidemiological studies. Methods A database of disinfectants and cleaning products used in French hospitals, including their names, barcodes and composition was developed using several sources: ProdHyBase® (a database of disinfectants managed by hospital hygiene experts), specific regulatory agencies and industrials’ websites. A smartphone application has been created to scan barcodes of products and fill a short questionnaire. The application was tested in a French hospital. The ease of use and the ability to record information through this new approach were estimated. Results The method was tested in a French hospital (7 units, 14 participants). Through the application, 126 records (one record referred to one product entered by one participant/unit) were registered, a majority were liquids (55.5%) or sprays (23.8%); 20.6% were used to clean surfaces and 15.9% to clean toilets. Workers used mostly products with alcohol and quaternary ammonium compounds (quats; >90% with weekly use) followed by hypochlorite bleach and hydrogen peroxide (28.6%). For most records, information was available on the name (93.7%) and barcode (77.0%). Information on product compounds was available for all products and recorded in the database. Conclusion This innovative and easy-to-use method could help to improve the assessment of occupational exposure to disinfectants/cleaning products in epidemiological studies.
3
WHAT THIS PAPER ADDS?
• What is already known about this subject?
Assessment of occupational exposure to disinfectants and cleaning products is a challenge. Development of new methods is needed.
• What are the new findings?
A new methodology based on a database of disinfectants/cleaning products and a smartphone application with a barcode reader was developed to identify disinfectants and cleaning products used in a hospital. We showed the ease of use of this new method and the feasibility to record the composition of the products through the name and barcode of records.
• How might this impact on policy or clinical practice in the foreseeable future?
This innovative and easy-to-use method could help to identify chemicals to which healthcare workers are exposed. It will contribute to enhance health risk assessment and to develop preventive strategies.
4
INTRODUCTION
Chemical substances are present everywhere in the daily life, and understanding their effect on health is essential.[1] Exposure to chemicals commonly found at home or at the workplace, such as cleaning products, may be associated with several diseases, including fertility disorders, cardiovascular health and respiratory diseases.[2–4] Many studies have described the respiratory health effects of exposure to chemicals, particularly at work.[5,6] Disinfectants/cleaning products have been associated with adverse asthma outcomes.[7,8] Healthcare and cleaning workers are highly exposed to chemicals due to the cleaning and disinfection tasks they carry out.[9,10]
In epidemiological studies, one of the limitations to evaluate the health effects of specific chemicals contained in disinfectants/cleaning products is the lack of optimal method to accurately assess exposure. Commonly used methods are self-report, expert assessment, job-exposure matrices or environmental measurements.[11–15] In most studies, occupational exposure to disinfectants/cleaning products has been evaluated using questionnaires which can be prone to recall bias.[16,17] Another challenge is that cleaning products contain many different chemical substances, often unknown by participants, and the panel and the composition of the products available on the market can evolve rapidly.[18]
New tools such as smartphone applications with sensors (eg, barcodes reader) are increasingly used in epidemiology,[19] and can improve data collection.[20] A new assessment method based on the use of barcodes has been proposed to determine the type of cleaning and personal care products used at home.[21] To our knowledge this method has never been applied to evaluate occupational exposure to cleaning products.
We aimed to investigate the feasibility of an innovative method, based on a smartphone application and barcodes, to improve, in epidemiological studies, assessment of occupational exposure to disinfectant and cleaning products among hospital/cleaning workers. Three steps were developed to meet the aims: (1) to develop a database of cleaning products used in hospitals; (2) to develop a smartphone application to scan products’ barcodes and fill a short questionnaire; (3) to test and evaluate this new method in a pilot study conducted in a French hospital.
5
METHODS
Database of disinfectants and cleaning products
Several sources were used to develop the database. The initial source was ProdHyBase®, a non-exhaustive database of disinfectants, detergents and hand hygiene products used in French hospitals, managed by hospital hygiene experts. Products are declared by industrial suppliers to the ProdHyBase® team (SAD, CB, RG), who after checking information for correctness and completeness enter information on the product (e.g., name, use, physical form) on a website (http://www.prodhybase.fr/). A product’s file contains the technical sheet, the safety data sheet (SDS), the label (with/without barcodes), information about safety standards and the Simmbad sheet. Simmbad is a website where active substances of biocide products declared by suppliers are listed (http://simmbad.fr/). Then, to complete information of ProdHyBase® regarding the composition, an investigator (CQ) searched on internet the most recent technical sheet, SDS and Simmbad sheet of each product.
Using all these sources, CQ, in collaboration with hospital hygiene experts (SAD, CB, RG) designed a database of disinfectants/cleaning products used in French hospitals. The database contains, for each product, information on its name, barcode, type of use, physical form (e.g., spray, wipes) and composition. We searched the database for a specific list of substances most commonly found in cleaning products and disinfectants: formaldehyde, glutaraldehyde, orthophtalaldehyde, hypochlorite bleach, hydrogen peroxide, peracetic acid, acetic acid, alcohol, ammonia, quaternary ammoniums compounds (quats), ethylene oxide, chloramine T, phenolic compounds, enzymatic cleaner, glycol ether, amine and perfume. Some of these compounds have been identified in the literature as potentially at risk for causing or exacerbating asthma.[16,18,22] A toxicologist checked substance identification from the ingredient list.
Smartphone application
The development of the application (figure E1, online supplement) was done by Epiconcept, a company specialized in the development of information technologies systems for public health (http://www.epiconcept.fr/en).
The application contains a barcode reader to scan the barcode and 7 fields to be completed manually: name of the product scanned, frequency of use (per week and per day), type of use (e.g., hand rub, instruments), physical form (e.g., liquid, spray), use of protective equipment and whether the product is used in a confined place.
The application was developed under Android operating system using Voozanoo (http://www2.voozanoo.net/en), a web secure and open source information system construction platform, which enables creation of a questionnaire and management of an application and the data it collects.
6 Test of the smartphone application – description of data collected The application was tested for two weeks in February 2017 at Raymond Poincare hospital (teaching hospital, 393 beds, Garches, France) in 7 units: outpatient, endoscopy, laboratory of anatomo-pathology, infectious diseases, radiology, operating room and anaesthetic induction room. A meeting was organized to explain the pilot study to the hospital staff before the test. In each unit, the participation of at least one nurse (or, when applicable, a radiology or laboratory technician), one auxiliary nurse and one cleaning worker was solicited. Fourteen workers participated in the pilot study. As one cleaning worker was registered in 2 different units, 2 usernames were attributed to this worker (1 for each unit). In total, 15 usernames were registered in the application. An investigator briefly explained the use of the application to each participant. Some participants tested the application on their own and other solicited the investigator. A smartphone with the application already installed, a username and an access code to log in were provided for half a day. Participants had to scan the barcode and complete a questionnaire for all disinfectants/cleaning products they used at work, check and validate their answers. Descriptive analyses regarding characteristics of participants, units, number of records per participants (one record referred to one product recorded by one participant in one unit), type, frequency of use, usage and composition of products were performed. The pilot study was approved by the Ethics evaluation committee and Institutional Review Board of INSERM (CEEI/IRB IRB00003888, January 17, 2017). Evaluation of the method We evaluated the method according to several criteria as described below. Missing data and input errors The percentage of missing data for barcodes and names, and the percentage of input errors for the names were evaluated. Barcodes or names of products recorded were compared with pictures and with information found through web search.
Link between records and database of disinfectants/cleaning products
After completing and correcting barcodes and names of the products recorded, we matched them with barcodes and names of the disinfectants/cleaning products database in order to find the composition (step 1, figure E2, online supplement). The percentage of records found in the database of disinfectants/cleaning products and thus with information on composition was evaluated. For products recorded but not found in the database, we used web search and pictures to complete the composition, the physical form or the usage of a record. Then, these records were added in the database (step 2, figure E2, online supplement), and the percentage of records for which the composition was available was evaluated.
7
Agreement between pictures and information recorded
The investigator took pictures of the package of products scanned by participants in order to evaluate a
posteriori the quality of the information entered (products’ names and barcodes). Satisfaction questionnaire An evaluation questionnaire (figure E3, online supplement) was given to evaluate participants’ satisfaction. Statistical analyses were performed using SAS V.9 (SAS Institute, Cary, NC, USA).
8
RESULTS
Database of disinfectants and cleaning products
The initial database of disinfectants/cleaning products contained 799 names (table E1, online supplement). Barcodes were available for 28% of the products and information on the composition for 98%. Some products had up to 30 ingredients. For one product, several physical forms could exist (e.g., spray, wipes) with as many barcodes as physical forms. Regarding usage, 33%, 26%, 22% and 5% of products were dedicated to clean/disinfect surfaces, hands, medical devices or instruments and toilets respectively.
Test of the smartphone application – description of the data collected Participants and units
Participants were on average 47 years old (range 27-64) and most were women (86.7%). Their jobs and hospital units are described in table 1.
Number of products
During the pilot study, we collected 126 records corresponding to 50 different names of products. Participants recorded 8.4 products on average (range 2-16). The highest mean number of products was recorded in radiology and anaesthetic induction room (table 1).
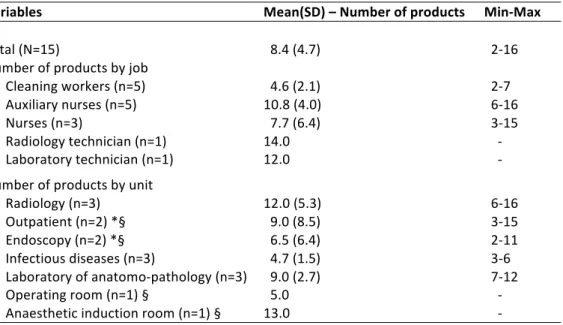
Table 1.Description of the number of products used according to job type and unit, Raymond Poincare Hospital, February 2017
Variables Mean(SD) – Number of products Min-Max
Total (N=15) 8.4 (4.7) 2-16 Number of products by job Cleaning workers (n=5) 4.6 (2.1) 2-7 Auxiliary nurses (n=5) 10.8 (4.0) 6-16 Nurses (n=3) 7.7 (6.4) 3-15 Radiology technician (n=1) 14.0 - Laboratory technician (n=1) 12.0 - Number of products by unit Radiology (n=3) 12.0 (5.3) 6-16 Outpatient (n=2) *§ 9.0 (8.5) 3-15 Endoscopy (n=2) *§ 6.5 (6.4) 2-11 Infectious diseases (n=3) 4.7 (1.5) 3-6 Laboratory of anatomo-pathology (n=3) 9.0 (2.7) 7-12 Operating room (n=1) § 5.0 - Anaesthetic induction room (n=1) § 13.0 - * The same cleaning worker was registered in two different units § In outpatient/endoscopy, the nurse and auxiliary nurse were registered for one unit but worked in the two units. They recorded all the products they used without distinction between outpatient/endoscopy. Given proximity of the operating room and anaesthetic induction room, we hypothesized that the workers were in the same situation.
9 Frequency of use Most of the products were used more than once a week (50.0% 4-7 days/week, 20.6% 2-3 days/week and 9.5% 1 day/week). Among products used weekly, 16.8% were used more than 20 times/day (table E2, online supplement). Use of sprays 4-7 days/week was reported by 75.0% of the nurses, and by around half of the cleaning workers, radiology technicians and auxiliary nurses. For those who used spray weekly, around 25.0% of the cleaning workers, nurses and auxiliary nurses declared using it more than 20 times/day (table E3, online supplement).
Physical forms
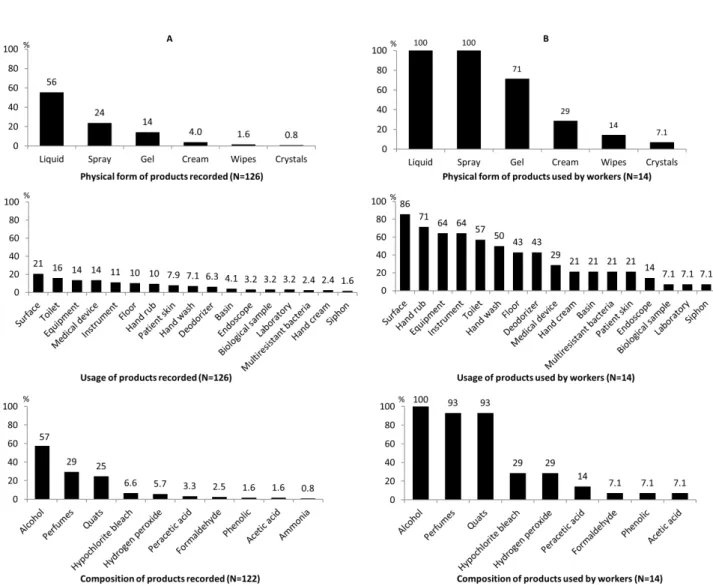
Among the 126 records, a majority were liquid products(figure 1A). All of the 14 workers, used liquid and spray products weekly (figure 1B). Physical forms of products by jobs and units are described in table E4 (online supplement).
Usage
Out of 126 records, a majority were for surfaces, followed by toilets, equipments, medical devices, instruments and floors (figure 1A). Among the 14 workers, most used surface, hand rub, equipment, instrument, toilet and hand wash products weekly (50%-86%, figure 1B). In particular, use of hand rub/wash products was registered in all units and by 11 participants out of 14; all of those declared to use this type of product 4-7 days/week and 6 participants used it more than 20 times a day. Usage of products by jobs and units are described in table E5 (online supplement). Composition Alcohol was the most commonly recorded component, followed by perfumes, quats, hydrogen peroxide and hypochlorite bleach. Ammonia, acetic acid, phenolic, formaldehyde and peracetic acid were contained in a few products (figure 1A). Glutaraldehyde, orthophalaldehyde, ethylene oxide, chloramine T were not found. Out of 14 workers, all reported weekly use of products with alcohol, and more than 90% reported products containing perfumes or quats (figure 1B). Auxiliary nurses declared a majority of products with alcohol, perfume and quats. Peracetic acid, acetic acid and phenolic were only found in products used in outpatient and endoscopy, and ammonia in anaesthetic induction room (table 2).
10
Table 2. Ingredient identified in the disinfectants/cleaning products recorded during the pilot study, by job and unit (N=122 records)*, Raymond Poincare Hospital, February 2017
Formaldehyde Hypochlorite
bleach Hydrogen peroxide Peracetic acid Acetic acid Alcohol Ammonia Quats Phenolic Enzymatic cleaners Glycol ether Perfume Amine
Jobs Cleaning workers (n=5) 0 0 0 0 0 13 0 5 0 0 1 3 5 Auxiliary nurses (n=5) 1 4 4 2 1 29 1 12 1 4 3 20 10 Nurses (n=3) 1 1 2 2 1 11 0 9 1 4 1 7 4 Radiology technician (n=1) 0 2 1 0 0 10 0 3 0 1 1 4 4 Laboratory technician (n=1) 1 1 0 0 0 7 0 1 0 0 0 2 0 Total 3 8 7 4 2 70 1 30 2 9 6 36 23 Units Radiology (n=3) 1 4 1 0 0 21 0 8 0 2 2 10 7 Outpatient (n=2) 1 1 2 2 1 8 0 6 1 2 1 4 3 Endoscopy (n=2) 0 0 2 2 1 7 0 4 1 2 0 4 2 Infectious diseases (n=3) 0 0 1 0 0 11 0 5 0 1 0 4 5 Anatomo-pathology (n=3) 1 2 0 0 0 15 0 3 0 0 2 7 3 Operating room (n=1) 0 0 0 0 0 3 0 2 0 1 0 2 1 Anaesthetic induction room (n=1) 0 1 1 0 0 5 1 2 0 1 1 5 2 Total 3 8 7 4 2 70 1 30 2 9 6 36 23 *Composition was available for the 126 records. For 4 products, composition did not include any of these ingredients. Quats: quaternary ammonium compounds
11
Evaluation of the method Missing data / input errors
Out of 126 records, barcode was missing for 23.0% of the records, but the product’s name was recorded instead. The name was missing for 6.3% of the records, and when specified, 33.9% of names had input errors (incomplete name/typing error). However, in all cases, a barcode was recorded, and the name was found through internet search. Overall, all products were identifiable. For other questions, no missing data was observed, except for the frequency of use per day (0.8%). Link between records and database of disinfectants/cleaning products At first, 8 names and 6 barcodes of the 50 products recorded during the pilot study were identified in the database of disinfectants/cleaning products initially developed (n=799). This information allowed obtaining the composition of 44 out of the 126 records (34.9%) (a name of product can be recorded in several jobs and units). The 42 remaining products recorded during the test but not found in the database of disinfectants/cleaning products were then added to the database (n=841). Pictures
Pictures were collected by the investigator for 103 records (81.7%) out of 126. Barcodes were present in 81.6% of the cases. Comparison between pictures and information entered through the application identified 3 records with detection error for the barcode.
Satisfaction questionnaire
All participants were either very satisfied or satisfied of explanations given regarding the use of the application, and 85% regarding the ease of use. Information for one record was declared to be entered in less than 1 minute by 23% of participants and 1-2 minutes by 54%. Only 7% of the participants reported to be slightly disturbed by the use of the application during their work tasks. More details regarding satisfaction are provided in online supplement (figure E3).
12
DISCUSSION
We developed a method based on a smartphone application to assess occupational exposure to disinfectants/cleaning products in several units of a French hospital. The 14 participants of the pilot study recorded on average 8.4 products corresponding in total to 50 different products. About 80% of products recorded were declared to be used weekly. Most reported products were in liquid or spray form; such products were used by all workers weekly. More than 90% of the workers used products containing alcohol and quats weekly.
The method was based on a database of disinfectants/cleaning products in addition to a smartphone application (barcode reader, short questionnaire). Based on the criteria of evaluation (high level of satisfaction of participants, good agreement between pictures and information recorded, low number of missing data and input errors, and information on the composition completed for all products recorded), the results suggested that the method developed is feasible and applicable to a larger study.
Exposure assessment
To our knowledge, only one study used barcodes to describe the use of cleaning products at home.[21] The use of this method to assess occupational exposures has never been reported. Among methods currently used to assess occupational exposure to disinfectants/cleaning products, each has limitations. The expert method or quantitative exposure measurements are often considered as gold standards but are hardly applicable to large epidemiological studies.[11,14,15] Self-reported exposure is applicable to large populations, but recall bias can be observed, particularly when evaluating occupational exposure to specific disinfectants/cleaning products; indeed, healthcare workers have been shown to underestimate their exposure.[11] Job-exposure matrices are also used to evaluate occupational exposure in large populations, but variability within jobs is not considered.[12,23] Recently, a job-task-exposure matrix (JTEM) taking into account variability of exposure within jobs has been developed to evaluate exposure to seven disinfectants/spray, but may still be limited in assessing accurately individual exposure levels.[24] The exposure assessment method presented in the current study has been designed to evaluate individual exposure levels, potentially in large populations, without relying on the participants’ knowledge about their own exposures.
We found that a majority of products used by hospital workers contained alcohol, perfumes and quats. Weekly use of alcohol-based products was reported in all occupations. Other disinfectants frequently used included hypochlorite bleach and hydrogen peroxide. Consistently, in a large study of U.S. nurses,[25] participants working in a hospital reported using mostly alcohol, hypochlorite bleach and quats (41%, 24%, 15%). In the same population, nurses were classified as highly exposed to alcohol, hypochlorite bleach or quats by a JTEM (41%, 34% 48%).[24] High level of exposure to alcohol was also measured in 5 U.S. hospitals [15] and in one French hospital.[14] In another study conducted in French hospitals, Gonzalez et al [22]
13
reported that around 75%, 50% and 20% of participants were exposed to quats, chlorinated products/bleach (mainly cleaners) and glutaraldehyde, respectively. In 5 U.S. hospitals, Saito et al [26] observed that products containing alcohols were the most frequently used by clinical laboratory technician, certified nursing assistants and registered nurses (58%, 75%, 68% of shifts) for a mean duration of 45 minutes. For housekeepers, products with alcohol and quats were the most frequently used (>90% of shifts) for a mean duration of 115 minutes.[26] Database of disinfectants and cleaning products Establishing the database of disinfectants/cleaning products was an important step in the development of the method to link products’ barcodes to their composition. Designing an exhaustive database of products used in French hospital is challenging. Having a purchase file of all hospital products could be helpful for this purpose but this information was not available at Raymond Poincare hospital. Composition of the products listed in the database must be as exhaustive as possible. We tried to identify as many ingredients as possible using several sources (SDS, Technical sheet, Simmbad sheet, labels and information on ProdHyBase®). However, these documents do not list all chemicals present in a product; SDS, Simmbad sheet and Technical sheet are written by the suppliers who do not have the obligation to enter all components.[27] Through ProdHyBase® we obtained an important list of products used in hospitals, mostly disinfectants and fewer detergents. Few toilet products were available and products used in the laboratory like alcohol were not included. Moreover, concentrations of the products’ components were not defined, preventing quantifying the level of exposure in our study. After linking the records and the database of disinfectants/cleaning products, around one third of the records were found in the database. As expected, some of the products used for toilet or laboratory were not found in the database. The database was completed a posteriori with the products recorded during the test. Internet and the pictures taken were important sources to complete information on the composition for these products. Moreover, it was necessary to have the name and the barcode to reliably identify products as barcode or name alone could be insufficient. Smartphone application
Several smartphone applications are used in the area of health nowadays.[21,28–34] In majority, these applications help managing diseases or measuring health indicators.[34] Some allow to assess exposure such as food intake.[35] In our study, we used the camera of a smartphone to detect barcodes of disinfectants/cleaning products. The use of barcodes was shown to be reliable by Bennett et al [21] to obtain detailed information on domestic products. Furthermore, some studies suggested that self-administered questionnaire via application does not affect data collection, can improve data completeness,[20] and validate the use of application to collect data.[36]
14
Participants made several suggestions regarding the form and contents of the application (e.g., reformulating some questions and items, enlarging font), which will be added in a next version of the application. However, overall, they were satisfied regarding the ease of use of the application. Test of the smartphone application The pilot study was conducted in only one hospital, with few participants from 7 hospital units, which may not be representative of other workers in this hospital neither from other French hospitals. We acknowledge that it is the main limitation of our study. However, the major aim was to test the feasibility of the method. To avoid wasting time at work, some workers may not have recorded all products they use. However, we observed a strong involvement from the workers and their supervisors, who fully supported the study. A strength of the method was to avoid questioning workers directly on the substances contained in the products they use, as they may not know their composition. However, a few workers reported difficulties to answer questions about the frequency of use of products.
Some products with similar names may differ in composition or physical form. Thus, the barcode is important to identify a product, in particular if the name is not correctly entered. A majority of products had barcode on it. However, we cannot conclude that it is true in all hospitals.
Application to a larger study
A future goal is to apply the method developed in this paper to a larger epidemiological study. In this context, an active update of the database of disinfectants/cleaning products would be important for the reliability of the method. Indeed, new products come onto the market frequently and compositions evolve rapidly. An update of the database using data recorded by participants is an alternative option, as shown in the present study. We have taken into account determinants underlined by Suleiman et al [37] expected dilution process, which might be added in a next version of the application. Moreover, the application was only developed on Android operating system, which is not ideal for a larger study if the participants’ own smartphones are used. The development of the application on the IOS operating system will allow expanding the downloading of the application on the personal smartphone of most participants. In the future, an adapted version of this application might also be useful in the context of work safety.
Conclusion
In conclusion, we showed the feasibility of an innovative method to improve the assessment of occupational exposure to disinfectants/cleaning products in epidemiological studies. Going forward, the application could be downloadable to apply the method to a larger study. An improvement of the application could be to include taking pictures of products and automatically include new products in the database of
15
Acknowledgements We would like to thank the workers of Raymond Poincare Hospital who accepted to participate to the study. Thanks to Lawrence Christine and Lagron Patrick and to all executives of all units (radiology, outpatient, endoscopy, infectious diseases, laboratory of anatomo-pathology, operating room and anaesthetic induction room) who helped to perform the study at the hospital. Thanks to Open Health Institute to help to buy the smartphone with the grant. We thank Robert Garnier (Centre anti-poison, Paris, France) for helpful advice regarding substance classification. We also thank Mathias Clement and Ines Taarit who entered data on the disinfectants and cleaning products database, completed information on the composition and categorized the element of the composition.
Contributors CQ contributed to the study conception, collection of the data, statistical programming and data analysis, data interpretation and primary manuscript preparation. SAD, CB and RG permitted the acquisition of the data of ProdHyBase® and contributed to the critical revision of the manuscript. SAD and RG contributed to the study conception. SLC and VS contributed to the study conception and the critical revision of the manuscript. ST contributed to the study conception, collection of the data of ProdHyBase® and the critical revision of the manuscript. AT and AD allowed the test of the smartphone application at the Raymond Poincare hospital and contributed to the critical revision of the manuscript. AD also contributed to the study conception. ET contributed to the study conception, the development of the smartphone application and its backend and contributed to the critical revision of the manuscript. JF contributed to the development of the smartphone application and its backend and to the critical revision of the manuscript. NLM and OD contributed to the study conception, participation in the acquisition of the data, data interpretation, primary manuscript preparation and critical revision of the manuscript.
Funding Anses-PNR-EST-2015-1-022/Ademe-1594C0091; University Paris-Sud/IRESP; University of Versailles St-Quentin en Yvelines EDSP doctoral grant; Open Health Institute grant.
Competing interests None declared
16 References 1 Prüss-Ustün A, Vickers C, Haefliger P, et al. Knowns and unknowns on burden of disease due to chemicals: a systematic review. Environ Heal 2011;10:9. 2 Mehta AJ, Adam M, Schaffner E, et al. Heart rate variability in association with frequent use of household sprays and scented products in SAPALDIA. Environ Health Perspect 2012;120:958–64. 3 Atramont A, Guida F, Mattei F, et al. Professional Cleaning Activities and Lung Cancer Risk Among Women. J Occup Environ Med 2016;58:610–6. 4 Gaskins AJ, Chavarro JE, Rich-Edwards JW, et al. Occupational use of high-level disinfectants and fecundity among nurses. Scand J Work Environ Heal 2017;43:171–80. 5 Tarlo SM, Arif AA, Delclos GL, et al. Opportunities and obstacles in translating evidence to policy in occupational asthma. Ann Epidemiol 2017; doi:10.1016/j.annepidem.2017.03.002 6 Casey ML, Hawley B, Edwards N, et al. Health problems and disinfectant product exposure among staff at a large multispecialty hospital. Am J Infect Control. doi:10.1016/j.ajic.2017.04.003 7 Jeebhay MF, Ngajilo D, le Moual N. Risk factors for nonwork-related adult-onset asthma and occupational asthma: a comparative review. Curr Opin Allergy Clin Immunol 2014;14:84–94. 8 Dumas O, Le Moual N. Do chronic workplace irritant exposures cause asthma? Curr Opin Allergy Clin Immunol 2016;16:75–85. 9 Arif AA, Delclos GL, Serra C. Occupational exposures and asthma among nursing professionals. Occup Environ Med 2009;66:274–8. 10 Folletti I, Siracusa A, Paolocci G. Update on asthma and cleaning agents. Curr Opin Allergy Clin Immunol 2017;17:90–5. 11 Donnay C, Denis M, Magis R, et al. Under-estimation of self-reported occupational exposure by questionnaire in hospital workers. Occup Environ Med 2011;68:611–7. 12 Delclos GL, Gimeno D, Arif AA, et al. Occupational exposures and asthma in health-care workers: Comparison of self-reports with a workplace-specific job exposure matrix. Am J Epidemiol 2009;169:581–7. 13 Dumas O, Donnay C, Heederik D, et al. Occupational exposure to cleaning products and asthma in hospital workers. Occup Environ Med 2012;69:883–9. 14 Bessonneau V, Mosqueron L, Berrubé A, et al. VOC Contamination in Hospital, from Stationary Sampling of a Large Panel of Compounds, in View of Healthcare Workers and Patients Exposure Assessment. PLoS One 2013;8:e55535. 15 LeBouf RF, Virji MA, Saito R, et al. Exposure to volatile organic compounds in healthcare settings. Occup Environ Med 2014;71:642–50. 16 Siracusa A, De Blay F, Folletti I, et al. Asthma and exposure to cleaning products - A European Academy of Allergy and Clinical Immunology task force consensus statement. Allergy Eur J Allergy Clin Immunol 2013;68:1532–45. 17 Dumas O, Varraso R, Zock JP, et al. Asthma history, job type and job changes among US nurses. Occup Environ Med 2015;72:482–8. 18 Gerster FM, Vernez D, Wild PP, et al. Hazardous substances in frequently used professional cleaning products. Int J Occup Environ Health 2014;20:46–60. 19 Freifeld CC, Chunara R, Mekaru SR, et al. Participatory epidemiology: Use of mobile phones for community-based health reporting. PLoS Med 2010;7:1–5. 20 Marcano Belisario J, Jamsek J, Huckvale K, et al. Comparison of self-administered survey questionnaire responses collected using mobile apps versus other methods ( Review ) Comparison of self-administered survey questionnaire responses collected using mobile apps versus other methods. Cochrane Database Syst Rev 2015;(7):MR000042. 21 Bennett DH, Wu X. Passive sampling methods to determine household and personel care product use. J Expo Sci Environ Epidemiol 2012;22:148–60.
17 22 Gonzalez M, Jégu J, Kopferschmitt M-C, et al. Asthma among workers in healthcare settings: role of disinfection with quaternary ammonium compounds. Clin Exp Allergy 2014;44:393–406. 23 Verdun-Esquer C, Naudet C, Druet-Cabanac M, et al. Occupational risk assessment in hospitals : A specific job-exposure matrix. Arch des Mal Prof l’Environnement 2009;70:48–54. 24 Quinot C, Dumas O, Henneberger P, et al. Development of a job-task-exposure matrix to assess occupational exposure to disinfectants among US nurses. Occup Environ Med 2017;74(2):130–7. 25 Dumas O, Wiley AS, Henneberger PK, et al. Determinants of disinfectant use among nurses in U.S. healthcare facilities. Am J Ind Med 2017;60:131–40. 26 Saito R, Virji MA, Henneberger PK, et al. Characterization of Cleaning and Disinfecting Tasks and Product Use Among Hospital Occupations. Am J Ind Med 2015;111:101–11. 27 European Chemicals Agency. Guidance on the compilation of safety data sheets. 2015. https://echa.europa.eu/documents/10162/23036412/sds_en.pdf/01c29e23-2cbe-49c0-aca7-72f22e101e20 (accessed 24 Jul2017). 28 Kosse RC, Bouvy M, de Vries T, et al. mHealth intervention to support asthma self-management in adolescents: the ADAPT study. Patient Prefer Adherence 2017;11:571–7. 29 Parati G, Torlasco C, Omboni S, et al. Smartphone Applications for Hypertension Management: a Potential Game-Changer That Needs More Control. Curr Hypertens Rep 2017;19:48. 30 Nikolaou CK, Lean MEJ. Mobile applications for obesity and weight management: current market characteristics. Int J Obes 2017;41:200–2. 31 Schnall R, Iribarren Rn SJ. Review and analysis of existing mobile phone applications for health careeassociated infection prevention. Am J Infect Control 2015;43:572–6. 32 Huckvale K, Morrison C, Ouyang J, et al. The evolution of mobile apps for asthma: an updated systematic assessment of content and tools. 2015;13:58. 33 Dunford E, Trevena H, Goodsell C, et al. FoodSwitch: A Mobile Phone App to Enable Consumers to Make Healthier Food Choices and Crowdsourcing of National Food Composition Data. 2014;2:e37. 34 Park Y, Lee Y, Lee G, et al. Smartphone Applications with Sensors Used in a Tertiary Hospital—Current Status and Future Challenges. Sensors 2015;15:9854–69. 35 Bejar LM, Sharp BN, García-Perea MD. The e-EPIDEMIOLOGY Mobile Phone App for Dietary Intake Assessment: Comparison with a Food Frequency Questionnaire. JMIR Res Protoc 2016;5:e208. 36 Goedhart G, Kromhout H, Wiart J, et al. Validating self-reported mobile phone use in adults using a newly developed smartphone application. Occup Environ Med 2015;72:812–8. 37 Suleiman A, Svendsen KVH. Presentation of an approach for risk characterization of exposure to chemicals in cleaning work. Saf Sci 2017;91:148–53.
18 Figure Figure 1.Distribution of physical forms, usage and composition of products: (A) data presented as percentage among all products recorded and (B) data presented as percentage of workers reporting weekly use of each product category