C E N T R E D'E T U D E S E T D E R E C H E R C H E S S U R L E D E V E L O P P E M E N T I N T E R N A T I O N A L
SÉRIE ÉTUDES ET DOCUMENTS
Is there a strategy in China’s health official development assistance
to African countries?
Marlène Guillon
Jacky Mathonnat
Études et Documents n° 20
November 2017 First version: May 2017
To cite this document:
Guillon M., Mathonnat J. (2017) “Is there a strategy in China’s health official development assistance to African countries?”, Études et Documents, n° 20, CERDI.
http://cerdi.org/production/show/id/1895/type_production_id/1
CERDI
65 BD. F. MITTERRAND
63000 CLERMONT FERRAND – FRANCE TEL.+33473177400
FAX +33473177428
2
The authors
Marlène Guillon PhD in Economics
School of Economics and CERDI, University Clermont Auvergne - CNRS, Clermont-Ferrand, France.
E-mail: [email protected]
Jacky Mathonnat Professor
School of Economics and CERDI, University Clermont Auvergne - CNRS, Clermont-Ferrand, France.
E-mail: [email protected]
Corresponding author: Marlène Guillon.
This work was supported by the LABEX IDGM+ (ANR-10-LABX-14-01) within the program “Investissements d’Avenir” operated by the French National Research Agency (ANR).
Études et Documents are available online at: http://www.cerdi.org/ed Director of Publication: Grégoire Rota-Graziosi
Editor: Catherine Araujo Bonjean Publisher: Mariannick Cornec ISSN: 2114 - 7957
Disclaimer:
Études et Documents is a working papers series. Working Papers are not refereed, they constitute research in progress. Responsibility for the contents and opinions expressed in the working papers rests solely with the authors. Comments and suggestions are welcome and should be addressed to the authors.
3
Abstract
Chinese health official development assistance (ODA) to Africa has largely increased since the third Forum on China-Africa Cooperation (FOCAC) in 2006. Even if China now ranks among the top ten bilateral donors for health aid in Africa few studies have assessed the determinants of Chinese health ODA to African countries. Our objective is to study the factors associated with Chinese health ODA to Africa in the 2006-2013 period. We investigate the role of three types of factors that might influence the allocation of Chinese health aid: the needs of recipient countries, their merits and the self-interest of China. Chinese health ODA is measured using the AidData's Global Chinese Official Finance Dataset, 2000-2014, Version 1.0. In total, 345 health aid projects were financed by China in Africa between 2006 and 2013, accounting for a total amount of 2014 US$764 million. On these 345 projects, 143 (41%) correspond to the dispatch of medical teams, 107 (31%) to the sending of medical equipment or drugs and 76 (22%) to health infrastructure construction or rehabilitation.
We study the factors associated with the number of health projects and the amount of health ODA received each year by African countries. We stratify the analysis by types of projects (medical team dispatches/infrastructure and medical equipment or drugs projects). Over the 2006-2013 period, Chinese health aid appeared responsive to the economic needs of African countries and unrelated to the quality of their governance. While Chinese aid allocation decision favored countries with limited ability to finance health projects our results show no link between direct health needs of African countries and the volume of Chinese health aid they received. We find no strong evidence that Chinese health aid allocation decisions favored natural resources-rich countries while our results only show small magnitude associations between economic ties to China and the volume of Chinese health ODA received. Finally, our results confirm the idea that health aid might me used by China as part of its foreign policy since non-adherence to the one-China policy makes the receipt of Chinese health aid very unlikely.
Keywords
Health aid, Aid allocation, China, Africa.
JEL classification
F35
This document is a new version of the working paper “Is there a strategy in China’s health official development assistance to African countries?”, Études et Documents, n° 10/2017, CERDI. It uses the new AidData's Global Chinese Official Finance Dataset, 2000-2014, Version 1.0. released in October 2017.
4 1. Introduction
“Ensure healthy lives and promote well-being for all at all ages” is one of the main Sustainable Development Goals (Goal 3). Health aid has risen sharply in the last decade; but health remains largely underfunded, particularly in Africa, and requires a specific effort in international aid (Addis-Abbeba Agenda, 2015). Until the 90’s, Official Development Assistance (ODA) mainly came from Development Assistance Countries (DAC) of OECD (Organisation for Economic Cooperation and Development). For two decades, new donors have emerged in parallel to traditional DAC donors. These new donors include Latin American countries such as Brazil, Chile or Colombia, Arab countries such as Saudi Arabia, Kuwait or United Arab Emirates and Asian countries such as India or China.
The influence of China outside its borders in the field of health is not new. More than fifteen centuries ago, the Silk Road spread Chinese medicine in India, Central Asia and the Middle East. In 1963, Mao-Tse-Tung and Chou-En-Lai sent the first Chinese medical team on the African continent, in Algeria. Since then, Chinese health ODA to Africa has largely increased, in particular since the beginning of the 2000’s. Nowadays, China ranks among the top ten bilateral donors for health aid in Africa (Grépin et al., 2014). In parallel of the increase in Chinese health aid, Chinese aid diplomacy has also evolved over time. Especially, the Chinese aid policy shifted after 2006. In the opening address of the 3rd FOCAC in 2006 Chinese President Hu Jintao called for the creation of a new type of strategic partnership between China and African countries based on “mutual benefit and win-win situations”. Several specific announcements were made during this forum, including the doubling of China’s assistance to Africa by 2009. China also pledged to deepen its health cooperation with Africa by building hospitals and malaria prevention centers on the continent (Kjøllesdal et al., 2010; Declaration of the Beijing Summit of the Forum on China-Africa Cooperation, 2006/11/05). In 2006 was also released the “China’s African Policy”1 document that aimed to shape China’s aid and investment policies in Africa (Lin et al., 2016). This document specifically called for an increase of medical and public health exchanges and cooperation with African countries. In particular it mentioned increased cooperation “in the prevention and treatment of infectious diseases including HIV/AIDS and malaria and other diseases” but also in “research and application of traditional medicine and experience concerning mechanism for public health emergencies”. Given the global shift in Chinese aid policy and the call for reinforced health cooperation in 2006 we focus our analysis on the period following 2006.
A large literature is available regarding the determinants of ODA from OECD countries, regional development banks, United Nations agencies and non-governmental organizations (Berthélemy and Tichit 2004; Dollar and Levin, 2006; Younas, 2008; Lee and Lim, 2014; Acht et al., 2015). Several articles have specifically looked at the determinants of health ODA from traditional private institutions and public donors. These studies have found that health needs of
1
5
recipient countries poorly explain the amount of health aid they receive and that countries with more political rights receive significantly more aid (Esser and Bench, 2011; Fielding, 2011). On the contrary, fewer analyzes of the determinants of ODA from new donor countries, including health ODA, are available. Neumayer (2003) study the factors associated with the allocation of aid by Arab countries. He finds that poorer countries in terms of GDP per capita are more likely to receive some positive amount of Arab aid as well as countries that adopt voting patterns in the United Nations General Assembly (UNGA) similar to Saudi Arabia. Fuchs and Vadlamannati (2013) focus on aid motives of India and show that commercial and political self-interests, as measured by exports of India to recipient countries and by UNGA voting alignment, dominate India’s aid allocation. Dreher et al. (2011) compare the factors associated with aid allocation between DAC donors and new donors, namely Arab, Asian (excluding China), Latin American and Eastern/Central European donors over the 2001-2008 period. They find that new donors weight less recipient countries’ needs, measured by the GDP per capita, than DAC countries in their aid allocation. Moreover, their results show that merit of recipient countries, as measured by the level of corruption, does not influence the aid allocation of new donors. Finally they conclude that evidence of aid allocation based on economic self-interest is lacking for new donors as they find no association between aid of new donors and natural resources endowment of recipient countries or exports to these countries. China is often seen as allocating its ODA in its own interests in order to secure its access to natural resources, favor its exports to emerging markets or extend its political influence (Naim, 2007; Youde, 2010; Lin et al., 2016). On the contrary, China declares allocating its ODA in response to the needs expressed by the recipient countries, according to a "win-win" strategy and following a non-interference principle (Lin et al., 2016, Second White Paper on China's Foreign Aid, 2014). In 2006, at the 3rd FOCAC, Chinese leaders highlighted the principle of "mutual benefits" as an objective of the China-Africa cooperation (Kjøllesdal et al., 2010; Declaration of the Beijing Summit of the Forum on China-Africa Cooperation, 2006/11/05). Three recent studies have investigated the determinants of Chinese aid allocation. Grépin et al. (2014) provide a descriptive analysis of Chinese health aid in Africa between 2000 and 2012. They graphically show that Chinese health aid is not correlated with the natural resources endowment of beneficiary countries. Dreher and Fuchs (2015) study the factors associated with Chinese ODA to all recipient countries between 1956 and 2006. The authors test whether Chinese economic and political interests influence (1) the total amount of ODA; 2) the total number of projects; 3) the amount of food aid and 4) the number of medical teams received by each country. They show that Chinese ODA is independent of beneficiary countries’ oil endowment. They also highlight the importance of political considerations (measured by the UNGA voting alignment of recipient countries with China) in Chinese aid allocation even if they state that China does not pay more attention to politics than Western donors. Finally, Dreher et al. (2017) investigate the factors associated with total amounts of ODA and Other Offcial Flows (OOF) from China to Africa over the 2000-2013 period. They find that the allocation of Chinese ODA is driven primarily by foreign policy considerations (Taiwan recognition, UNGA voting alignment, temporary membership on the United Nations Security Council) while economic interests (trade of China with recipient countries, dummy variable for oil production) better explain the distribution of less concessional flows.
6
Our objective is to study the factors associated with Chinese health ODA to Africa between 2006 and 2013. Chinese health ODA is measured using the AidData's Global Chinese Official Finance Dataset, 2000-2014, Version 1.02. We focus on the period after the third FOCAC, i.e. after 2006, given the global shift in Chinese aid policy to Africa at this date. We exclude year 2014 from the analysis despite data availability given the atypical pattern of Chinese health aid this year following the Ebola crisis in Guinea, Liberia and Sierra Leone3. We concentrate the analysis on the health sector given the call for reinforced health cooperation after 2006. Moreover, health was the first sector of Chinese ODA in terms of number of projects over the 2006-2013 period with 32.5% of all ODA projects4. Focusing the analysis on the health sector allows us to differentiate the analysis by the main types of health projects: the sending of medical teams, the sending of drugs or medical equipment and the construction or rehabilitation of health infrastructures. We investigate the role of three types of factors that might influence the allocation of Chinese health aid: the needs of recipient countries, their merits and the self-interest of China. In a first step we study the number of health projects and the amount of health ODA received by African countries each year. For the number of health projects, the analysis is stratified by types of projects (medical teams/infrastructure and medical equipment or drugs). The number of each type of health projects received is analyzed using Poisson regressions which are appropriate for count data. We then analyze the amount of health ODA received by African countries each year. Again we use Poisson regressions that were shown to outperform OLS and Tobit models in the presence of heteroskedasticity and many zero observations (Silva and Tenreyro, 2006; Silva and Tenreyro, 2011). Given the low time variability of some explanatory variables pooled regressions, rather than fixed effect regressions, are used in order to exploit both inter and intra-country heterogeneity for the identification of factors associated with the allocation of Chinese health aid. In a second step, we study the shares, rather than the absolute values, of Chinese health ODA projects and amount received by each country each year. These regression analyses are run using the fractional probit method developed by Papke and Wooldridge (1996) for the case of proportions as dependent variables.
In total, 345 health aid projects were financed by China in Africa between 2006 and 2013, accounting for a total amount of 2014 US$764 million. On these 345 projects, 143 (41%) correspond to the dispatch of medical teams, 107 (31%) to the sending of medical equipment or drugs and 76 (22%) to health infrastructure construction or rehabilitation. Over the 2006-2013 period, our results show that economic needs, but not direct health needs, of recipient countries were taken into account by China in the allocation of its health ODA. In line with the non-interference principle advocated by China, we also find that governance of recipient
2 This document is a new version of the working paper “Is there a strategy in China’s health official development assistance to
African countries?”, Études et Documents, n° 10, CERDI. The newly released AidData's Global Chinese Official Finance Dataset, 2000-2014, Version 1.0. is used to measure Chinese health ODA to African countries instead of 1.2 version of the AidData database.
3
In 2014, almost half of Chinese health ODA projects to Africa (14/33) were related to Ebola crisis response.
4
The second sector of Chinese ODA to Africa between 2006 and 2013 is education with only 13.6% of total ODA projects over the period.
7
countries did not influence the volume of Chinese health ODA they receive. Using several measures of natural resources endowment of recipient countries, we find no strong evidence that Chinese health aid allocation decisions favored natural resources-rich countries. Looking at the link between trade and aid, results of regression analyses only point to a low magnitude association between the openness rate to China and the volume of Chinese health ODA received. Finally, the allocation of Chinese health aid appeared to be strongly associated with some aspects of its foreign policy as countries that chose to maintain diplomatic relationships with Taiwan were almost entirely excluded from Chinese health aid programs.
2. Data
2.1 Chinese health ODA to African countries
Chinese health ODA is measured using the AidData's Global Chinese Official Finance Dataset, 2000-2014, Version 1.0 (Dreher et al., 2017). This database was created using the TUFF (Tracking Under-Reported Financial Flows) methodology that uses three stages: 1) identification of potential projects through extensive searching involving official sources and media reports; 2) source triangulation to search for and synthesize additional sources for each project identified in the first stage and 3) quality control. The database provides a detailed description of each project that includes the source of funding (official/unofficial), the donor intent (development, commercial, representational or mixed), the flow type (grants, technical assistance, loans, debt relief, export credits, scholarships…), the grant element, the flow class (ODA5, OOF or vague), the date of the project, the recipient country, the sector of the project (Creditor Reporting System code as recorded by OECD), the status of the project (pledged, committed, in implementation, completed, suspended or cancelled) and the value of the associated funding in 2014$.
From this database, we selected Chinese ODA projects in the sector of health. We also included the 4 projects classified in the “Population Policies / Programmes and Reproductive Health” sector as they were all related to HIV/AIDS or contraceptives. We chose to exclude projects that were only pledged or committed and for which no proof of money disbursement is available. Indeed, some projects might have been pledged or committed but not implemented because of a change in the economic or political relations between China and the recipient country. Suspended or cancelled projects were also excluded so that only completed or currently implemented projects are retained in the analysis. For infrastructure projects, several years may run between the project pledge, its start and the end of the project. In that case, we use the year of construction start or the year of money disbursement as the date of the project in the main analysis. If unavailable, the agreement year of the formal signed commitment is used. In total, 345 health aid projects were financed by China in Africa between 2006 and 2013, accounting for a total amount of 2014 US$764 million. On these 345 projects, 143 (41%) correspond to the dispatch of medical teams, 107 (31%) to the sending of medical equipment
5 The classification of flows as ODA is similar to that of OECD. A flow is classified as ODA-like if it 1) is official financing; 2) has a development purpose and 3) is concessional with a grant element of at least 25 percent.
8
or drugs and 76 (22%) to health infrastructure construction or rehabilitation. Table 1 describes the number, the type and the amount of health ODA projects financed by China in Africa over the period 2000-2005 and 2006-2013 periods. In total, 345 health aid projects were financed by China in Africa between 2006 and 2013 against 81 over the 2000-2005 period. As announced by the Chinese authorities, the annual number of health projects financed by China has increased sharply after the 3rd FOCAC in 2006. Indeed, the mean annual number of health aid projects significantly rose from 13.5 over the 2000-2005 period to 43.1 over the 2006-2013 period (t = -9.1102, p < .01). Descriptive statistics also confirm the reinforcement of health cooperation after the 3rd FOCAC as the share of health aid projects in the total of ODA projects increases after 2006 (21.1% over the 2000-2005 period versus 32.5% over the 2006-2013 period). We also notice a change in the composition of health aid projects after 2005. On the 345 health aid projects financed by China between 2006 and 2013, 41.4% correspond to the dispatch of medical teams (versus 66.7% over the 2000-2005 period), 31% to the sending of medical equipment or drugs (versus 18.5%) and 22% to health infrastructure construction or rehabilitation (versus 9.9%). Then, the shares of infrastructure and drugs or medical equipment projects in the total number of health ODA projects increased compared to the 2000-2005 period while the share of medical teams decreased. The total amount of health projects funded by China between 2006 and 2013 is 2014 US$ 764,024,054. Chinese health ODA represents between 0.2 and 11% of DAC countries’ health ODA commitments over the 2006-2013 period6. The mean annual amount of health aid projects significantly increased from US$24.7 million over the 20002005 period to US$95.5 million over the 20062013 period (t = -17.0292, p < .01). This increase can be linked to the promise, made by the Chinese authorities in 2006, to double ODA to African countries.
2000 2001 2002 2003 2004 2005 2000-05 2006 2007 2008 2009 2010 2011 2012 2013 2006-13
Health ODA projects 10 6 13 18 15 19 81 31 39 48 68 44 45 31 39 345
Health ODA projects
(% of ODA projects) 23.3 10.7 26 23.7 18.1 25 21.1 23.1 24.7 38.1 41.7 38.9 33.1 24.6 37.1 32.5 Medical teams
(% of health ODA projects) 90 100 61.5 44.4 66.7 68.4 66.7 38.7 33.3 41.7 23.5 45.5 55.6 54.8 51.3 41.4 Infrastructures
(% of health ODA projects) 10 0 7.69 11.1 13.3 10.5 9.9 9.68 15.4 31.3 44.1 13.6 13.3 9.68 17.9 22.0 Medical equipment & drugs
(% of health ODA projects) 0 0 30.8 22.2 20 21.1 18.5 41.9 46.2 20.8 22.1 38.6 26.7 35.5 28.2 31.0 Health ODA amount
(millions, 2014 US$) 24.2 78.1 23.2 2.6 17.3 2.5 147.9 16.4 12.8 107.5 123.9 145.2 142.1 3.6 212.7 764.0 Health ODA amount
(% of DAC commitments) 3.2 8.3 2.2 0.3 1.8 0.2 2.5 1.2 0.8 6.1 6.5 7.8 7.8 0.2 11.0 5.3
Table 1: Number, type and amount of health projects
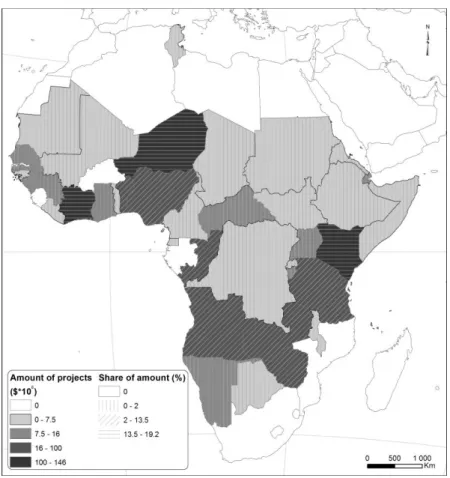
Figure 1 shows the repartition of Chinese health ODA projects over the 2006-2013 period. Between 2006 and 2013 only 9 countries did not benefit from any Chinese health ODA project: Algeria, Burkina Faso, Egypt, Gambia, Libya, Morocco, Sao Tome and Principe, South Africa and Swaziland. Seven countries receive between 1 and 4 projects, 28 countries between 5 and 9 projects, 7 countries between 10 and 14 projects and 3 countries between 15 and 17 projects.
6 DAC countries health aid commitments, rather than disbursements, are used given the high number of missing values for disbursements over the study period.
9
Figure 1: Repartition of Chinese health ODA projects between 2006 and 2013
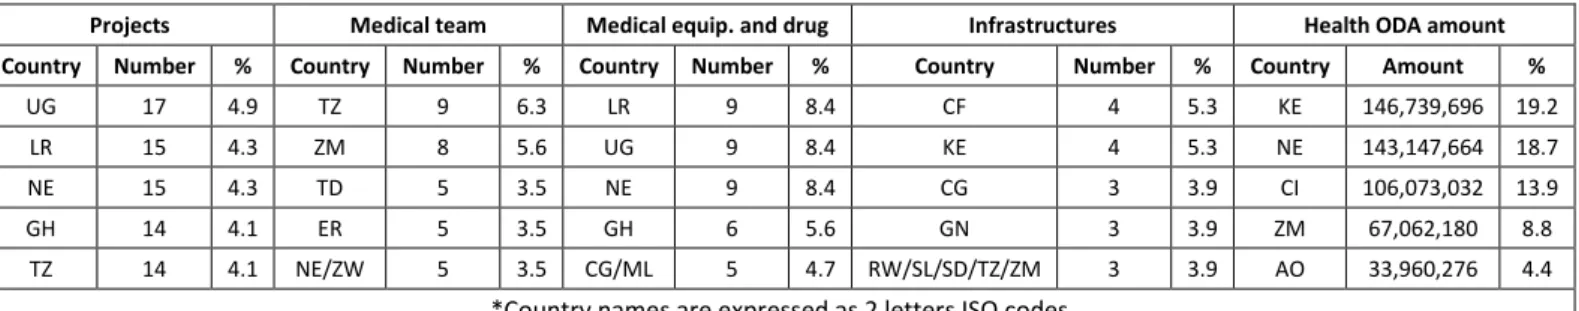
Table 2 presents the ranking of African countries by number of health projects and amount of health ODA received between 2006 and 2013.
Projects Medical team Medical equip. and drug Infrastructures Health ODA amount
Country Number % Country Number % Country Number % Country Number % Country Amount %
UG 17 4.9 TZ 9 6.3 LR 9 8.4 CF 4 5.3 KE 146,739,696 19.2
LR 15 4.3 ZM 8 5.6 UG 9 8.4 KE 4 5.3 NE 143,147,664 18.7
NE 15 4.3 TD 5 3.5 NE 9 8.4 CG 3 3.9 CI 106,073,032 13.9
GH 14 4.1 ER 5 3.5 GH 6 5.6 GN 3 3.9 ZM 67,062,180 8.8
TZ 14 4.1 NE/ZW 5 3.5 CG/ML 5 4.7 RW/SL/SD/TZ/ZM 3 3.9 AO 33,960,276 4.4
*Country names are expressed as 2 letters ISO codes
Table 2: Top 5 recipient countries by project type and amount
Regarding the total number of health projects, the top 5 recipient countries received between 14 and 17 health projects over the 2006-2013 period. Uganda is the country that received the highest number of health projects with 17 projects, which represents 4.9% of the total number of health aid projects financed by China in Africa between 2006 and 2013. For the dispatch of medical teams and the sending of medical equipment or drugs, the top 5 recipient countries received between 5 and 9 medical teams and 5 and 9 projects respectively. Tanzania and
10
Zambia are the countries that benefited from the highest number of Chinese medical teams with 9 and 8 teams respectively. Liberia, Uganda and Niger were the main recipients of medical equipment or drugs projects with a total of 9 projects between 2006 and 2013. Regarding infrastructure projects, the top 5 recipient countries received between 3 and 4 projects over the 2006-2013 period. Central African Republic and Kenya received 4 infrastructure projects while the Republic of Congo, Ghana, Rwanda, Sierra Leone, Tanzania and Zambia benefitted from 3 infrastructure projects.
Figure 2: Repartition of Chinese health ODA amount between 2006 and 2013
Figure 2 shows the repartition of Chinese health ODA amount over the 2006-2013 period. For the 2006-2013 period, Kenya is the country that received the highest amount of health ODA funding with US$147 million (2014 US$). The large amount of health ODA received by Kenya is explained by the receipt of three large infrastructure projects in 2011 and 2013 including a US$ 133 million concessional loan for the construction of the Kenyatta University Teaching, Research and Referral Hospital. Niger, ranks as the second highest recipient country in terms of ODA amount with US$143 million. The large amount of health ODA received by Niger is linked to the receipt of two large infrastructure projects including a US$115 million donation for the construction of the Niger General Referral Hospital in Niamey. Ivory Coast ranks as the third highest recipient countries in terms of amount of health ODA with US$106 million. Ivory Coast received two major infrastructure projects donated by China in 2008 and 2009: the construction of a malaria research center and the construction of a hospital in the town of Gagnoa. These three highest recipient countries concentrated more than half (51.8%) of Chinese health ODA funding between 2006 and 2013. Central African Republic, which was
11
the top beneficiary of infrastructure projects over the 2006-2013 period (with 4 projects), only received around US$10.6 million of Chinese health ODA. This is explained by the fact that financial amounts are missing for 3 out of 4 infrastructure projects the country received. In addition, four countries benefited from non-ODA public health contributions between 2006 and 2013: (in million 2014 US$), Cameroon (42.8), Liberia (18.4), Angola (17.7) and Mali (13.9).
2.2 Explanatory variables
We consider the role of three kinds of variables that might influence the allocation of Chinese health ODA: variables related to the needs and merits of beneficiary countries and variables measuring China's own interest.
For the “need” variables we differentiate between economic and health needs. We use the Gross Domestic Product (GDP) per capita measured in thousands of constant 2011 US$ (World Bank data) to measure economic needs. If China allocates its health ODA based on the economic needs of beneficiary countries, we should find a negative correlation between GDP per capita and health aid. We integrate two measures of health needs in the main analysis: public health expenditures as a percentage of GDP7 (World Bank data) and life expectancy at birth (World Bank data). We expect to find a negative correlation between public health expenditures of recipient countries and Chinese health aid if China favors countries where the ability to finance health projects on national funds is limited. If China allocates its health ODA based on health needs of recipient countries we should also find a negative correlation between Chinese health aid and life expectancy in recipient countries. In robustness checks, we also test for the impacts of under-5 child mortality (per 1000 live births, World Bank data), maternal mortality (per 100,000 live births, World Bank data) and malaria confirmed cases (Global Health Observatory data repository of the World Health Organization), instead of life expectancy, on Chinese heath aid allocation. Finally, we also include population size as a measure of recipient countries’ needs (World Bank data).
To measure recipient countries’ merits we introduce a variable usually used in the literature to reflect the quality of political governance: the control of corruption index (Kaufmann et al., 2011) (World Bank data). The control of corruption index is measured on a scale from -2.5 to 2.5 where a score of 2.5 represents the highest level of corruption control and would therefore be attributed to the least corrupt countries. Previous studies of new donors’ motives have found that these countries disregard merits of recipient countries as measured by their level of corruption control (Dreher et al., 2011). If Beijing truly applies a non-interference principle for the allocation of its ODA, there should be no significant correlation between the control of corruption index and Chinese health ODA. In robustness analysis, we test the impact of an alternative measure of corruption, the corruption perception index (Transparency
7 Introduced in percentage of GDP given the high correlation of public health expenditures in level with GDP per capita
12
International). Still in robustness checks, we use alternative measures of political governance8. The polity score (Marshall and Jaggers, 2016) is used to measure the level of democracy of recipient countries on a scale from -10 (strongly autocratic) to 10 (strongly democratic). Three other indexes of the Worldwide Governance Indicators are also used (Kaufmann et al., 2011): 1) the voice and accountability index that measures the extent to which a country's citizens are able to participate in selecting their government, as well as freedom of expression, freedom of association, and a free media; 2) the regulatory quality index that rates the ability of the government to formulate and implement sound policies and regulations that permit and promote private sector development and 3) the rule of law index that measures the extent to which agents have confidence in and abide by the rules of society (in particular the quality of contract enforcement, property rights, the police, and the courts). These three indexes are measured on a scale from -2.5 to 2.5 where the score of 2.5 represents the best political governance.
Variables related to China's own interest can be classified into two categories, economic and political variables. For economic self-interest we first introduce one measure related to the natural resources endowment of African countries: the natural resources rent9 as percentage of GDP which is the sum of oil rent, natural gas rent, coal rent, forest rent and mineral rent (World Bank data). If China uses its health aid in order to promote its access to natural resources, a positive correlation should be found between the natural resources rent and health ODA from China. In robustness analysis, we also test for the impact of energy (fuels, minerals and metals) exports of African countries to China (measured in millions of US$, WITS database), instead of the natural resources rent, on Chinese health aid allocation. The second economic self-interest variable aims to measure the commercial integration of African countries with China. To that end, we introduce the openness rate of recipient countries to China10 (in % of GDP, WITS and World Bank data) as an explanatory variable. If China uses its health aid to reward or support the opening of domestic markets in African countries, a positive correlation should be found between the openness rate to China and health ODA from China. Given a high number of missing values, the amount of Foreign Direct Investment (FDI) received from China by African countries (millions of US$, UNCTAD FDI/TNC database) is only used as an independent variable in robustness analysis.
Previous studies have found that UNGA voting alignment is determinant in the aid allocation decisions of new donor countries such as Arab countries or India (Neumayer, 2003; Fuchs and Vadlamannati, 2013). Therefore, to measure Chinese political interests we first calculate UNGA voting alignment of recipient countries with China (in percentage) based on data of
8 All measures of governance are not used in the baseline specification given the high collinearity between these measures.
9
Natural resources rents are calculated as the difference between the price of the commodity and the average cost of producing it. Unit rents are then multiplied by the physical quantities countries extract to determine the rents for each commodity as a share of GDP.
10 Exports of China to recipient countries plus exports of recipient countries to China as a percentage of recipent countries’ GDP.
13
Voeten and Merdzanovic (2009). We also include a binary variable for the recognition of Taiwan. A positive correlation between voting alignment with China and health aid and a negative correlation between Taiwan recognition and health aid are expected if China uses its health ODA as part of its diplomatic policy.
Beyond need, merit and self-interest variables, other explanatory variables are also used in the empirical analysis. We insert the amount of health ODA commitments from DAC countries11 (millions of 2015 US$, OECD) as an explanatory variable to test whether Chinese health ODA can be seen as a way of competition with OECD countries in the African continent. We also include the number of ODA projects received from China in various sectors (agriculture, forestry and fishing, communications, action relating to debt, education, emergency response, energy generation and supply, government and civil society, industry, mining and construction, multi-sector, other social infrastructure and services, transport and Storage and water supply and sanitation) as control variables since ODA projects in different sectors can be tied. We are particularly interested in the complementarity or substitutability between Chinese health aid and Chinese ODA in the related sectors of water supply and sanitation and emergency response.
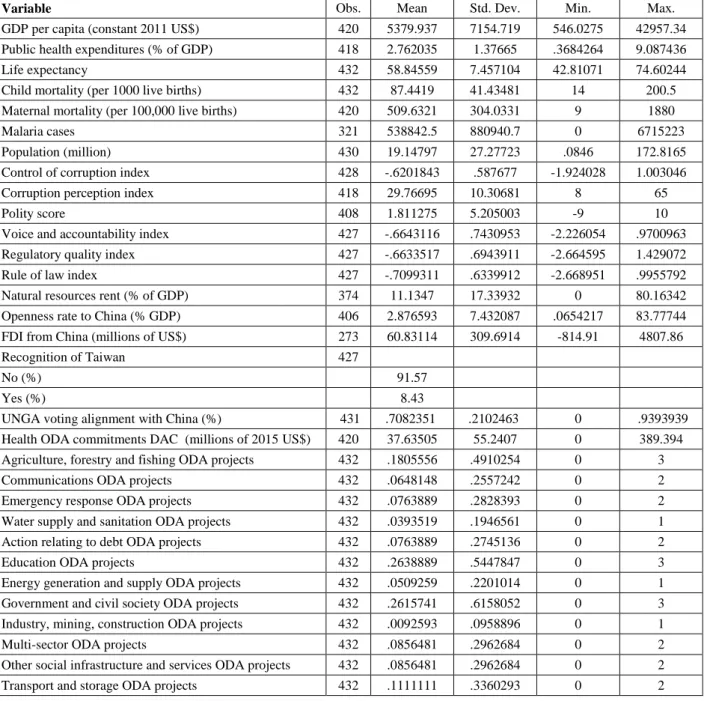
Table 3 displays the descriptive statistics of the explanatory variables. The mean GDP per capita among African countries over the 2006-2013 period is 5380 2011 US$ while mean life expectancy is low and equal to 58.8. In average, African countries spent 2.76% of their GDP for public health expenditures. Mean population in African countries was 19.1 million in the 2006-2013 period. The mean value of the control of corruption index is equal to -0.62 indicating a high level of corruption among African countries over the study period. In average, revenues from natural resources and trade with China represented respectively 11.1% and 2.9% of the GDP of African countries between 2006 and 2013. Few countries chose to maintain political relationship with Taiwan in the 2006-2013 period (8% of country-year observations). Voting alignment of African countries with China is high and equal to 70.8% on average over the study period. Annual health ODA commitments from DAC countries to African countries averaged 38 million of 2015 US$ in the 2006-2013 period.
11
DAC countries health aid commitments, rather than disbursements, are used given the high number of missing values for disbursements over the study period.
14
Variable Obs. Mean Std. Dev. Min. Max.
GDP per capita (constant 2011 US$) 420 5379.937 7154.719 546.0275 42957.34
Public health expenditures (% of GDP) 418 2.762035 1.37665 .3684264 9.087436
Life expectancy 432 58.84559 7.457104 42.81071 74.60244
Child mortality (per 1000 live births) 432 87.4419 41.43481 14 200.5
Maternal mortality (per 100,000 live births) 420 509.6321 304.0331 9 1880
Malaria cases 321 538842.5 880940.7 0 6715223
Population (million) 430 19.14797 27.27723 .0846 172.8165
Control of corruption index 428 -.6201843 .587677 -1.924028 1.003046
Corruption perception index 418 29.76695 10.30681 8 65
Polity score 408 1.811275 5.205003 -9 10
Voice and accountability index 427 -.6643116 .7430953 -2.226054 .9700963
Regulatory quality index 427 -.6633517 .6943911 -2.664595 1.429072
Rule of law index 427 -.7099311 .6339912 -2.668951 .9955792
Natural resources rent (% of GDP) 374 11.1347 17.33932 0 80.16342
Openness rate to China (% GDP) 406 2.876593 7.432087 .0654217 83.77744
FDI from China (millions of US$) 273 60.83114 309.6914 -814.91 4807.86
Recognition of Taiwan 427
No (%) 91.57
Yes (%) 8.43
UNGA voting alignment with China (%) 431 .7082351 .2102463 0 .9393939
Health ODA commitments DAC (millions of 2015 US$) 420 37.63505 55.2407 0 389.394
Agriculture, forestry and fishing ODA projects 432 .1805556 .4910254 0 3
Communications ODA projects 432 .0648148 .2557242 0 2
Emergency response ODA projects 432 .0763889 .2828393 0 2
Water supply and sanitation ODA projects 432 .0393519 .1946561 0 1
Action relating to debt ODA projects 432 .0763889 .2745136 0 2
Education ODA projects 432 .2638889 .5447847 0 3
Energy generation and supply ODA projects 432 .0509259 .2201014 0 1
Government and civil society ODA projects 432 .2615741 .6158052 0 3
Industry, mining, construction ODA projects 432 .0092593 .0958896 0 1
Multi-sector ODA projects 432 .0856481 .2962684 0 2
Other social infrastructure and services ODA projects 432 .0856481 .2962684 0 2
Transport and storage ODA projects 432 .1111111 .3360293 0 2
Table 3: Descriptive statistics of explanatory variables
3. Method
In a first step we study the number of health ODA projects allocated by China to the different African countries. We stratify the analysis by project type and distinguish between medical team dispatches and projects related to the construction of health infrastructures or the sending of medical equipment and drugs. In a second step we study the amount of health ODA received by African countries from China. Over the 2006-2013 period, all medical teams, trainings or technical assistance projects are not financially valued in the AidData database. Therefore, we decided to exclude these projects from the analysis of Chinese health ODA amounts. The analysis for ODA amounts then focuses on grants, infrastructure and medical equipment/drugs projects. However, some infrastructure or equipment and drugs projects also lack data on their
15
financial amount. Then, for each country-year, ODA amounts are coded as missing if data on financial amounts lack for all infrastructure and equipment/drugs projects. If no infrastructure of equipment/drugs project is recorded the ODA amount is reported as 0.
Given the important share of countries that benefit from no Chinese health ODA project or amount each year, simple regression techniques such as OLS cannot be used to estimate the factors associated with Chinese health ODA allocation. Indeed, in the presence of many zero observations, OLS estimates would be biased toward 0 and the effect of independent variables on the number of projects or the amount of health ODA received would be underestimated. To correct this bias, several types of econometric models are available. First, a Two-Part model can be used in order to estimate independently the factors associated with the reception of a positive value of Chinese health ODA and the factors associated with the aid volume among recipient countries. However, such model suffers from the risk of introducing a selection bias in the second step if the selection as a recipient by China is not independent of the volume of Chinese health aid received. The Heckman selection model allows correcting this selection bias at the cost of introducing an exclusion restriction which imposes that at least one independent variable must explain the selection process but not the volume of Chinese health aid received among recipient countries. In practice, this exclusion restriction is hard to satisfy in our analysis as variables which influence whether a country receives aid will probably also impact the volume of aid received. A third solution is then to use a Tobit model which estimates the factors associated with the volume of health aid in one step while correcting for the downward bias introduced by the many 0 observations. In this model, the independent variables are assumed to have the same impact on the fact of receiving a positive value of aid and on the volume of health aid received. Despite its appeal, the Tobit model imposes a homoscedasticity condition on residuals and produces biased estimates in the presence of heteroscedasticity. We choose to use maximum likelihood Poisson regressions in order to study the factors associated with Chinese health ODA projects and amounts by country-year. Poisson regressions are suitable for count data such as the number of projects12. Regarding the use of Poisson regressions for the estimation of health ODA amount received, Silva and Tenreyro (2006 and 2011) have demonstrated that Poisson models outperform Tobit models in the presence of heteroskedasticity and many zero observations. Poisson models are being increasingly used in the trade literature for the estimation of gravity models of bilateral trade (Shepherd, 2010; Fernandes et al., 2016; Anderson et Yotov, 2016). Moreover, recent studies have also used Poisson models to estimate ODA amounts received from DAC countries (Acht et al., 2015). For both project number and project amount we use pooled regression models, rather than fixed effect models, given the low time variability of some explanatory variables (for example the recognition of Taiwan or the control of corruption index). This allow us to exploit both inter and intra-country heterogeneity to analyze the factors associated with Chinese health aid. All regressions were run using robust standard errors clustered at the country level. Except for
12 The regressions for the total number of projects and for infrastructure and medical equipment/drugs projects were also run using negative binomial regressions that specifically correct for overdispersion of the dependent variables. All results are robust to the use of this alternative econometric specification. However, the number of medical teams received could not be estimated using negative binomial regressions for convergence issues.
16
the number of non-health ODA projects from China or heath aid commitment from DAC countries (for which simultaneity with Chinese health ODA is of interest) all explanatory variables are lagged to mitigate concerns of reverse causality. To limit the multicolinearity issue, GDP per capita and public health expenditures as percentage of GDP were centered. The results of multicolinearity diagnostic tests show that multicolinearity is not an issue. Results are reported as incidence rate ratios (IRR) in order to quantify the impact of explanatory variables on the number of health projects and the amount of health ODA received.
All regression analyses were also run using the share of health projects and the share of health ODA amount received by African countries each year. These regression analyses were run using the fractional probit method developed by Papke and Wooldridge (1996) for the case of proportions as dependent variables. Again, all regressions were run using robust standard errors clustered at the country level and all explanatory variables were lagged to mitigate concerns of reverse causality (except for non-health ODA projects received from China and the amount of heath aid commitment of DAC countries).
4. Results
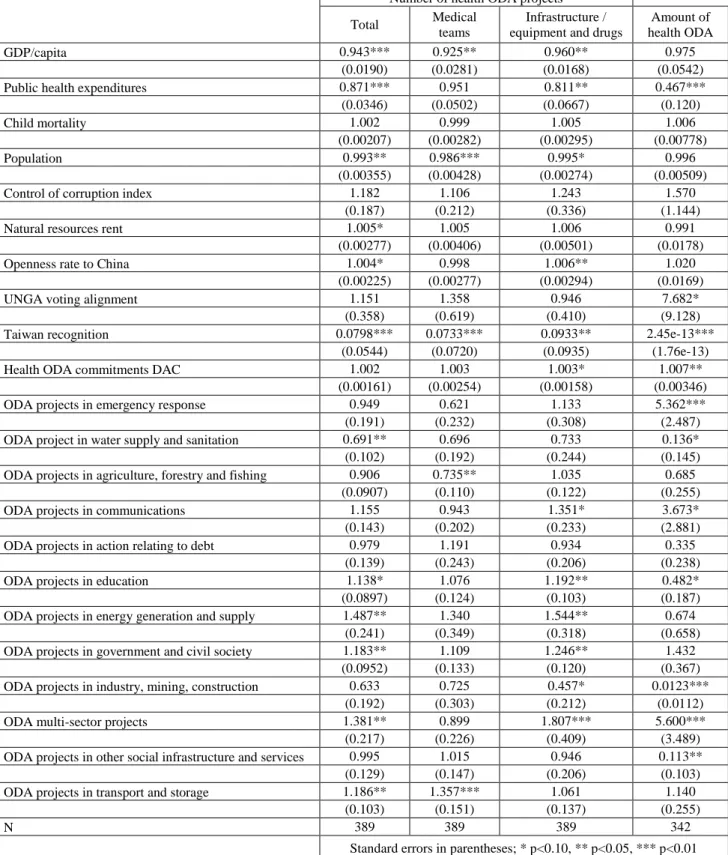
4.1 Number of health projects and ODA amounts
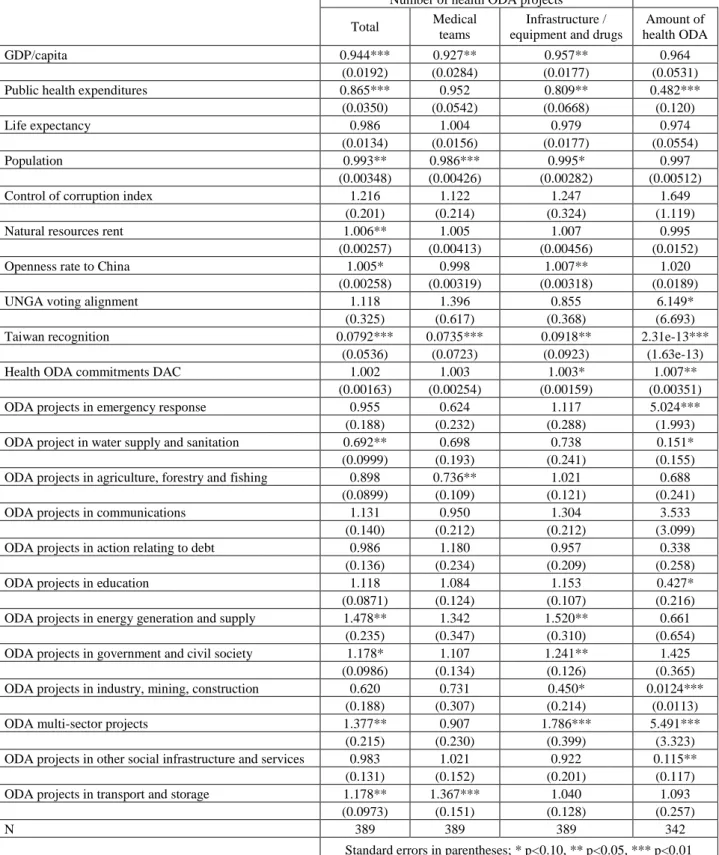
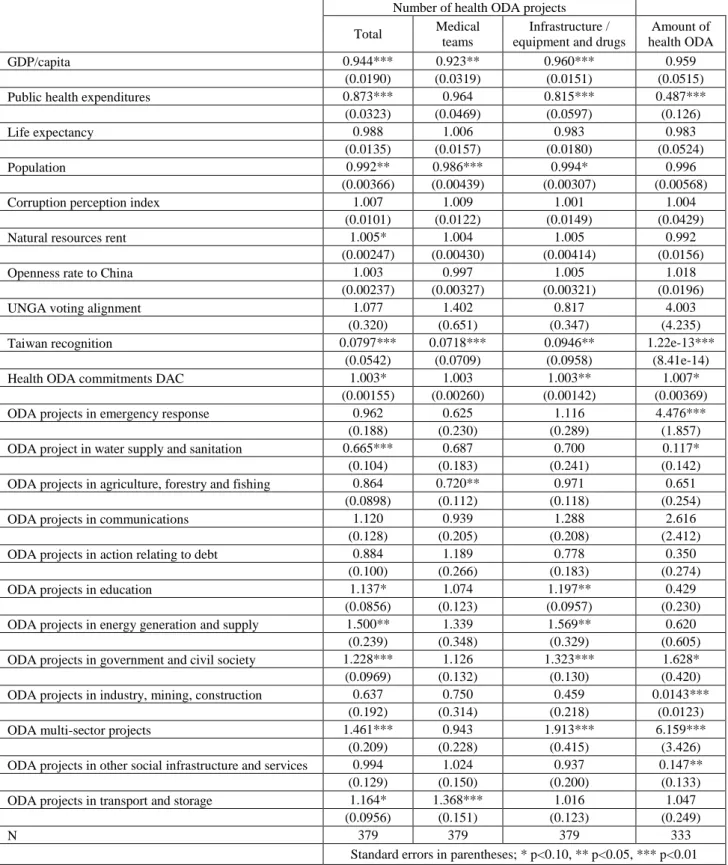
Table 4 presents the results of regression analyses for the number of health projects and the amount of health ODA received from China.
Regarding the economic need variable, the GDP per capita is negatively correlated with the total number of projects received which means that the poorer countries generally tend to benefit from a higher number of projects. A thousand dollar increase in GDP per capita is associated with a 5.6% decrease in the number of health projects received from China over the 2006-2013 period. The GDP per capita is also negatively correlated with the number of medical teams and the number of infrastructure and medical equipment/drugs projects but is not significantly correlated with the amount of health ODA received from China.
17
Number of health ODA projects
Total Medical
teams
Infrastructure / equipment and drugs
Amount of health ODA
GDP/capita 0.944*** 0.927** 0.957** 0.964
(0.0192) (0.0284) (0.0177) (0.0531)
Public health expenditures 0.865*** 0.952 0.809** 0.482***
(0.0350) (0.0542) (0.0668) (0.120)
Life expectancy 0.986 1.004 0.979 0.974
(0.0134) (0.0156) (0.0177) (0.0554)
Population 0.993** 0.986*** 0.995* 0.997
(0.00348) (0.00426) (0.00282) (0.00512)
Control of corruption index 1.216 1.122 1.247 1.649
(0.201) (0.214) (0.324) (1.119)
Natural resources rent 1.006** 1.005 1.007 0.995
(0.00257) (0.00413) (0.00456) (0.0152)
Openness rate to China 1.005* 0.998 1.007** 1.020
(0.00258) (0.00319) (0.00318) (0.0189)
UNGA voting alignment 1.118 1.396 0.855 6.149*
(0.325) (0.617) (0.368) (6.693)
Taiwan recognition 0.0792*** 0.0735*** 0.0918** 2.31e-13***
(0.0536) (0.0723) (0.0923) (1.63e-13)
Health ODA commitments DAC 1.002 1.003 1.003* 1.007**
(0.00163) (0.00254) (0.00159) (0.00351)
ODA projects in emergency response 0.955 0.624 1.117 5.024***
(0.188) (0.232) (0.288) (1.993)
ODA project in water supply and sanitation 0.692** 0.698 0.738 0.151*
(0.0999) (0.193) (0.241) (0.155)
ODA projects in agriculture, forestry and fishing 0.898 0.736** 1.021 0.688
(0.0899) (0.109) (0.121) (0.241)
ODA projects in communications 1.131 0.950 1.304 3.533
(0.140) (0.212) (0.212) (3.099)
ODA projects in action relating to debt 0.986 1.180 0.957 0.338
(0.136) (0.234) (0.209) (0.258)
ODA projects in education 1.118 1.084 1.153 0.427*
(0.0871) (0.124) (0.107) (0.216)
ODA projects in energy generation and supply 1.478** 1.342 1.520** 0.661
(0.235) (0.347) (0.310) (0.654)
ODA projects in government and civil society 1.178* 1.107 1.241** 1.425
(0.0986) (0.134) (0.126) (0.365)
ODA projects in industry, mining, construction 0.620 0.731 0.450* 0.0124***
(0.188) (0.307) (0.214) (0.0113)
ODA multi-sector projects 1.377** 0.907 1.786*** 5.491***
(0.215) (0.230) (0.399) (3.323)
ODA projects in other social infrastructure and services 0.983 1.021 0.922 0.115**
(0.131) (0.152) (0.201) (0.117)
ODA projects in transport and storage 1.178** 1.367*** 1.040 1.093
(0.0973) (0.151) (0.128) (0.257)
N 389 389 389 342
Standard errors in parentheses; * p<0.10, ** p<0.05, *** p<0.01
18
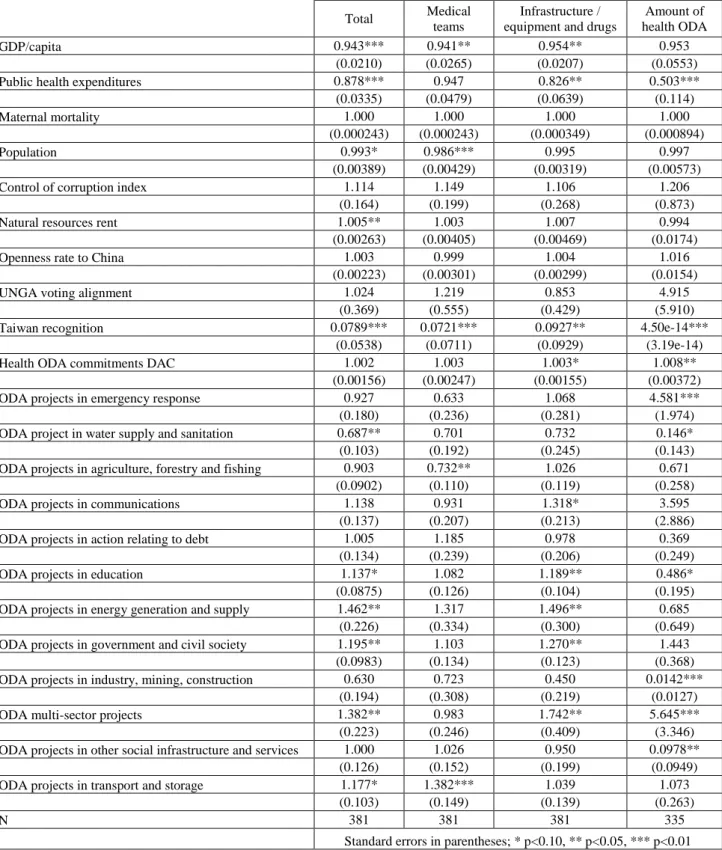
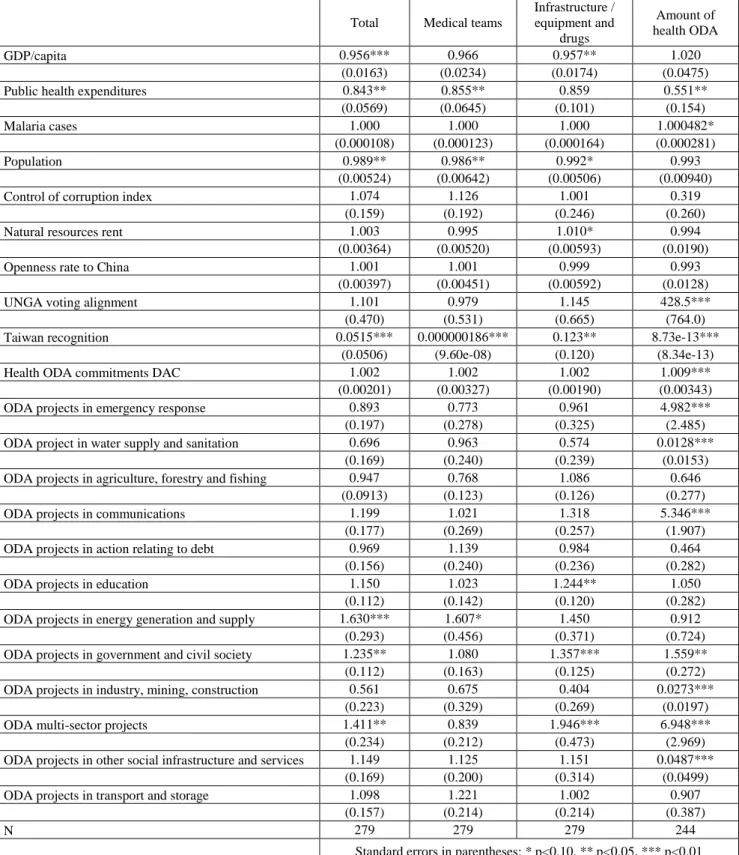
Turning to the health need variables, results of regression analyses show a negative correlation between public health expenditures as a share of GDP in recipient countries and the total number of health projects, the number of infrastructure and medical equipment/drugs projects and the amount of health ODA received from China but not the number of medical. Over the 2006-2013 period, a one percentage point increase in public health expenditures (as a share of GDP) in recipient countries is associated with decreases of 13.5% and 19.1% in the total number of projects and the number of infrastructure and medical equipment/drugs projects financed by China respectively. This effect is even stronger for the amount of health ODA received since a one percentage point increase in public health expenditures is associated with a 51.8% decrease in the amount of health ODA received from China. Life expectancy is not significantly correlated with either measure of Chinese health ODA received between 2006 and 2013. As robustness checks we also test whether child mortality, maternal mortality and the number of malaria cases are associated with Chinese health aid allocation. To do so, we consecutively replace life expectancy by one of these three variables in the regression analysis (results shown in Tables A1 to A3 in Appendix A). We find again no association between child mortality or maternal mortality and either measure of Chinese health ODA. For malaria prevalence, we find no significant correlation between the number of malaria cases and the number of Chinese health ODA projects received, whatever the type. However, we find a positive correlation between malaria cases and the amount of Chinese health ODA received, through only significant at the 10 percent level. A one thousand increase in the number of malaria cases is associated with a 0.0482% increase in the amount of Chinese health ODA received.
Regarding the merit variables, China does not appear to disfavor more corrupt countries over the 2006-2013 period. Indeed, no significant correlations are found between the control of corruption index in African countries and neither measure of health ODA from China. This result is confirmed in robustness analysis where we use the corruption perception index as an alternative measure of corruption in recipient countries (results shown in Table B1 in Appendix B). Regarding other measures of governance, we find no significant association between the voice and accountability, regulatory quality and rule of law indexes and the volume of health ODA received from China (results shown in Table B2 and B4 in Appendix B). For the polity score, which measures level of democracy of recipient countries, we again find no significant correlation with any measure of Chinese health ODA (results shown in Table B5 in Appendix B).
For the economic interest variables, the openness rate to China is positively correlated with the total number of projects received and the number of infrastructure and medical equipment/drugs projects. However, the magnitude of these correlations appears low. Over the 2006-2013 period, a one percentage point increase in the openness rate to China is only associated with a 0.5% increase in the number of health projects received and a 0.7% increase in the receipt of infrastructure and medical equipment/drugs projects. In robustness analysis, we find no significant correlations between the amount of FDI received from China and the volume of Chinese health ODA (results shown in Table C1 Appendix C). We find no strong evidence that China favors countries with high endowments of natural resources in its health
19
aid allocation. Indeed, results of regression analyses only show a significant positive correlation between the natural resources rent and the total number of Chinese health ODA projects. This correlation is of low magnitude as a one percentage point increase in the natural resources rent is only associated with a 0.6% increase in the number of Chinese health ODA projects received. We find no significant correlation between the natural resources rent and the three other measures of Chinese health ODA. This result is confirmed in robustness analysis by the use of energy exports of African countries to China as an alternative measure of natural resources endowment (results shown in Table C2 in Appendix C). We find no significant correlation between energy exports of recipient countries to China and the number of Chinese health ODA projects of either type received. We only find a positive and of very low magnitude correlation between energy exports to China and the amount of health ODA received (a one million US$ increase in energy exports to China is associated with a 0.0093% increase in the amount of health ODA received from China).
Some political considerations appear to play an important role in Chinese health aid allocation decisions. Over the 2006-2013 period, the recognition of Taiwan by an African country almost systematically excludes it from Chinese health aid programs. This result is coherent with 2006 Beijing Declaration of the third FOCAC that called for an African commitment to the “one-China” policy. We find no evidence that countries who adopted UNGA voting patterns similar to China were favored by China for the receipt of health aid projects between 2006 and 2013. However, we find a strong, significant and positive correlation between voting alignment with China and the amount of Chinese health ODA received.
The allocation of Chinese health aid in African countries appears related to health aid provided by traditional bilateral donors only for infrastructure and drugs or medical equipment projects. Indeed, we find no significant correlations between health ODA commitments of DAC donors and the total number of Chinese health aid projects or the number of medical teams while results show positive and significant correlations between health ODA commitments of DAC donors and the number of infrastructure and drugs or equipment projects as well as the amount of Chinese health ODA (mainly calculated on infrastructure and drugs or equipment projects). A one million 2015 US$ increase in health ODA commitments received from DAC countries is associated with 0.3 and 0.7% increases in the number of infrastructure and drugs or equipment projects and Chinese health ODA amount respectively over the study period.
The empirical analysis also highlights the complementarity of Chinese health ODA with ODA in the sector of emergency response and the substitutability of Chinese health ODA with ODA in the sector of water supply and sanitation. Indeed, the number of emergency response ODA projects is positively correlated with the amount of Chinese health ODA received while the number of water supply and sanitation ODA projects is negatively correlated with both the number of health ODA projects and the amount of health ODA.
20
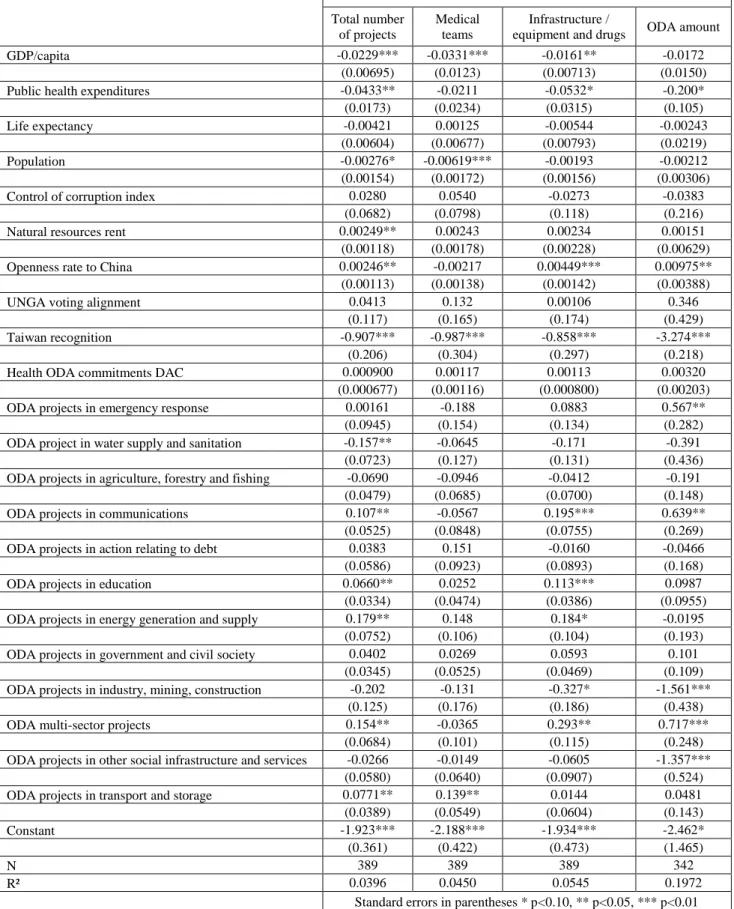
4.2 Testing robustness of the results: Share of Chinese health aid
Table 5 presents the results of the regression analyses for the share of health projects and the share of health ODA amount received by African countries from China. Results for economic needs, health needs and merits of African countries and China’s political and economic interests are very similar to those obtained when studying the number of health projects and the amount of health ODA. Results similarity for these variables tends to indicate that factors associated with Chinese aid allocation are the same than those associated with Chinese trade-off of aid allocation between the recipient countries.
Regarding the economic and health need variables, all results are similar to those obtained in the previous analysis. GDP per capita is negatively correlated with the shares of total health projects, medical teams and infrastructure and medical equipment or drugs projects. Public health expenditures as a share of GDP are negatively correlated with the shares of total health projects, medical teams and health ODA amounts. Again, we find no significant correlation between life expectancy and the shares of either type of projects received or the share of health ODA amount received. Regarding the size of the population, all results are similar to those obtained in the previous analysis except for one exception. When looking at the absolute volume of Chinese health aid received we found negative correlations between the size of the population and all measures of Chinese health ODA projects while we only find here negative correlations between the population size and the shares of total health ODA projects and medical teams (but not the share of infrastructure and medical equipment or drugs projects). Turning to the merit variable, we find again no link between the control of corruption index and the receipt of Chinese health ODA either in terms of projects or in terms of amount. Indeed, we find no significant correlation between the control of corruption index and the shares of Chinese health aid received over the study period.
Regarding the economic interest variables, results for the openness rate are very similar to those of previous regression analyses. The openness rate to China is positively correlated with the share of health projects and the share of infrastructure and medical equipment/drugs projects. Once again, these correlations are of very low magnitude. The only difference with the previous analysis is that the openness rate is now also positively and significantly correlated with the share of health ODA amount received while it was not significantly correlated with the amount of health ODA. These new specifications also confirm that resources endowment of African countries do not play a major role in Chinese health aid allocation. Indeed, once again we only find a low magnitude correlation between the natural resources rent and the share of health ODA projects received.
21
Share of Chinese health ODA
Total number of projects
Medical teams
Infrastructure /
equipment and drugs ODA amount
GDP/capita -0.0229*** -0.0331*** -0.0161** -0.0172
(0.00695) (0.0123) (0.00713) (0.0150)
Public health expenditures -0.0433** -0.0211 -0.0532* -0.200*
(0.0173) (0.0234) (0.0315) (0.105)
Life expectancy -0.00421 0.00125 -0.00544 -0.00243
(0.00604) (0.00677) (0.00793) (0.0219)
Population -0.00276* -0.00619*** -0.00193 -0.00212
(0.00154) (0.00172) (0.00156) (0.00306)
Control of corruption index 0.0280 0.0540 -0.0273 -0.0383
(0.0682) (0.0798) (0.118) (0.216)
Natural resources rent 0.00249** 0.00243 0.00234 0.00151
(0.00118) (0.00178) (0.00228) (0.00629)
Openness rate to China 0.00246** -0.00217 0.00449*** 0.00975**
(0.00113) (0.00138) (0.00142) (0.00388)
UNGA voting alignment 0.0413 0.132 0.00106 0.346
(0.117) (0.165) (0.174) (0.429)
Taiwan recognition -0.907*** -0.987*** -0.858*** -3.274***
(0.206) (0.304) (0.297) (0.218)
Health ODA commitments DAC 0.000900 0.00117 0.00113 0.00320
(0.000677) (0.00116) (0.000800) (0.00203)
ODA projects in emergency response 0.00161 -0.188 0.0883 0.567**
(0.0945) (0.154) (0.134) (0.282)
ODA project in water supply and sanitation -0.157** -0.0645 -0.171 -0.391
(0.0723) (0.127) (0.131) (0.436)
ODA projects in agriculture, forestry and fishing -0.0690 -0.0946 -0.0412 -0.191
(0.0479) (0.0685) (0.0700) (0.148)
ODA projects in communications 0.107** -0.0567 0.195*** 0.639**
(0.0525) (0.0848) (0.0755) (0.269)
ODA projects in action relating to debt 0.0383 0.151 -0.0160 -0.0466
(0.0586) (0.0923) (0.0893) (0.168)
ODA projects in education 0.0660** 0.0252 0.113*** 0.0987
(0.0334) (0.0474) (0.0386) (0.0955)
ODA projects in energy generation and supply 0.179** 0.148 0.184* -0.0195
(0.0752) (0.106) (0.104) (0.193)
ODA projects in government and civil society 0.0402 0.0269 0.0593 0.101
(0.0345) (0.0525) (0.0469) (0.109)
ODA projects in industry, mining, construction -0.202 -0.131 -0.327* -1.561***
(0.125) (0.176) (0.186) (0.438)
ODA multi-sector projects 0.154** -0.0365 0.293** 0.717***
(0.0684) (0.101) (0.115) (0.248)
ODA projects in other social infrastructure and services -0.0266 -0.0149 -0.0605 -1.357***
(0.0580) (0.0640) (0.0907) (0.524)
ODA projects in transport and storage 0.0771** 0.139** 0.0144 0.0481
(0.0389) (0.0549) (0.0604) (0.143)
Constant -1.923*** -2.188*** -1.934*** -2.462*
(0.361) (0.422) (0.473) (1.465)
N 389 389 389 342
R² 0.0396 0.0450 0.0545 0.1972
Standard errors in parentheses * p<0.10, ** p<0.05, *** p<0.01
22
We find no difference in the effects of Taiwan recognition between our first analysis and the analysis of the share of health aid received. Taiwan recognition is associated with a strong reduction in the share of health aid projects and the share of health ODA amount received by African countries over the study period. Results show no significant correlations between UNGA voting alignment of African countries with China and neither measure of the share of Chinese health ODA while we previously found a positive correlation between UNGA voting alignment and the amount of health ODA received.
Regarding the relationship between health aid of China and DAC countries, we find no significant relationship between health ODA from DAC countries in African countries and the share of Chinese health ODA they receive. This contradicts our previous results that showed a positive correlation between the receipt of Chinese infrastructure and medical equipment or drugs projects and the amount of health ODA received from DAC countries. These new specifications also confirm the complementarity between emergency response ODA and health ODA from China and the substitutability between water supply and sanitation ODA and health ODA from China.
5. Discussion
Our analysis shows that need, merit and self-interest variables influence Chinese health aid allocation in different ways depending on the type of health projects analyzed over the 2006-2013 period. But several general patterns of the Chinese aid allocation can be drawn from our results.
Needs. Globally, China allocated more health aid to poorer countries over the study period.
Chinese health aid was also directed to African countries with higher health needs as measured by the share of GDP that is devoted to public health expenditures, health currently being (and likely being for the coming years), drastically underfinanced (Dieleman et al, 2016). This indicates that Chinese health aid favored countries where the ability to finance health projects on national funds was limited. However, over the study period, Chinese health ODA was not responsive to more direct measures of health needs in African countries such as life expectancy, child and maternal mortality or malaria prevalence. These results are coherent with those of Dreher and Fuchs (2015) who find that the sending of Chinese medical teams to all recipient countries over the 1990-1995 period is negatively correlated with their GDP per capita but does not react to their health needs as measured by the total number of people affected by a natural disaster. Dreher et al. (2017) also find that GDP per capita in African countries is negatively correlated with the total amount of ODA they receive from China. Our results confirm this pattern in the health sector for all types of health projects but not for the amount of health ODA received.
As highlighted for ODA allocation decisions of traditional donors (Alesina and Dollar, 2000; Berthélemy and Tichit, 2004; Dollar and Levin, 2006; Younas, 2008) and new donors such as
23
India (Fuchs and Vadlamannati, 2013), the allocation of Chinese health aid is also less favorable to comparatively more populated countries13.
Merits. Our results show that in the allocation of its health aid over the 2006-2013 period
China did not disfavor countries where the corruption was higher. This result is robust to the use of two different measures of corruption, the control of corruption index and the corruption perception index. This result is likely to reflect the non-interference principle that Beijing states to apply in its foreign policy relationships. It is in line with the broader aid allocation literature which has shown that corruption in recipient countries does not impact aid allocation decisions of traditional or new donors (Clist, 2011; Nunnenkamp and Thiele, 2013, Lee and Lim, 2014). In robustness analysis, we used alternative measures of governance (voice and accountability, regulatory quality and rule of law indexes as well as polity score) and find again no association between these governance indicators and the volume of Chinese health ODA received. Our results are also coherent with those of Dreher et al. (2017) who find no correlation between the polity score/the control of corruption index and the total amount of ODA received by African countries over the 2000-2013 period. However, they differ to previous results of Dreher and Fuchs (2015) who find that the sending of Chinese medical teams to all recipient countries was negatively correlated with a dummy variable for democracy over the 1990-1995 period.
Chinese interests. We find no strong evidence that Chinese health aid allocation decisions
favored African countries with high level of natural resources over the 2006-2013 period. Indeed, we only find a low magnitude correlation between the natural resources rent of African countries and the total number of health aid projects they received. This correlation loses statistical significance when disaggregating the analysis by type of projects or when looking at the amount of health ODA received. This result is coherent with those of Dreher and Fuchs (2015) who only find a low magnitude correlation between oil production of African countries and the dispatch of medical teams over the 1990-1995 period. Dreher et al. (2017) also find that the total amount of Chinese ODA to African countries is independent of oil production in recipient countries over the 2000-20013 period. Our results confirm that general natural resources in African countries do not influence Chinese aid allocation in the specific health sector. Still for economic interests, the volume of trade with China appears to be associated with a favorable allocation of Chinese health aid over the 2006-2013 period. Indeed, we find positive and significant correlations - though of low magnitude - between the openness rate and the total number of projects received and the number of infrastructure/medical equipment or drugs projects. While Dreher et al. (2017) find no evidence of a link between commercial ties to China and the total amount of ODA received by African countries over the 2000-2013 period, we show the existence of such a link for health aid in terms of number of health aid projects allocated. In robustness analysis we also find that Chinese health aid allocation is not significantly associated with the level of FDI recipient countries received from China.
The allocation of Chinese health aid appears to be strongly linked to some aspects of its foreign policy. African countries which chose to recognize Taiwan were almost entirely excluded from Chinese health aid programs between 2006 and 2013. These results confirm those found by
13
As is the case for the literature on ODA in general which highlights a bias against highly-populated countries that receive less ODA (bilateral and multilateral) per capita than others.