HAL Id: hal-01254527
https://hal.uca.fr/hal-01254527
Submitted on 12 Jan 2016
HAL is a multi-disciplinary open access archive for the deposit and dissemination of sci-entific research documents, whether they are pub-lished or not. The documents may come from teaching and research institutions in France or abroad, or from public or private research centers.
L’archive ouverte pluridisciplinaire HAL, est destinée au dépôt et à la diffusion de documents scientifiques de niveau recherche, publiés ou non, émanant des établissements d’enseignement et de recherche français ou étrangers, des laboratoires publics ou privés.
Discrete modeling of penetration tests in constant
velocity and impact conditions
Quoc Anh Tran, Bastien Chevalier, Pierre Breul
To cite this version:
Quoc Anh Tran, Bastien Chevalier, Pierre Breul. Discrete modeling of penetration tests in con-stant velocity and impact conditions. Computers and Geotechnics, Elsevier, 2016, 71, pp.12-18. �10.1016/j.compgeo.2015.08.010�. �hal-01254527�
Discrete modeling of penetration tests in constant
1
velocity and impact conditions
2
Quoc Anh Tran, Bastien Chevalier and Pierre Breul 3
Correspondence to [email protected] 4
Clermont Université, Université Blaise Pascal, Institut Pascal, BP 10448, F-63000 Clermont-5
Ferrand, France. 6
CNRS, UMR 6602, Institut Pascal, F-63171 Aubière, France. 7 Tel. +33(0)4.73.40.75.23 8 Fax. +33(0)4.73.40.74.94 9
Abstract
10The paper presents investigations on the penetration tests in granular material. A discrete 11
numerical study is proposed for the modeling of penetration tests in constant velocity 12
conditions and also in impact conditions. The model reproduces qualitatively the mechanical 13
response of samples of granular material, compared to classical experimental results. 14
Penetration tests are conducted at constant velocity and from impact, with similar penetration 15
rates ranging from 25 mm.s-1 to 5000 mm.s-1. In constant velocity condition, the value of tip 16
force remains steady as long as the penetration velocity induces a quasi–static regime in the 17
granular material. However, the tip force increases rapidly in the dense flow regime 18
corresponding to higher penetration rate. Impact tip force increases with the impact velocity. 19
Finally, the tip forces obtained from impact penetration tests are smaller compared to the one 20
obtained in constant velocity conditions in both quasi–static and dense flow regimes. 21
Keywords: DEM, Penetration test, Tip force, Penetration rate 22
Computers and Geotechnics 71 (2016) 12–18
23 http://dx.doi.org/10.1016/j.compgeo.2015.08.010 24 Article history: 25 Received 13 February 2015 26
Received in revised form 18 August 2015
27
Accepted 31 August 2015
28 29
30
1. Introduction
31
In the field of in situ mechanical characterization of soils, penetration tests are commonly 32
used. The tip resistances, deduced from pile driving theory, can be measured either in 33
dynamic (qd) (Fig.1) or in static conditions (qc).
34
Recently, the measurement technique in impact conditions was improved. It is now possible 35
to record the real–time response of the soil during one impact in terms of tip force and 36
penetration distance [1,2] (Fig.2). Mechanical properties other than the classical tip resistance 37
might be extracted from this new kind of experimental measurements. Recent studies from [3] 38
and [4] showed the interest in penetration tests for the characterization of coarse material. 39
Penetration tests generate large deformations and a highly non-homogeneous solicitation, 40
Discrete Element Method (DEM) is then a particularly relevant numerical method to model 41
this test. Many authors proposed numerical models for reproducing penetration tests in static 42
conditions i.e. in constant velocity conditions in 2D [5,6,7,8,9,10] and in 3D [1,4,11,12]. 43
However, [1,13,14] showed that tip resistance depends on the loading type used in the 44
penetration process. Very few researches focus to the modeling of penetration tests in impact 45
conditions. 46
Figure 1. Example of an experimental result of a impact penetration test.
Figure 2. Example of experimental load–penetration curve obtained in a impact penetration test for one impact [2].
In this paper, we propose a numerical model of penetration tests using DEM for reproducing 47
tests in both constant velocity and impact conditions in coarse materials. The penetration 48
device modeled here is a light penetrometer [3,4]. Macroscopic results are discussed in this 49
paper. After the description of the numerical model, we present the effect of penetration rate 50
on the tip force obtained from both constant velocity and impact penetration tests will. 51
Finally, a comparison of the tip force obtained with both loading types is proposed and 52
discussed. 53
2. Numerical Model
54
Discrete Element Method in two dimensions was used with Itasca’s software PFC2D [15]. 55
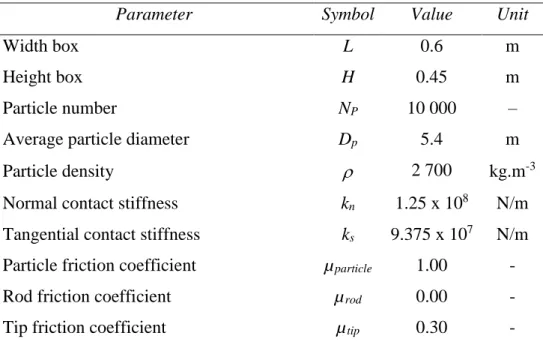
Table 1 summarize the parameter of the model. Granular material samples of 10 000 56
cylindrical particles were generated and tested in a rectangular box (Table 1). A diameter ratio 57
of 2 was chosen between largest and smallest particles. The average particle diameter of the 58
material Dp is equal to 5.4 mm (Fig.3).
59
60
Figure 3. Particle size distribution of the granular material.
61
The sample preparation broke down into 3 steps. First, a frictionless particle radius expansion 62
method without gravity was used in order to reach a minimum value of sample porosity of 63
n = 0.15. Secondly, the final value of friction coefficient of µparticle = 1.00 was applied as well
64
as the gravity. We conducted simulations with different values of particle friction and found 65
no influence of particle friction on the results for values of µparticle 0.50. So the value of
66
µparticle = 1.00 was chosen. The sample was then stabilized until equilibrium state was reached.
At the end of this step, the internal stress state at center of the sample was calculated. The 68
ratio between horizontal and vertical stresses was found equal to 0.5, which is close to 69
classical “at rest” earth pressure ratio K0. This ratio was also calculated from the stresses
70
measured on sample boundaries. Finally, the sample was confined vertically on its top 71
surface. 72
Usually in homogeneous soils, tip resistance first increases with depth until a critical depth is 73
reached and then tip resistance becomes steady (Fig.1). The confining stress, equal to 40 kPa 74
simulates an overlaying layer of material; it prevented the effects of free surface to be 75
observed [14]. A linear contact model was used and the contact stiffness was chosen in order 76
to assess the assumption of rigid particles during penetration tests [16,17]. A Coulomb 77
friction criterion of coefficient µparticle = 1.00 was used to limit the value of tangential force
78
relatively to normal force. No viscous damping was considered in the contact model and no 79
local damping was used in the model [18]. Thus, energy is only dissipated by friction during 80
the penetration tests. 81
Parameter Symbol Value Unit
Width box L 0.6 m
Height box H 0.45 m
Particle number NP 10 000 –
Average particle diameter Dp 5.4 m
Particle density 2 700 kg.m-3 Normal contact stiffness kn 1.25 x 10⁸ N/m
Tangential contact stiffness ks 9.375 x 10⁷ N/m
Particle friction coefficient µparticle 1.00 -
Rod friction coefficient µrod 0.00 -
Tip friction coefficient µtip 0.30 -
Table 1. A summary table with all DEM parameters used in penetration tests.
82
Penetration tests were conducted on three different samples generated with the same 83
conditions of density and particle grading but different initial particle arrangement. The 84
penetration was performed with a frictionless rod of width 14 mm linked to a tip of 16 mm 85
width at its bottom edge and presenting a friction coefficient µtip of 0.3 [2,3,4] (Fig.4). In
86
constant velocity conditions, called hereafter constant velocity conditions test, the rod is 87
driven in the sample with a constant rod velocity up to 0.30 m of depth. The vertical 88
component of the force applied by the granular material on the tip is called tip force Fc for
89
penetration test conducted in constant velocity condition. 90
For tests conducted in impact conditions, the rod is first driven with constant velocity until a 91
depth of 0.15 m is reached. The rod is then released and stabilized under its own weight. 92
Then, series of five successive impacts are produced in each sample with an additional 93
cylinder on the top of the rod (Fig.4). The mass of the impacting cylinder is equal to the rod 94
mass. The vertical component of the force applied by the granular material on the tip is called 95
tip force Fd in impact condition tests. Equilibrium state is reached after each blow and before
96
applying the next blow. 97
The equilibrium state used in the simulations is a classical equilibrium state condition. Once 98
one of the two ratio values defined hereafter decreases below a given value, the system is 99
considered in mechanical equilibrium. The first ratio is given by the ratio of average 100
unbalanced force magnitude of particles to average magnitude of normal contact force. The 101
second ratio is given by the ratio of the magnitude of the greatest unbalanced force on 102
particles to the magnitude of the greatest normal contact force. 103
104
Figure 4. Tip details and sample of granular material tested.
105
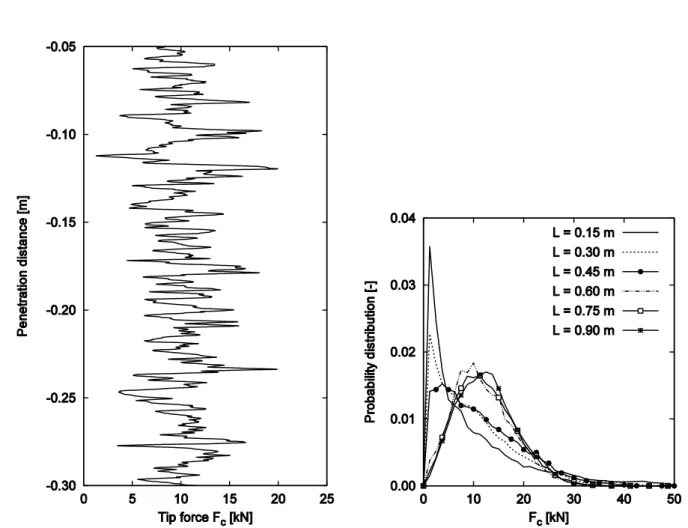
Figure 5 shows the tip force Fc versus the depth in a given sample of 0.60 m width for depth
106
between 0.15 m and 0.30 m, obtained with a rod velocity of 25 mm.s-1. Despite some 107
oscillations, due to coarse nature of the material, it is found that Fc is relatively steady in
average as the depth increases and is keeping with an experimental constant velocity 109
penetration test. The upper confining stress cancelled the effect of the free surface. 110
In order to highlight the effect of sample width on the test results, constant velocity 111
penetration tests were conducted in boxes of different width ranging from 0.15 m to 0.90 m. 112
The penetration rate used is equal to 1250 mm.s-1, which represents an average value of 113
penetration rates used in this study (constant velocity and impact conditions). Figure 6 shows 114
the probability distribution of Fc obtained for samples width varying between 0.15 m and
115
0.90 m. As the box width increases, we observe that the probability distribution of the values 116
of Fc becomes stable when the width is greater than 0.60 m.
117
Figure 5. Tip force Fc versus penetration distance
obtained at 25 mm.s-1 of rod velocity in the sample of
0.6 m width.
Figure 6. Probability distribution of tip force Fc
between 0.05 and 0.30 m of penetration distance at 1250 mm.s-1 of rod velocity for different samples
3. Effect of penetration rate on the tip force in constant
118
velocity penetration test
119
In this section, we focus on the influence of the driving velocity on the tip force Fc for
120
constant velocity penetration tests. The penetration rates range from a low value of, 25 mm.s-1 121
corresponding to penetration rate prescribed in the standards for constant velocity penetration 122
test to a fast penetration rate corresponding to the order of magnitude of impact velocity used 123
in impact conditions 5000 mm.s-1 as described in [1,2]. 124
Figure 7 shows the probability distributions of all values of tip force Fc measured between
125
0.05 m and 0.30 m of penetration depth obtained for three samples with different penetration 126
rates [19]. Probability distributions of tip force Fc complies with the normal law when
127
penetration rate is lower than 1250 mm.s-1. The dispersion of Fc increases when rod velocity
128
is higher than 1250 mm.s -1. 129
Figure 7. Probability distribution of tip force Fc
between 0.05 and 0.30 m of penetration distance for three samples with different rod velocities [19].
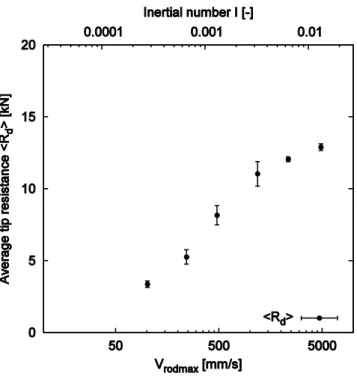
Figure 8. Average tip resistance <Rc> versus rod
velocity (height of vertical bars represent twice the standard deviation of Rc).
The non-dimensional inertial number I can be used to quantify dynamic effects in both 130
experimental tests and numerical modeling [17]. Inertial number is given by 131
(1)
with the shearing rate of the particle assembly during penetration testing, m the average 132
particle mass and P the confinement stress. It can be used to differentiate the regimes of 133
solicitation: from quasi–static state with I < 10-3 to inertial state with I > 10-3 [17]. It is
134
difficult to determine the shearing rate for penetration tests since the deformation applied to 135
the material is highly non-homogeneous. In order to get an order of magnitude of the inertial 136
number, the deformation rate is calculated by the formula being proposed based on Vrod the
137
rod velocity; H the sample height: 138
(2)
The inertial number I defined by Eq.1 & 2 increases from 6.8010-5 to 1.3610-2 according to 139
the penetration rate (from 25 mm.s-1 up to 5000 mm.s-1). 140
The tip resistance Rc is defined here as the average of Fc obtained between 0.05 and 0.30 m of
141
penetration distance in a given sample. The average tip resistance <Rc> obtained on three
142
different samples is calculated. 143
It can be observed on Fig.8 that <Rc> remains constant when the rod velocity is lower than
144
1250 mm.s-1. Then, <Rc> increases increases rapidly for penetration rate upper than
145
1250 mm.s-1 corresponding to an inertial number I (in the order of 3.4010-3). It can also be
146
noticed on Fig.7 that the dispersion of tip force Fc also increases with rod velocity.
147
The same trend was described in [4]. In this paper, tip resistance qc is steady for low value of
148
penetration rates and then increases as penetration rate increases. In both studies, the change 149
of regime occurs for different values of the rod velocity, because this value probably depends 150
on particle size distribution, tip size, confining stress P (as show in Eq.1&2) and possibly 151
additional parameters. 152
4. Effect of penetration rate on the tip force in impact
153
penetration test
154
For impact penetration tests, impacts are generated on the top of the driving rod and the tip 155
force Fd is measured as well as the penetration distance.
156
The effect of impact energy is significant in impact penetration tests. The impact test were 157
compared in terms of maximal rod velocity and not in terms of impact velocity. In order to 158
show that rod maximal velocity is dependent on impact energy, impact tests were conducted 159
with same impact energy but with changing impact mass and impact velocities The ratio 160
between impact mass and rod mass () for successively taken equal to 0.5, 1.0 and 2.0. Figure 161
9 presents the three curves of versus penetration distance obtained. First, the magnitude of Fd
162
is similar for 3 cases. Furthermore, the same maximum rod velocity Vrodmax 1210 mm.s-1 is
163
obtained in the different cases corresponding to different ratios (Fig.10). 164
Secondly, the response obtained with the model is similar to the one classically obtained 165
experimentally (Figure 2), it breaks down into three phases (Fig.9,10): 166
a quick loading phase corresponding to the initial increase of the rod velocity. In this 167
phase, whatever is the blow, the signal shape is similar. The duration of this phase is 168
the same as the duration of the impact (timpact 2.2 ms). The first point (1)
169
corresponds to the time when the rod velocity reaches its maximum velocity. 170
a plastic phase corresponding to the penetration process of the rod in the soil. In this 171
phase, the signal shows oscillations depending on the arrangement of the granular 172
material. The second point (2) corresponds to a moment in this phase when the rod 173
velocity decreases. The point (3) corresponds to the moment when the penetration 174
distance is maximal: the rod velocity is equal to zero. 175
a phase of unloading–loading cycles corresponding to the stabilization of the rod. The 176
fourth point (4) shows the moment when the rod velocity is zero for second time. 177
Figure 9. Examples of load–penetration curves obtained for 3 tests performed with the same impact energy.
Figure 10. Rod velocity versus time during a impact penetration test for for 3 tests performed with the same impact energy.
Figure 11 shows the load–penetration curve for different impact velocities ( = 1.0). For an
178
impact velocity of 250 mm/s or smaller, the energy injected is not large enough to drive the 179
rod in the medium: at the end of the impact test, the tip comes back to its initial position; the 180
tip force first increases and then rapidly decreases; the plastic phase of load–penetration curve 181
(Fig.9) is not observed. For impact velocity of 500 mm.s-1 or greater, the tip does not come
182
back completely to its initial position. Figure 11 shows that the minimal velocity required to 183
penetrate the granular material is a value between 250 and 500 mm.s-1. When the impact 184
velocity is greater than 500 mm.s-1,the plateau of the load–penetration curve corresponding to 185
the plastic phase is observed. 186
187
Figure 11. Load versus penetration distance for different impact velocities for impact penetration test.
188
Although, there is a difference between the maximal penetration distance smax and the final
189
residual penetration distance sres due to the rebound of the rod at the end of the test, the work
190
of the tip force between these two positions is negligible. Consequently, the impact tip 191
resistance Rd of each sample was calculated as the average tip force Fd for penetration
192
distance between 0 and maximal value smax:
193
(3)
with t the time and tsmax the time when penetration distance is maximal and equal to smax.
194
<Rd> is the average value of impact tip resistances obtained on 3 samples. Figure 12 shows
195
the curve of <Rd> versus maximal rod velocity Vrodmax for different impact energy. We find
196
that <Rd> increases when the rod velocity increases.
198
Figure 12. Average tip resistance <Rd> versus maximum rod velocities. Upper x-axis shows the corresponding
199
values of inertial number (height of vertical bars represent twice the standard deviation of Rd).
200
5. Tip force comparison for constant velocity and impact
201
conditions with different rod velocities
202
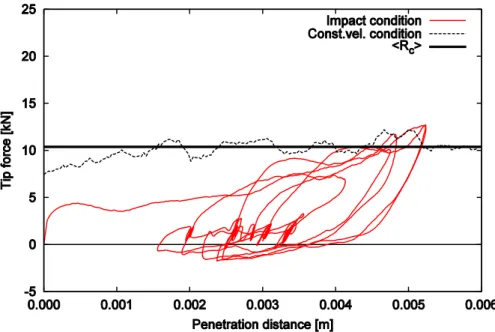
Figure 13 presents the tip force versus penetration distance in both constant velocity and 203
impact conditions for a rod velocity of 500 mm.s-1, corresponding to the quasi–static regime
204
of solicitation. We found that the amplitude of tip force Fd is weaker than the average tip
205
force <Rc>. This observation is correlated to the fact that in impact conditions, the impact
206
energy is not sufficient for driving the rod through the granular material. At the end of the 207
phase 1, Fd reaches the value of Fc but then Fd immediately decreases.
209
Figure 13. Tip force versus penetration distance for constant velocity penetration test with Vrod = 500 mm.s-1 and
210
for 5 blows of impact penetration tests performed with VI = 500 mm.s-1.
211
Figures 14 and 15 present the tip force versus penetration distance in both constant velocity 212
and impact conditions at 1250 mm.s-1 and 2500 mm.s-1 of rod velocity range. For this
213
penetration rate, the particle behavior is in the dense flow regime. In contrast to 500 mm.s-1 of
214
rod velocity range, we get to generate sufficient energy from the impact to activate the plastic 215
phase. We found that the tip force amplitude is similar in both constant velocity and impact 216
conditions. In addition, the tip force oscillations become more important when the penetration 217
rate increases (Fig.14,15). 218
219
Figure 14. Tip force versus penetration distance for constant velocity penetration test with Vrod = 1250 mm.s-1
220
and for 5 blows of impact penetration tests performed with VI = 1250 mm.s-1.
222
Figure 15. Tip force versus penetration distance for constant velocity penetration test with Vrod = 2500 mm.s-1
223
and for 5 blows of impact penetration tests performed with VI = 2500 mm.s-1.
224
Figure 16 presents the comparison between the average tip forces obtained in constant 225
velocity and impact conditions at different penetration rates. In fact, the average tip force in a 226
homogeneous medium is stable in the zone where the surface effect is prevented by the 227
vertical confining stress used on top wall. Thus, the average tip force do no depend on the 228
penetration distance for any penetration condition. We note that <Rd> is presented in impact
229
condition as function of maximal rod velocity Vrodmax. In quasi–static regime and for similar
230
rod velocity, we found that the <Rd> is smaller than the one obtained in constant velocity
231
penetration test. In dense flow regime (Vrod 1250 mm.s-1), <Rd> becomes close to <Rc>. For
232
high impact energy, the rod velocity in impact condition increases only during the impact. 233
After that, the rod velocity decreases due to the reaction of the particles below the tip. Thus, 234
the <Rc> can be always greater than <Rd> for all rod velocities in dense flow regime.
236
Figure 16. Average tip resistances <Rc> and <Rd> versus rod velocity.
237
In 3D conditions, we can assume that, as in 2D, an impact energy which is too low can be 238
insufficient to penetrate the material and then to measure a representative tip resistance. On 239
the opposite, for penetration rates high enough, a tip resistance can be measured in impact 240
condition. The increase of tip resistance with the rod velocity was observed in 3D conditions 241
in [4]. In addition, in experimental tests, it is commonly observed that static penetration 242
resistance, measured with low penetration velocity, is lower than dynamic tip resistance, 243
which is measured with relatively high penetration rates. The same trend is observed here on 244
Fig.16: tip resistance in impact condition, for higher rod velocity is greater than tip resistance 245
in constant velocity condition obtained with lower velocity. 246
6. Conclusion
247
A 2–dimensional discrete numerical model was proposed to model penetration tests in 248
granular materials. Two types of tests were performed: constant velocity conditions tests and 249
impact conditions tests. The responses obtained in terms of tip forces versus penetration depth 250
is similar to classical experimental results. 251
Penetration test in soils actually is a three–dimensional problem but was simulated here in 252
plane strain or two dimensions in this study. It is true that an assembly of disks cannot capture 253
exactly the behavior of a real granular material. However, the study presented here focuses 254
only on the mechanisms involved in two different types of penetration tests and on the effect 255
of driving velocity. The study presented here has no intention to link directly and 256
quantitatively the results obtained in 2D with 3D modelling or field penetration tests. Yet, the 257
basic laws governing the behavior of a mechanical system such as assemblies of disks or 258
spheres are supposed to be shared between those different kinds of systems. Indeed, number 259
of studies proved 2D DEM to be efficient in describing soil behavior [10]. Also, the basic 260
trends observed here are in agreement with other papers focused on 3D simulations. 261
The effect of penetration rate on constant velocity and impact penetration tests where 262
investigated. The particle behavior changes from quasi–static regime to dense flow regime 263
when rod velocity range varies from 25 mm.s-1 to 5000 mm.s-1 with a transition value around 264
1250 mm.s-1. 265
In constant velocity condition, the tip force is stable when the rod velocity is lower than 266
1250 mm.s -1. However, the average tip resistance and the dispersion of tip force increase 267
rapidly when the particle behavior in dense flow regime for a tip velocity greater than 268
1250 mm.s-1. 269
In impact condition, the load–penetration curves consists in 3 different phrases. The variation 270
of tip force increases in terms of amplitude when the impact velocity increases. In addition, 271
the energy injected is not large enough to drive the rod in the medium in impact condition 272
when the impact velocity is lower than 500 mm.s-1.
273
Finally, the tip forces obtained from impact and constant velocity penetration tests were 274
compared. In quasi–static regime corresponding to impact velocities less than 500 mm.s-1, the
275
impact energy is not sufficient for driving the rod through the granular material. For greater 276
impact energy, the amplitude of tip force is closer to but lower than average tip resistance 277
<Rc> obtained in constant velocity test with the same rod velocity. When comparing constant
278
velocity and impact tests, the rod velocity in impact test is the same as in the constant velocity 279
test only at the beginning of the penetration process; as the tip penetrates the material, its 280
velocity progressively decreases and the resulting tip force is lower. 281
In future tests, it would be interesting to quantify the influence on the results of the contact 282
model and also consider the effect of particle crushing in order to refine the analysis of the 283
results. 284
Reference
285
[1] Benz Navarrete, M. (2009). Mesures dynamiques lors du battage du pénétromètre 286
Panda 2. PhD thesis, Clermont-Ferrand: Université Blaise Pascal.
[2] Benz, M.A., Escobar, E., Gourvès, R., Haddani, Y., Breul, P. & Bacconnet, C. (2013). 288
Dynamic measurements of the penetration test - Determination of the tip’s dynamic load-289
penetration curve. Proc. of the 18th Int. Conf. on the Soil Mech. and Geotech. Eng., Paris, 290
499 – 502. 291
[3] Breul, P., Benz, M., Gourvès, R., & Saussine, G. (2009, June). Penetration Test 292
Modelling in a Coarse Granular Medium. In Powders and Grains 2009: Proceedings of the 293
6th International Conference on Micromechanics of Granular Media (Vol. 1145, No. 1, pp.
294
173 - 176). AIP Publishing. 295
[4] Quezada, J. C., Breul, P., Saussine, G., & Radjai, F. (2014). Penetration test in coarse 296
granular material using Contact Dynamics Method. Computers and Geotechnics, 55, 248– 297
253. 298
[5] Huang, A. B. & Ma, M. Y. (1994). An analytical study of cone penetration test in 299
granular material. Canadian Geotechnical Journal 31, No.1, 91 – 103. 300
[6] Huang, A. B. & Hsu, H. H. (2004). Advanced calibration chambers for cone 301
penetration testing in cohesionless soils. ISC-2 Geotech. and Geophys. Site Characterization, 302
Porto, 147 – 166.
303
[7] Calvetti, F. & Nova, R. (2005). Micro-macro relationships from DEM simulated 304
element and in-situ tests. Proc. 5th Int. Conf. Micromech. Granular Media: Powders and 305
Grains 2005, Stuttgart, 245 – 250.
306
[8] Jiang, M. J., Yu, H.-S. & Harris, D. (2006). Discrete element modeling of deep 307
penetration in granular soils. International Journal for Numerical and Analytical Methods in 308
Geomechanics 30, No. 4, 335 – 361.
309
[9] Jiang, M. J., Harris, D., & Zhu, H. (2007). Future continuum models for granular 310
materials in penetration analyses. Granular Matter, 9(1), 97–108. 311
[10] Jiang, M., Dai, Y., Cui, L., Shen, Z., & Wang, X. (2014). Investigating mechanism of 312
inclined CPT in granular ground using DEM. Granular Matter, 16(5), 785-796. 313
[11] Arroyo, M., Butlanska, J., Gens, A., Calvetti, F. & Jamiolkowski, M. (2011). Cone 314
penetration tests in a virtual calibration chamber. Géotechnique 61, No. 6, 525 – 531. 315
[12] McDowell, G. R., Falagush, O. & Yu, H. S. (2012). A particle refinement method for 316
simulating DEM of cone penetration testing in granular materials. Géotechnique Letters 2, 317
141 – 147. 318
[13] Robertson, P. K., & Campanella, R. G. (1983). Interpretation of cone penetration 319
tests. Part I: Sand. Canadian Geotechnical Journal, 20(4), 718-733. 320
[14] Chaigneau, L. (2001). Caractérisation des milieux granulaires de surface à l’aide d'un 321
pénétromètre. PhD thesis. Clermont-Ferrand: Université Blaise Pascal.
322
[15] Cundall P. A. & Strack O. D. L. (1979). A discrete numerical model for granular 323
assemblies. Géotechnique 29, No. 1, 47 – 65. 324
[16] Combe G. (2002) Mécanique des matériaux granulaires et origines microscopiques de 325
la déformation. Etudes et Recherches du Laboratoire Central des Ponts et Chaussées, SI8. 326
[17] Roux, J.-N., & Chevoir, F. (2005). Discrete numerical simulation and the mechanical 327
behavior of granular materials. Bulletin Des Laboratoires Des Ponts et Chaussées, (254), 328
109 – 138. 329
[18] Cundall P.A., Drescher A. & Strack O.D.L. (1982). Numerical experiments on 330
granular assemblies: measurements and observations. IUTAM Conf. on Deformation and 331
Failure of Granular Materials, Delft, 355 - 370.
332
[19] Tran, Q. A., Chevalier, B., & Breul, P. (2015). A numerical study of the penetration 333
test at constant rod velocity. Computer Methods and Recent Advances in Geomechanics – 334
Oka, Murakami, Uzuoka & Kimoto (Eds.), p. 193-198.
![Figure 2. Example of experimental load–penetration curve obtained in a impact penetration test for one impact [2]](https://thumb-eu.123doks.com/thumbv2/123doknet/14644467.549874/3.892.458.795.746.1051/figure-example-experimental-penetration-obtained-impact-penetration-impact.webp)