HAL Id: tel-01870943
https://tel.archives-ouvertes.fr/tel-01870943
Submitted on 10 Sep 2018
HAL is a multi-disciplinary open access
archive for the deposit and dissemination of sci-entific research documents, whether they are pub-lished or not. The documents may come from teaching and research institutions in France or abroad, or from public or private research centers.
L’archive ouverte pluridisciplinaire HAL, est destinée au dépôt et à la diffusion de documents scientifiques de niveau recherche, publiés ou non, émanant des établissements d’enseignement et de recherche français ou étrangers, des laboratoires publics ou privés.
batteries: understanding of the lithium storage
mechanisms
Samantha Bourrioux
To cite this version:
Samantha Bourrioux. Laser-pyrolysed ZnFe2O4 anode for lithium-ion batteries: understanding of the lithium storage mechanisms. Material chemistry. Communauté Universite Grenoble Alpes, 2018. English. �tel-01870943�
THÈSE
Pour obtenir le grade de
DOCTEUR DE LA COMMUNAUTE UNIVERSITE GRENOBLE
ALPES
Préparée dans le cadre d’une cotutelle entre la Communauté
Université Grenoble Alpes et Nanyang Technological
University, Singapour
Spécialité : Matériaux
Arrêté ministériel : le 6 janvier 2005 - 7 août 2006
Présentée par
« Samantha / BOURRIOUX »
Thèse dirigée par « Alain / PASTUREL » Codirigée par « Madhavi / SRINIVASAN »
Préparée au sein des Laboratoires LEDNA (CEA Saclay) et
Energy Research Institute @ NTU (ERIAN)
Dans les Écoles Doctorales I-MEP2 et Interdisciplinary
Graduate School (IGS)
Laser-pyrolysed ZnFe
2
O
4
anode
for lithium-ion batteries:
understanding of the lithium
storage mechanisms
Thèse soutenue publiquement le « 2 février 2018 », Devant le jury composé de :
Madame, Christel, LABERTY-ROBERT
Professeur, Université Pierre et Marie Curie, rôle (Président)
Monsieur, Frédéric, BERNARD
Professeur des Universités, Université de Bourgogne, rôle (Rapporteur)
Monsieur, François, TRAN VAN
Professeur des Universités, Université François Rabelais, rôle (Rapporteur)
Monsieur, Claude, GUET
Professeur, Nanyang Technological University, rôle (Examinateur)
Madame, Fannie, ALLOIN
Directeur de Recherche, Université Grenoble-Alpes, rôle (Examinateur)
Monsieur, Yann, LECONTE
Chercheur, CEA, rôle (Co-encadrant)
Madame, Laure, MONCONDUIT
This PhD has been conducted in cotutelle between the University of Grenoble-Alpes and the Nanyang Technological University of Singapore.
This work has been realized in the laboratory of Nanometric Structures (LEDNA) in the French Alternative Energies and Atomic Energy Commission (CEA) and in the Energy Research Institute @NTU (ERI@N) in Singapore. Financial support came from the Advanced Materials Cross-Cutting Program (PTMA) of the CEA.
I would like to acknowledge first the different persons who made this PhD possible:
Thank you to Cécile Reynaud and Martine Mayne who allowed me to conduct my PhD in their laboratory. Special thanks to Martine who helped me as far as possible especially during the last months of my PhD and during my stay in Singapore. I would also like to acknowledge Professor Claude Guet who partly supervised this cotutelle project and Frédéric Schuster, head of the Cross-Cutting Program.
My thanks also go to Professor Alain Pasturel who accepted to be my PhD supervisor in France. I would like to thank him for his precious help during these three years of studies, especially concerning the corrections of my manuscript and in resolving many administrative issues. My appreciation is also due to Professor Madhavi Srinivasan who welcomed me in her laboratory in NTU for one year. Thank you for the corrections of my manuscript, especially for the electrochemistry part.
I would also want to express my thanks to the different members of the jury who accepted to evaluate my work and for their attendance in my oral defense. More particularly, thank you to Frédéric Bernard and François Tran-Van who accepted to read my manuscript and who were interested in my thesis.
The electrochemistry part of this work has been conducted in collaboration with the Charles Gerhardt Institute of Montpellier. I would like to express my gratitude to Laure Monconduit, head of the AIME laboratory for accepting this collaboration. She helped me a lot during my thesis to answer many questions about electrochemistry for conversion materials. Laure also took time to give me advice and make corrections on my manuscript. Thank you for letting me working few weeks in your laboratory. Thank you to Moulay Sougrati and Lorenzo Stievano too, who were really helpful when I was in Montpellier, especially to conduct some operando measurements.
French.
Je vais commencer par remercier les différentes personnes que j’ai côtoyées durant ma thèse au CEA, en commençant par l’une des plus importantes, l’expert en pyrolyse laser, appelé parfois Hulk ou Géant Vert en raison de sa force prodigieuse pour refermer les bouteilles de gaz (que je n’arrivais plus à ouvrir après) et de la couleur de son manteau …, celui qui a encadré ma thèse pendant ces trois années, j’ai nommé : Yann Leconte. Je ne te remercierai sans doute jamais assez pour m’avoir permis de réaliser cette thèse malgré tous les obstacles qu’il y a eu à franchir pour arriver jusqu’au bout. Tu as vraiment été un encadrant en or du début à la fin, tu m’as appris les joies (et les malheurs … !) de la pyrolyse laser, tu as toujours été présent pour répondre à mes questions, pour me conseiller tout en me laissant toujours de l’autonomie et la possibilité de faire mes choix dans mon projet de recherche. Tu m’as motivée à faire de mon mieux et d’ailleurs, au-delà du boulot, tu as réussi à faire quelque chose que je n’aurais jamais cru possible il y a quelques années : me lancer dans la course à pied ! Maintenant, au lieu de me retrouver en PLS après avoir couru 500 m, je suis capable de tenir 10 km, parce que je ne suis pas une « dégonflée » ! Tu as toujours été là pour me remonter le moral ou me remotiver dans les moments les plus difficiles en fin de thèse et je sais à quel point tu as bataillé pour que tout se passe du mieux possible, en France comme à Singapour. Je me souviendrai toujours de mon entretien, lorsque j’ai vu ta batte de base-ball posée bien en évidence sur ton bureau et où je me suis demandée où je venais d’atterrir et si c’était une bonne idée que j’accepte cette thèse ! Et bien au final, même si cette thèse ne s’est pas déroulée dans les meilleures conditions possibles, tu fais partie des personnes qui m’auront permis d’en garder un très bon souvenir et ça, en partie grâce à ton infaillible sens de l’humour ! Je sais que je t’ai souvent dit que tes blagues étaient nulles mais en fait, pas tant que ça (ou alors je m’y suis habituée ?). Bon, tes remerciements prennent déjà une demi-page alors je vais m’arrêter là sinon les suivants vont être jaloux et puis, il ne faudrait pas que tu aies les chevilles qui enflent ;).
Je souhaite ensuite remercier sincèrement une collègue devenue au fil des mois une grande amie : Axelle Quinsac. Avant que tu ne reviennes au CEA, Yann m’avait dit qu’on allait bien s’entendre toutes les deux et il avait raison ! On se ressemble sur pas mal de points et je suis vraiment contente d’avoir trouvé quelqu’un qui aime au moins autant que moi les chips, les bonbons qui piquent, la chaleur des radiateurs plutôt que le froid glacial de nos bureaux, qui a les mêmes problèmes de chaussettes, qui déteste ses cheveux autant que je déteste les miens et qui est aussi pipelette que moi. Merci pour tous les bons moments passés ensemble, que ça soit au labo ou à l’extérieur, tu as aidé à rendre moins monotone la contemplation de flammes de pyrolyse laser quand on manipait ensemble ! Plus sérieusement, merci à toi d’avoir été un soutien sans faille et d’avoir toujours essayé de me montrer le
a prévu de faire une course ensemble un jour !
Je vais continuer avec notre experte MEB, BET, ATG … et j’en passe, Miss Aurélie Habert ou tout simplement Lili, notre technicienne multitâches, qui m’a aidé à réaliser tout plein de caracs physico-chimiques depuis le début de ma thèse. On en aura passé des journées devant le MEB, à chercher ces particules d’oxydes zinc-fer, à faire de l’EDX où on ne voyait finalement rien du tout, ou à essayer d’imaginer des formes dans nos images (des têtes de Mickey par exemple !). Comme tout doctorant qui se respecte, je sais que je t’ai demandé beaucoup de caractérisations de dernière minute pour terminer de remplir mon manuscrit ou pour ma soutenance de thèse, alors merci beaucoup d’avoir toujours été disponible et motivée pour m’aider malgré le fait que tu sois sollicitée de partout. Merci aussi pour ta bonne humeur au labo, pour nos petites séances de papotages à l’ATG et pour nos pauses café/chocolat chaud au soleil bien sympas. Et je n’oublie pas notre soirée raclette + PS4 !
Je souhaite également remercier Olivier Sublemontier, grand mentor de Youri pendant quelques années, qui lui a tout enseigné sur comment être un bon « anti-Microsoft » … oups pardon, comment réaliser de superbes couches minces par co-dépôt PVD/pyrolyse avec ALICE bien sûr. Je retiendrai d’Olivier son calme olympien en toutes circonstances … sauf quand on lui file un ordinateur avec « Windaube » entre les mains ! Je retiendrai aussi ses performances hors normes en course à pied, qui font que j’avais un point de côté en moins de 5 minutes en courant avec lui ! En tout cas Olivier, merci pour ta bonne humeur, pour ton soutien durant cette thèse et pour tes conseils en course à pied ! Je continue avec les permanents en prenant le temps de remercier Henri, THE électrochimiste, le maître des jeux de mots (qui forme un duo d’humoristes « subtil » avec Yann, n’est-ce pas ?) et le musicien du LEDNA (je pense notamment à tes joyeux sifflements que l’on pouvait entendre dans les labos) ! J’ai été et je suis toujours aussi très impressionnée par ta passion pour ton travail, par ta rigueur et ton acharnement sur les manips de pyrolyse laser. Merci de m’avoir soutenue, en particulier pendant la fin de ma thèse, dans cette période un peu tumultueuse entre le manuscrit, les rapports et la préparation de ma soutenance. Je te souhaite le meilleur pour la suite (et de réussir à percer les mystères de la pyrolyse laser ;) ).
Je vais continuer avec tous les anciens doctorants, maintenant docteurs, qui ont dû supporter ma présence plus ou moins longtemps pendant ces trois années de thèse. Je commence par mes collègues de bureau qui ont eu à supporter ma compétence + 1000 en bavardage, mon rire assez peu discret que l’on pouvait entendre à l’autre bout du couloir ainsi qu’une température tropicale après allumage du radiateur à fond quand il faisait moins de 25°C dehors.
conversations ô combien intéressantes sur les stratégies à adopter dans la faille de l’Invocateur … et aussi pour les éclaircissements que tu as pu m’apporter sur SYLVANA et en électrochimie ! Merci aussi d’avoir répondu à mon trèèèèèès long mail de 50 questions avant même que je sois acceptée en thèse, j’ai cru comprendre que ça t’avait marqué ! On n’a pas vraiment eu l’occasion de maniper ensemble et au final, tu as assez rapidement quitté le bureau pour aller t’isoler/t’exiler, seul, dans le « frigo » pour rédiger ton manuscrit. Peut-être avais-tu déjà prédit qu’il te serait impossible de finir ta rédaction dans le temps imparti en restant dans le même bureau que Sarah et moi ! En tout cas, maintenant qu’on est tous les deux diplômés et bien lancés dans le monde de l’électrochimie et du stockage d’énergie, on va peut-être avoir l’occasion de travailler ensemble. Quand est-ce qu’on retourne à la plage … euh ... à la conférence à Arcachon ?
Mes remerciements vont ensuite à Mlle Bouhadoun, plus connue sous le nom de « Princesse Sarah » ! Pendant près d’un an, tu auras été une voisine de bureau au top, dans lequel tu as su mettre de l’ambiance avec tes régulières sautes d’humeur à cause des manips de pyrolyse laser que tu adorais tant ! Tu m’as aussi beaucoup impressionnée par ta « positive attitude » pendant ta période de rédaction où on a passé pas mal de temps à chercher des synonymes de « en effet », « cependant », « malgré », etc. Je me rappelle aussi du temps qu’on a passé à décorer notre mini sapin de Noël dans le bureau (d’ailleurs, il y est resté plusieurs années !) avec une unique boule de Noël et plein de bouts de papier découpés. Ça devait être le sapin le plus moche qu’on ait jamais vu de notre vie ! Je me rappellerai aussi un bon moment de notre période « Maybe » où on avait toutes les deux totalement craqué quand on lui avait demandé son âge et qu’il nous avait répondu « ça dépend ». En tout cas, merci pour ton soutien pendant ma rédaction et pour les ondes positives que tu m’as envoyées pour ma soutenance alors que tu n’étais même plus ma coloc de bureau. Je te souhaite bon courage pour la suite, tout se passera bien pour toi !
I will switch in English for this paragraph to send many thanks to my former Singaporean colleague Paul Wang, who worked for one year in the lab in France and who helped me a lot then when I came to Singapore. Without your help, I think it would have been really difficult for me to stay and work at NTU. Your assistance was more than a bonus during my PhD. I think I will remember for a long time this evening when you started to taste limoncello using a fruit juice glass and I will also remember for a while your unconditional love for cheese. If you came back to France one day, I will be very happy to invite you for a raclette party!
Dans la famille des anciens doctorants qui sont devenus des amis, je demande aussi M. Youri Rousseau ! On peut aussi l’appeler M. Apple ou M. Lexus, ou comme on s’appelle affectueusement,
un soutien pendant toute ma thèse, même quand j’étais à 10000 km de là. Si mon séjour à Singapour s’est déroulé un peu mieux, c’est en grande partie grâce à toi Youri. Je me remémore encore nos journées passées au MET, dans le noir et dans le froid, à la recherche des nanoparticules et des coatings de carbone, tout en chantant du Shakira et en tentant vainement d’imiter son déhanché ! Je te remercie aussi d’avoir tenté de partager avec moi une superbe terrine à la Ferme de Dédé à Grenoble… je dis bien « tenté » puisque tu m’as lâchement laissé terminer cette énorme terrine pour pouvoir manger plus de raclette… 200 grammes seulement qu’elle a dit la serveuse c’est ça ? ;) J’en profite par la même occasion pour remercier ta femme, Anaïs Rousseau (je souligne car je sais que c’est un détail important !). Merci à toi Anaïs d’avoir été présente durant ma thèse mais aussi en tant que super amie et cosplayeuse qui a accepté et accepte encore de me suivre dans mes projets tous plus fous les uns que les autres.
Après les anciens doctorants et anciens voisins de bureau, je remercie les nouveaux doctorants qui ont été mes nouveaux voisins pendant mes derniers mois de thèse : Antoine Desrues et Raphaëlle Belchi. Au final, je ne vous ai pas côtoyés très longtemps mais je vous remercie tous deux de votre soutien pendant ma troisième année. Je vous souhaite bon courage pour la suite de votre doctorat, vous en aurez bien besoin pour arriver à dompter SYLVANA ! J’aimerais aussi en profiter pour remercier Florent, un collègue très discret mais avec qui on finit par avoir des discussions très sympas quand on prend le temps de le connaître.
Merci aussi à Nathalie, Dominique, Amandine et tous les collègues du LEDNA que je n’ai pas cités au-dessus, les permanents et non-permanents, les anciens et nouveaux doctorants, post-doctorants, apprentis et stagiaires que j’ai pu côtoyer plus ou moins longtemps durant ma thèse.
Après les anciens collègues et amis, passons aux nouveaux ! Merci à tous mes collègues de Zinium qui m’ont donné le courage d’affronter cette soutenance de thèse et les derniers déboires administratifs en m’envoyant leurs ondes positives. Merci aussi à eux d’instaurer une ambiance géniale dans ce nouveau travail, ce qui a grandement contribué à me permettre de terminer plus sereinement ma thèse. Alors à Antoine, Lorna, Adrien, Fabien, Rémi, Julien, Louis, je vous dis merci et j’espère vraiment qu’on restera une équipe aussi soudée un bon moment encore !
Mes remerciements vont aussi à mes amis qui sont venus me faire coucou à Singapour pendant quelques jours ou quelques semaines : Mehdi, Mégane, Céline, Eve et Denis. Je tiens aussi à remercier Lauren, Amira, Alice et Guillaume, d’autres étudiants Français rencontrés à Singapour et qui ont permis de rendre ce séjour un peu plus sympathique.
des soutiens durant toute la période de ma thèse, bien avant, et même encore maintenant. De même, je souhaite remercier Steven, qui m’a accompagnée et soutenue dans mes choix durant toutes mes années d’études depuis le lycée.
3 Table of contents ... 3 List of figures ... 5 List of tables ... 11 List of abbreviations... 13 Introduction ... 15 References ... 19
Chapter 1. Literature review ... 21
I. Presentation of the lithium-ion technology ... 22
1. History and basic principles of the lithium-ion battery ... 22
2. Categories of anode materials depending on the lithium storage mechanism ... 27
II. Transition metal oxides as anode materials for Li-ion batteries ... 33
1. Examples of MxOn oxides ... 33
2. Interest of mixed-transition metal oxides (MTMO) ... 37
3. Optimization of the material performances ... 44
III. Experimental methods for the synthesis of nanostructured mixed-transition metal oxides ... 53
1. Solid-state syntheses ... 53
2. Liquid phase syntheses ... 54
3. Vapor phase syntheses ... 56
IV. Laser pyrolysis for the synthesis of nanopowders ... 61
V. Intermediate conclusion ... 64
References ... 65
Chapter 2. Experimental protocols ... 71
I. Description of a synthesis by laser pyrolysis ... 72
1. Experimental set-up ... 72
2. Influence of the experimental parameters ... 76
3. Typical conduct of a synthesis... 78
II. Characterization of laser-pyrolysed samples: structural properties ... 81
1. X-ray powder diffraction (XRD) ... 81
4
microscopy (HRTEM) ... 81
4. Thermo-gravimetric analysis (TGA) ... 82
5. Brunauer-emmett-teller (BET) ... 82
6. Mössbauer 57Fe ... 82
III. Characterization of laser-pyrolysed samples: electrochemical properties ... 84
1. Coin cells preparation ... 84
2. Galvanostatic cycling... 85
3. Cyclic voltammetry ... 88
4. Operando measurements ... 89
Chapter 3. Syntheses by laser pyrolysis of zinc iron oxides ... 91
I. Synthesis of zinc iron oxide nanopowders ... 92
1. Nitrates precursors ... 93
2. Chlorides precursors ... 107
II. Synthesis of iron oxide nanopowders ... 113
III. Synthesis of zinc oxide nanopowders ... 118
IV. General discussion on nitrate precursors and laser assisted flame synthesis ... 122
V. Thermal treatment of the samples before electrochemical tests ... 125
VI. Intermediate conclusion ... 127
References ... 128
Chapter 4. Evaluation of the electrochemical performances of ZnFe2O4, ZnO and Fe2O3 ... 129
I. Choice of the electrode formulation and of the electrolyte ... 130
II. Electrochemical performances of ZnFe2O4 nanopowders ... 134
1. Influence of the morphology of ZnFe2O4 nanoparticles ... 134
2. Investigation of the lithium storage mechanism ... 149
III. Electrochemical performances of ZnO and Fe2O3 ...164
1. Electrochemical performances of ZnO, Fe2O3 and ZnO/Fe2O3 mixture ... 164
2. Understanding of the lithium storage mechanism ... 171
IV. Intermediate conclusion ... 175
References ... 176
Conclusions and recommendations for future works ... 179
5
Figure 1. Evolution of greenhouse gases emissions from 1970 to 20103 ... 15
Figure 2. CO2 emissions from fossil fuel combustion by sector and fuel type (2006)5 ... 16
Figure 3. Hourly supply and demand in energy6 ... 17
Figure 1.1. Schematic diagram of (a) a redox reaction, (b) a primary (non-rechargeable) battery upon discharging and (c) a secondary (rechargeable) battery upon charging3 ... 23
Figure 1.2. Comparison of the energy and power densities for different energy storage technologies4 ... 24
Figure 1.3. Different technologies of batteries with their gravimetric and volumetric energy density6 24 Figure 1.4. Rechargeable Li-metal battery (the picture of the dendrite growth at the Li surface was obtained directly from in-situ scanning electron microscopy measurements)5 ... 25
Figure 1.5. Charge/discharge process for a commercial lithium-ion battery14 ... 26
Figure 1.6. Insertion of lithium ions between graphite layers19 ... 28
Figure 1.7. Examples of alloying materials and their theoretical capacity12 ... 29
Figure 1.8. SEI formation on silicon surface during lithiation and delithiation process27 ... 30
Figure 1.9. In-situ HREM of lithiation of Co3O4 showing the insertion, amorphization and reduction processes35 ... 31
Figure 1.10. Different categories of positive and negative electrode materials with their theoretical working voltage vs. Li/Li+ and their specific capacities62 ... 36
Figure 1.11. Spinel structure AB2O472 ... 38
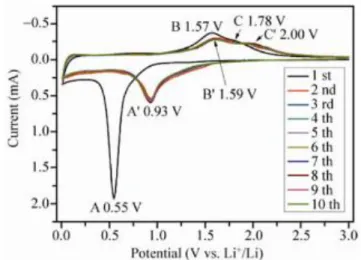
Figure 1.12. Cyclic voltamograms of the ZnFe2O4 electrode at a scan rate of 0.1 mV/s in the voltage range of 0.01V-3.0V vs. Li/Li+81 ... 41
Figure 1.13. First charge and discharge profiles for ZnFe2O4 in the voltage range of 0.01-3.0V79 ... 42
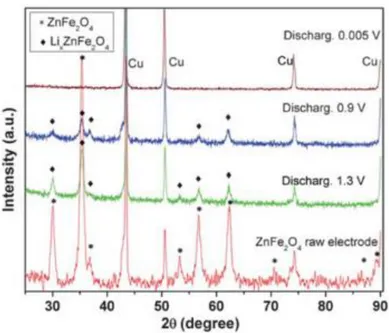
Figure 1.14. Ex-situ XRD at different steps of the first discharge for ZnFe2O480 ... 43
Figure 1.15. Ex-situ HRTEM after a full discharge and its corresponding SAED81 ... 43
Figure 1.16. Strategies to enhance electrode performances18 ... 45
Figure 1.17. Nanostructuration of the active material to sustain the volumetric expansion during cycling85 ... 46
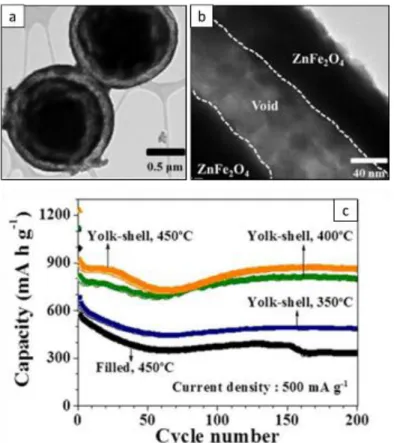
Figure 1.18. Morphology of the yolk-shell structure observed by TEM (a,b) and electrochemical performances of yolk-shell and spherical ZnFe2O4 nanoparticles at 500 mA.g-1(c)... 47
Figure 1.19. Morphology of the nanorods (a) and nanofibers (b) observed by SEM and comparison of performances during cyclings at 60 mA.g-1(c) ... 48
6
performance with pure ZnFe2O4 at C/10 current rate (b) ... 49
Figure 1.21. SEM images of ZnFe2O4 particles (a) and ZnFe2O4/graphite (b). Comparison of electrochemical performances of ZnFe2O4 and ZnFe2O4/graphite at 100 mA.g-1(c) ... 50
Figure 1.22. TEM images of pure ZnFe2O4 nanoparticles (a) and ZnFe2O4/graphene (b). Comparison of performances between pure ZnFe2O4 and ZnFe2O4/graphene composite at 100 mA.g-1. ... 51
Figure 1.23. Morphology of ZnFe2O4/C nanodiscs observed by TEM (a) and HRTEM (b) and comparison of performances with ZnFe2O4 (c) ... 52
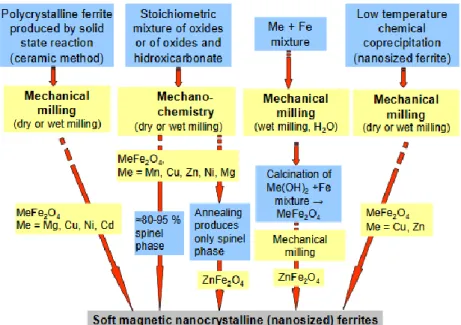
Figure 1.24 Different mechanical routes for the syntheses of nanocrystalline ferrites92 ... 53
Figure 1.25. (a) ZnFe2O4 nano-octahedrons obtained by hydrothermal synthesis (T: 180° for 14h)81, (b) MnCo2O4 spherical nanoparticles obtained by hydrothermal synthesis (T: 180°C, 8h)94 ... 54
Figure 1.26. Synthesis of nanomaterials by the sol-gel method95 ... 55
Figure 1.27. SEM images of ZnFe2O4 and NiFe2O4 nanoparticles obtained by the sol-gel method ... 55
Figure 1.28. Schema of the spray pyrolysis process101 ... 56
Figure 1.29. Different steps of grains formation in spray pyrolysis: solvent vaporization, precipitation, solid state precursors reaction, sintering102 ... 57
Figure 1.30. Formation mechanism of ZnCo2O4 nanostructures78 ... 58
Figure 1.31. Different types of aerosol flame synthesis processes103 ... 59
Figure 1.32. Laser pyrolysis experimental setup ... 61
Figure 1.33. Pyrolysis flame of silicon nanoparticles using silane precursor ... 62
Figure 1.34. a) TEM image of TiO2 nanoparticles122, b) SEM image of SiC nanoparticles121 ... 62
Figure 2.1 Scheme of the laser pyrolysis experimental set-up ... 72
Figure 2.2. Focusing of the laser beam with a cylindrical lens (f = 50 cm) ... 73
Figure 2.3. Schemes of the two aerosol generators used for the synthesis of zinc iron oxide ... 74
Figure 2.4. Porous filter for the collection of nanopowders in a glass collector ... 76
Figure 2.5. Examples of pyrolysis flames; a: before sending the aerosol, the flame is not very intense; b: with the aerosol, a long and brilliant flame can be observed ... 80
Figure 2.6. Half-cell assembly vs. metallic lithium ... 85
Figure 2.7. Current vs. time curves for galvanostatic cyclings measurements ... 86
Figure 2.8. Charge and discharge profiles. V1: discharge cut-off potential, V2: charge cut-off potential. ... 86
Figure 2.9. Voltage vs. time curves for cyclic voltammetry measurements ... 88
Figure 2.10. Cyclic voltammetry curves to identify the oxidation and reduction peaks: intensity vs. voltage ... 88
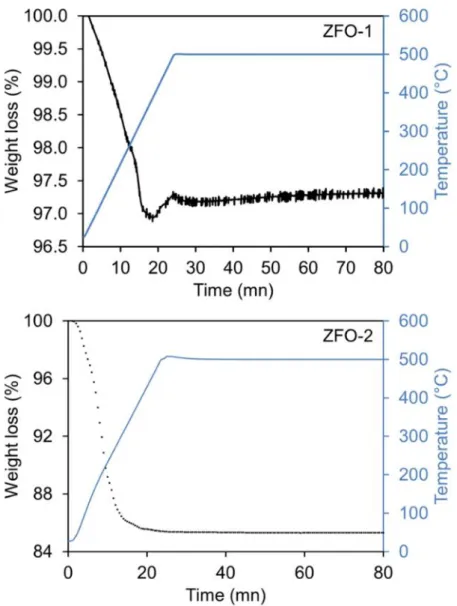
7 Figure 3.2. TGA measurements for ZFO-1 and ZFO-2 from 20°C to 500°C, ramp: 20°C/min and
isothermal step of 1h at 500°C ... 94 Figure 3.3. XRD patterns for ZFO-1 and ZFO-2. ZFO-1: pure ZnFe2O4 phase. ZFO-2 presents ZnFe2O4
phase with traces of non-stoichiometric zinc iron oxides phase ... 96 Figure 3.4. SEM (a) and TEM images (b,c) of ZFO-1: presence of both small nanoparticles (< 10 nm)
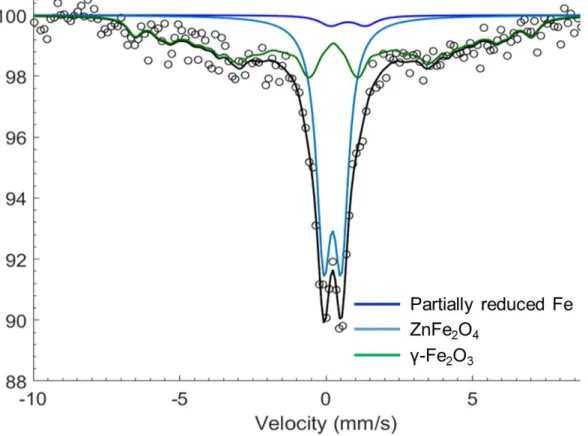
with larger particles (> 50 nm to hundreds of nm) ... 97 Figure 3.5. 57Fe Mössbauer spectrum of the pristine ZFO-1 sample measured at room temperature.
Three phases are observed: ZnFe2O4 (45% at.), γ-Fe2O3 (52% at.) and a minor iron phase (3% at.). ... 98 Figure 3.6. (a) Flame of air and ethylene and (b) flame of air, ethylene and precursors ... 100 Figure 3.7. TGA measurements for ZFO-3 from 40°C to 400°C, ramp: 10°C/min and isothermal of 50
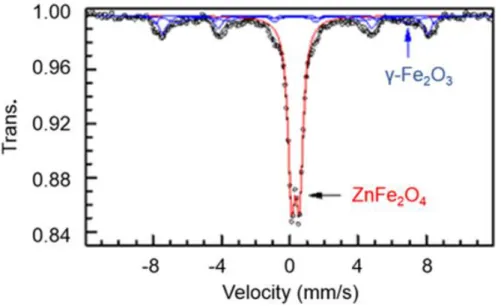
min at 400°C ... 100 Figure 3.8. XRD pattern for ZFO-3: presence of ZnFe2O4 and iron oxide phase ... 101 Figure 3.9. 57Fe Mössbauer spectrum for ZFO-3 measured at room temperature. Presence of two
phases: 65% at. of ZnFe2O4 and 35% at. of γ-Fe2O3 ... 102 Figure 3.10. Morphology of ZFO-3 sample observed by TEM (a,b). ... 103 Figure 3.11. HRTEM images of ZFO-3. Interplanar distances corresponding to Fe2O3 maghemite phase
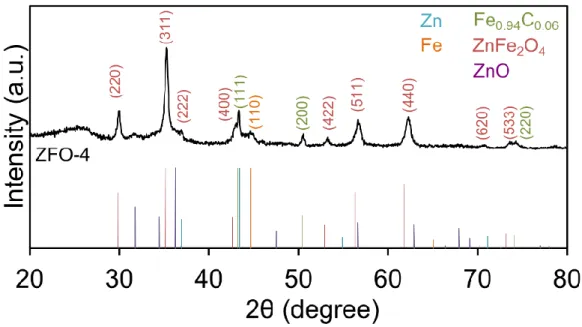
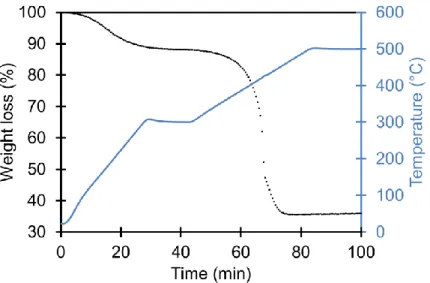
(left) and to ZnFe2O4 phase (right) ... 103 Figure 3.12. XRD pattern for ZFO-4: presence of ZnFe2O4 and Fe0.94C0.06 phases ... 105 Figure 3.13. TGA measurements for ZFO-4 from 20°C to 500°C, ramp: 10°C/min, isothermal of 1h at
500°C ... 106 Figure 3.14. TEM images of ZFO-4 (a,b). ... 106 Figure 3.15. XRD pattern for ZFO-5 and ZFO-6: presence of ZnFe2O4 in both samples, additional Fe
phase for ZFO-6 ... 108 Figure 3.16. Images of ZFO-5 observed by TEM: presence of only small nanoparticles (< 10 nm)
embedded in an amorphous matrix ... 109 Figure 3.17. TGA measurements for ZFO-5 from 20°C to 400°C, ramp at 20°C/min with an isothermal
at 400°C for 40 min ... 110 Figure 3.18. Morphology of ZFO-6 observed by TEM (left) and highlighting of graphite around the
nanoparticles ... 110 Figure 3.19. TGA measurements for ZFO-6 from 20°C to 500°C with an isothermal at 300°C and at
500°C ... 111 Figure 3.20. XRD patterns for FeOx-1 and FeOx-2 ... 114
8 precursor ... 115 Figure 3.22. XRD patterns of FeOx-3 and FeOx-4 ... 116 Figure 3.23. Mössbauer spectroscopy realized at room temperature confirms the presence of the
maghemite phase only in FeOx-4 ... 116 Figure 3.24. Observation of FeOx-3 (a) and FeOx-4 (b) morphologies by TEM ... 117 Figure 3.25. XRD patterns for ZnOx-1 and ZnOx-2 revealing a ZnO crystalline phase for both samples
... 119 Figure 3.26. SEM and TEM images of ZnOx-1 (a,b) and ZnOx-2 (c,d) ... 120 Figure 3.27. TGA measurements on ZnOx-2 from 50°C to 500°C, ramp of 20°C/min and isotherm at
500°C during 40 min ... 121 Figure 3.28. Possible growth processes during laser pyrolysis conducting to a bimodal particle size
distribution ... 123 Figure 3.29. TEM images of ZFO-5, ZnOx-2and FeOx-4 before (a,b,c, respectively) and after annealing
under air at 350 °C (d,e,f, respectively) ... 125 Figure 4.1. Galvanostatic cyclings at 100 mA.g-1 for ZFO-2 using four different combinations of
electrolyte and electrode formulation ... 131 Figure 4.2. Reversible capacity retention and cumulative irreversible capacity for C1, C2, C3 and C4
samples ... 132 Figure 4.3. Galvanostatic cyclings at 100 mA.g-1 for ZFO-1 and ZFO-5: charge/discharge capacity plots
(a, c) and cumulative irreversible capacity plots (b, d)... 134 Figure 4.4. Charge/discharge profiles (a, c) and dQ/dV curves (b, d) for ZFO-1 and ZFO-5 galvanostatic
cyclings at 100 mA.g-1 between 0.01 V and 3.0 V ... 135 Figure 4.5. Discharge capacity contribution from each region (a, c) and evolution of the polarization (b,
d) for ZFO-1 and ZFO-5 cyclings at 100 mA.g-1 between 0.01 V and 3.0 V ... 137 Figure 4.6. Galvanostatic cyclings at 1000 mA.g-1 for ZFO-1 and ZFO-5: charge/discharge capacity plots
(a, c) and cumulative irreversible capacity plots (b, d)... 138 Figure 4.7. Charge/discharge profiles (a, c) and dQ/dV curves (b, d) for ZFO-1 and ZFO-5 galvanostatic
cyclings at 100 mA.g-1 between 0.01 V and 3.0 V ... 139 Figure 4.8. Discharge capacity contribution from each region (a, c) and evolution of the polarization (b,
d) for ZFO-1 and ZFO-5 cyclings at 1000 mA.g-1 between 0.01 V and 3.0 V ... 140 Figure 4.9. Formation of the SEI around iron oxides depending on different particles morphologies18
... 141 Figure 4.10. Galvanostatic cyclings at 500, 2000 and 4000 mA.g-1 for ZFO-1 and ZFO-5:
9 Figure 4.12. Discharge capacity contribution from each region (a, c, e) and evolution of the
polarization (b, d, f) for ZFO-1 cyclings at 500, 2000 and 4000 mA.g-1 between 0.01 V and 3.0 V ... 146 Figure 4.13. Evolution of the polarization and of the resistance at the 100th cycle depending on the
current rate for ZFO-1 ... 147 Figure 4.14. Rate capability between 0.01 V and 3.0 V from C/5 to 4C ... 148 Figure 4.15. Cyclic voltammetry of ZFO-1 for the five first cycles, between 0.01 V and 3.0 V at 0.1 mV.s
-1 scan rate ... 149 Figure 4.16. Operando X-ray diffraction for the first lithiation of ZFO-1 between 0.01 V and 3.0 V at 5.6
mA.g-1 ... 150 Figure 4.17. Operando 57Fe Mössbauer spectra measured during the first one and a half cycle
(discharge/charge/discharge). The horizontal dotted lines represent the end of the different processes. The step between spectra 13 and 14 corresponds to the reduction of the velocity range from -14 − +14 to -4 − +4 mm/s. ... 151 Figure 4.18. Electrochemical signature of the operando cell and corresponding Mössbauer spectra.
The red line corresponds to a region where no spectra could be measured due to technical issues (between spectra #42 and #43). The velocity range was reduced starting from spectrum #14. . 152 Figure 4.19. Variance plot (top left), principal components (top right) and evolution of the scores
(bottom) during the first 13 Mössbauer spectra of the first discharge measured in the velocity range -14 − +14. ... 153 Figure 4.20. MCR-ALS components (left) and their evolution (right) during the first 13 Mössbauer
spectra of the first discharge measured in the velocity range -14 − +14 mm/s. ... 154 Figure 4.21. Variance plot (top left), principal components (top right) and evolution of the scores
(bottom) during the 101 Mössbauer spectra of the operando experiment measured in the
velocity range -4 − +4 mm/s. ... 155 Figure 4.22. MCR-ALS components (left) and their evolution (right) during the collection of the 101
Mössbauer spectra of the operando experiment measured in the velocity range -4 − +4 mm/s.156 Figure 4.23. MCR-ALS components (left) and their evolution (right) during the whole operando
Mössbauer experiment. ... 156 Figure 4.24. Fitting of the first component obtained by the MCR-ALS analysis of the first 13 Mössbauer
spectra of the first discharge measured in the velocity range -14 − +14 mm/s. ... 157 Figure 4.25. Fitting of the second (left) and the third (right) component obtained by the MCR-ALS
10 measured in the velocity range -4 − +4 mm/s (bottom). ... 158 Figure 4.26. Fitting of the second component obtained by the MCR-ALS analysis of the Mössbauer
spectra measured in the velocity range -4 − +4 mm/s. ... 160 Figure 4.27. Average oxidation state of the iron during cycling obtained from the weighted relative
resonance areas of the MCR-ALS components. ... 161 Figure 4.28. Galvanostatic cyclings at 100 mA.g-1 for ZnO, Fe
2O3 and ZnO/Fe2O3 mixture:
charge/discharge capacity plots (a, c, e) and cumulative irreversible capacity plots (b, d, f) ... 164 Figure 4.29. Charge/discharge profiles (a), dQ/dV curves (b, c) and polarization (d) for ZnO cycled at
100 mA.g-1 ... 166 Figure 4.30. Charge/discharge profiles (a), dQ/dV curves (b) and polarization (c) forFe2O3 cycled at
100 mA.g-1 ... 167 Figure 4.31. Charge/discharge profiles (a), dQ/dV curves (b, c) and polarization (d) for ZnO/Fe2O3
cycled at 100 mA.g-1 ... 168 Figure 4.32. Cyclic voltamograms for ZnO, Fe2O3, ZnO/Fe2O3 and ZnFe2O4 (ZFO-1) at a scan rate of 0.01
mV.s-1 ... 170 Figure 4.33. Operando XRD during the first lithiation of ZnO/Fe2O3 between 0.01 V and 3.0 V ... 172 Figure 5.1. Cycling of ZnFe2O4/C with different carbon ratios at 100 and 1000 mA.g-1 ... 182
Table 1.1. Electrochemical performances of some CoO anode for lithium-ion batteries ... 34
Table 1.2. Electrochemical performances of some Co3O4 anode for lithium-ion batteries ... 34
Table 1.3. Electrochemical performances of some Fe2O3 anode for lithium-ion batteries ... 35
Table 1.4. Electrochemical performances of some Fe3O4 anodes for lithium-ion batteries ... 36
Table 1.5. Theoretical capacity of several TMO and MTMO ... 37
Table 1.6. Experimental working voltages vs. Li/Li+ depending on the MTMO ... 38
Table 1.7. Electrochemical performances of various mixed-transition metal oxides ... 39
Table 1.8. Examples of ZnFe2O4 electrochemical performances as anode for lithium-ion batteries ... 43
Table 3.1. List of precursors solutions used for the synthesis of zinc iron oxide nanopowders ... 92
Table 3.2. Experimental conditions for the syntheses of ZFO-1 and ZFO-2 using nitrates solutions and the PALAS generator ... 93
Table 3.3. Experimental conditions for the syntheses of ZFO-3 and ZFO-4 under air using nitrates solutions ... 99
Table 3.4. Fitted parameters for Mössbauer measurements ... 102
Table 3.5. Experimental conditions for the syntheses of ZFO-5 and ZFO-6 under air using chlorides solutions ... 108
Table 3.6. Solutions of precursors used for the synthesis of iron oxide nanopowders ... 113
Table 3.7. Experimental conditions for the synthesis of FeOx-1 and FeOx-2 using a nitrate precursor solution ... 113
Table 3.8. Synthesis conditions for the production of FeOx-3 (chloride precursor) and FeOx-4 (acetylacetonate precursor)... 115
Table 3.9. Solutions of precursors used for the synthesis of ZnO nanoparticles ... 118
Table 3.10. Experimental conditions for the synthesis of ZnOx-1 and ZnOx-2 ... 118
Table 3.11. Summary of the different samples used for electrochemical tests ... 126
Table 4.1. Electrode formulations and electrolytes for coin cells preparation ... 130
Table 4.2. Performances of some ZnFe2O4 powders in the literature ... 143
Table 4.3. Hyperfine parameters obtained by the fitting of the second and third component obtained by the MCR-ALS analysis of the Mössbauer spectra measured in the velocity range - 14 − +14 mm/s, and of the first and third component obtained by the MCR-ALS analysis of the spectra measured in the velocity range -4 − +4 mm/s ... 160
13
AFS Aerosol Flame Synthesis
BET Brunauer-Emmett-Teller
CB Carbon black
CMC Carboxymethylcellulose
DMC Dimethyl carbonate
EC Ethylene carbonate
EDS Energy Dispersive X-ray Spectrometry
FASP Flame-Assisted Spray Pyrolysis
FSP Flame Spray Pyrolysis
GHG Greenhouse Gas
LIB Lithium-Ion Battery
MTMO Mixed-Transition Metal Oxide
Ni-Cd Nickel-Cadmium
NiMH Nickel-Metal Hydride
PC Polycarbonate
SEI Solid Electrolyte Interphase
SEM Scanning Electron Microscopy
(HR)TEM (High-Resolution) Transmission Electron Microscopy
TGA Thermo-Gravimetric Analysis
TMO Transition Metal Oxide
VFAFS Vapor-Fed Aerosol Flame Synthesis
VGCF Vapor-Grown Carbon Fiber
15
Introduction
Many scientific and technological progress have been realized since the industrial revolution in the 19th century. This progress has globally led to an increase in the energy demand with a massive growth from the middle of the 20th century. Since this period, the world energy consumption has never stopped its fast increase and with the continuous growth of the world population, ensuring everyone’s needs in energy becomes a real challenge1.
For several decades, more than 80% of the world produced energy has come from the combustion of fossil fuels as coal, oil and gas, the other 20% corresponding to alternative energies as nuclear power and renewable energies (only 1% attributed to wind and solar energy in 2012)2. Unfortunately, the massive exploitation of fossil fuels tends to be problematic in the near future.
Indeed, the known and accessible reserves of fossil fuels are predicted to be completely depleted in less than a century assuming that the global energy consumption stays stable in the next decades. Even if other non-exploited areas exist, their exploitation is generally more difficult and expensive and they are still limited. Moreover, the over exploitation of fossil fuels does not only have economic implications. The amount of greenhouse gases (GHG) in the atmosphere, and in particular CO2, has increased since the 1950’s, primarily because of the combustion of fossil fuels (Figure 1). According to the Intergovernmental Panel on Climate Change (IPCC), the increase of GHG in the atmosphere is very probably the main cause of the global warming observed since 1880 (+0.8°C on average according to NASA scientists)3.
16 Since the awareness of these issues by the international community, the Kyoto protocol was adopted in 1997 with the main objective to reduce by 5% the GHG emissions between 2008 and 2012, compared to the level in 19904. However, several scenarios have been predicted by scientists concerning the global warming, starting from an increase of the global temperature of 0.9°C for the most optimistic scenario and of 5.4°C for the most pessimistic one at the end of the 21st century. If the GHG emissions follow the same trend as today, an increase of the Earth surface temperature around 4°C is expected3. This climate change is already starting to disrupt the ecosystem: melting ice, rising of seas, vanishing of species, air pollution. Such consequences may have a large impact on populations in the near future with health problems as well as migrations due to the change of the environment.
In 2015, the Paris agreement was adopted by 195 countries with the main objective to limit the increase of the average Earth temperature up to 2°C. The United States Environmental Protection Agency data gives an idea of the contribution of each sector in GHG emissions coming from fossil fuel combustions for industrial countries (Figure 2). A large part of the fossil fuels consumption goes to electricity generation and transportation, making the quest of alternative energy sources in these two domains a major challenge to tackle5.
Figure 2. CO2 emissions from fossil fuel combustion by sector and fuel type (2006)5
In this context, the development of new systems for energy production based on the exploitation of solar or wind energy as well as the democratization of electric vehicles in place of combustion engines would limit our dependency on fossil fuels. However, solar and wind are
17 intermittent energy sources, thus the development of energy storage technologies is necessary6 (Figure 3). As well, efficient energy storage devices are needed for the development of electric transports.
Figure 3. Hourly supply and demand in energy6
One of the most common energy storage technologies used nowadays is the lithium-ion battery (LIB). This technology is well implemented for portable electronic devices but suffers from low energy density, safety, cost, cycle life and power density for next-generation large scale applications in electric vehicles and renewable energy storage applications. Advanced electrodes (anode/cathode) and electrolyte materials are necessary to address these challenges of LIB for next generation applications. Research worldwide is focussing on several aspects of improving the energy density of the cathode materials by moving towards higher voltages or newer modified materials. In this thesis we focus on the anode part of the LIB.
Presently, graphite is widely used anode for commercial LIB with a moderate specific capacity (372 mAh.g-1). The use of graphite induces safety issues due to its very low working voltage vs. Li/Li+ (0.15-0.25 V) that favours lithium plating at fast charging7. In addition, recent studies on high voltage cathode based on spinel LiNi0.5Mn1.5O4 and graphite have shown that the electrochemical behaviour of graphite when coupled with high voltage cathodes are not optimal8. Hence there is a need for alternative anode material that can in future replace graphite to address these challenges not only in terms of higher specific capacity (note: presently in terms of the specific capacity the cathode is the limiting factor in the cell) but also in terms of safety and moving towards newer high voltage cathodes.
18 Among various candidates, conversion-based materials, especially binary oxides (A3O4 and A2O3, A = transition metal), like Fe2O3 or Co3O4 have been the object of intense research for several years owing to their high theoretical capacity (between 800 and 1100 mAh.g-1). This high capacity is counterbalanced by a high working voltage vs. Li/Li+, interesting from a safety point of view to avoid lithium plating but that limits the energy density9 and requires the development of dedicated electrolytes and cathode materials to replace the ones used with graphite. This high capacity is also combined to a volumetric expansion of the material during lithiation leading to the pulverization of the electrode during long-term cycling10. Nevertheless, recent works about two ternary oxides like ZnFe2O4 or ZnCo2O4 show advantages compared to binary oxides. Indeed, these mixed-transition metal oxides offer the possibility to tune their working voltage11 by choosing their chemical composition while keeping high specific capacities.
Particularly, ZnFe2O4 delivers a high theoretical capacity of 1001 mAh.g-1 at a relatively low working voltage compared to other oxides (1.5 V vs. Li/Li+). Moreover, as a cheap, abundant, non-toxic and environment-friendly material, it is more interesting than other metal oxides Co-based ones for instance. To enhance the performances of the material and hinder the drawbacks of volumetric expansion in terms of electrode durability, it is interesting to address nanostructured electrodes using ZnFe2O4 nanoparticles. Indeed, a higher surface area and a smaller grain size provide more contact between the electrode material and the electrolyte and could also enable faster kinetics for lithium, while ensuring a better mechanical stability, as it will be detailed later. On the contrary, such increase of specific surface could also show deleterious effects by enhancing electrolyte degradation at the electrode surface. Thus the behaviour of nanostructured ZnFe2O4 electrodes appears worth studying in order to appreciate which of the beneficial or deleterious effects are predominant. Moreover, as ZnFe2O4 is known to be decomposed into ZnO and Fe2O3 after the first cycle12, a comparison between ZnFe2O4 and a mixture of ZnO and Fe2O3 remains to be achieved in order to highlight a potential advantage of the ternary phase.
To lead such a study, ZnFe2O4 nanoparticles, as well as ZnO and Fe2O3 ones, have to be synthesized. Laser pyrolysis is a versatile and up-scalable gas phase process that allows the one step, continuous production of crystalline nanoparticles with controlled chemical composition, size and morphologies. This process was used for the first time for the development of the materials reported in this document, and the synthesis part invests a large amount of the experimental work.
As a conclusion, this thesis is divided into two main parts. The first one deals with the development of the different required oxides nanomaterials by laser pyrolysis, while the second one is dedicated to the study of their performances for Li storage and to the related mechanisms. Beyond
19 the investigation of ZnFe2O4 by itself, the aim is to provide information about the interest of nanomaterials for battery application. As a consequence, the manuscript is presented with the following 4 chapters.
The first chapter is dedicated to the literature study and reviews first the state-of-art for lithium-ion batteries. It details the different categories of anode materials and more particularly the storage mechanisms and the performances of transition metal oxides (conventional or nanostructured) as well as their limitations. Different nanoparticles synthesis methods with their advantages and drawbacks are then presented in order to highlight the interest of laser pyrolysis.
The experimental details and protocols are presented in chapter 2. More specifically, the laser pyrolysis process is explained in details. The different techniques, samples preparation and analysis protocols for the structural characterizations of the produced nanopowders as well as for the evaluation of their electrochemical properties and performances are then described.
The different ternary and binary oxide nanopowders samples obtained by laser pyrolysis are presented in chapter 3. The influence of the experimental parameters (nature of the carrier gas, solvent, precursors) on the produced powders in terms of crystallinity and morphology are discussed in this part. The main structural characteristics are given for each sample in order to enable the selection of the most interesting ones for the electrochemical study to be reported in chapter 4.
The fourth and last chapter is dedicated to the electrochemical performances of the chapter 3 selected samples in half cells vs. metallic lithium and to the investigation of the lithium storage mechanisms. In particular, the influence of the morphology on the electrochemical performances of ZnFe2O4 is studied. These performances are also compared to a mixture of ZnO and Fe2O3 nanopowders and the reactions involved during the lithiation and delithiation processes are investigated thanks to operando measurements as X-ray diffraction and 57Fe Mössbauer spectroscopy.
The obtained results are then summarized in the conclusion in order to highlight the main information gained in this work on nanostructured ternary oxides, and to give the perspectives for further studies on these compounds.
References
20 2 Https://www.giss.nasa.gov/research/news/20130115/, .
3 R. K. Pachauri and L. A. Meyer, IPCC, 2014: Climate Change 2014 Synthesis Report, IPCC, Geneva, Switzerland, 2014.
4 http://unfccc.int/resource/docs/convkp/kpeng.pdf.
5 O. Edenhofer, R. Pichs-Madruga and Y. Sokona, IPCC, 2014: Climate Change 2014: Mitigation of
Climate Change., Cambridge University Press, Cambridge, United Kingdom and New York, NY,
USA, 2014.
6 Http://ieer.org/wp/wp-content/uploads/2012/03/MN-factsheet.pdf, http://ieer.org/wp/wp-content/uploads/2012/03/MN-factsheet.pdf.
7 A. B. Yaroslavtsev, T. L. Kulova and A. M. Skundin, Russ. Chem. Rev., 2015, 84, 826–852.
8 L. Boulet-Roblin, P. Borel, D. Sheptyakov, C. Tessier, P. Novák and C. Villevieille, J. Phys. Chem.
C, 2016, 120, 17268–17273.
9 C. Yuan, H. Bin Wu, Y. Xie and X. W. D. Lou, Angew. Chem. Int. Ed. Engl., 2014, 53, 1488–1504. 10 H. Bin Wu, J. S. Chen, H. H. Hng and X. W. D. Lou, Nanoscale, 2012, 4, 2526–2542.
11 J. Cabana, L. Monconduit, D. Larcher and M. R. Palacín, Adv. Mater., 2010, 22, E170--92.
12 P. F. Teh, S. S. Pramana, C. Kim, C.-M. Chen, C.-H. Chuang, Y. Sharma, J. Cabana and S. Madhavi,
The first chapter is dedicated to the introduction of the study context and provides information to understand the interest of this work. Presentation of the lithium-ion battery technology is addressed in the first part underlining its advantages and challenges that need to be addressed; the next part details the characteristics of transition metal oxides and explains why these materials were chosen as the subject of interest in this work. Various synthesis methods for transition metal oxides elaboration are then presented in the third part with eventual focus on CO2 laser pyrolysis technique that was used in this work in the last part.
22
I.
Presentation of the lithium-ion technology
1. History and basic principles of the lithium-ion battery
While primary batteries (or non-rechargeable batteries) are based on an irreversible redox reaction that allows a one and only use of the device, rechargeable (or secondary) batteries work thanks to a reversible redox reaction that allows several charge/discharge cycles. The first rechargeable battery (the lead-acid technology) was invented in 1859 by the French physicist Gaston Planté. Different types of rechargeable batteries were then developed during the 20th century. The most significant ones are the nickel-cadmium batteries (Ni-Cd)1, the nickel-metal hydride (NiMH)2 batteries, and most particularly the lithium-ion technologies (LIB) that will be addressed in this work and will be presented in the following part.
A battery consists of two electrochemically active couples. The positive electrode corresponds to the redox couple with the higher potential and the negative electrode to the one with the lower potential. A separator impregnated with electrolyte is placed between the two electrodes; the electrolyte is electronically insulating but allows ions circulation during the redox reactions. Generally, for lithium-ion batteries, the electrolyte consists in an organic liquid solvent (most of the time, carbonates) in which a lithium salt (often LiPF6) is dissolved to ensure the ionic conductivity. Discharge occurs with ions transferred from the negative electrode to the positive one through the electrolyte. Electroneutrality is kept with electrons transported in the same direction through the external circuit. To ensure a fast transportation of the electrons into the electrode material, this latter has to be electronically conductive. For rechargeable batteries, the reverse reaction occurs by applying an external current thus leading to the charge of the battery, with ions and electrons being transferred from the positive to the negative electrode (Figure 1.1).
23
Figure 1.1. Schematic diagram of (a) a redox reaction, (b) a primary (non-rechargeable) battery upon discharging and (c) a secondary (rechargeable) battery upon charging3
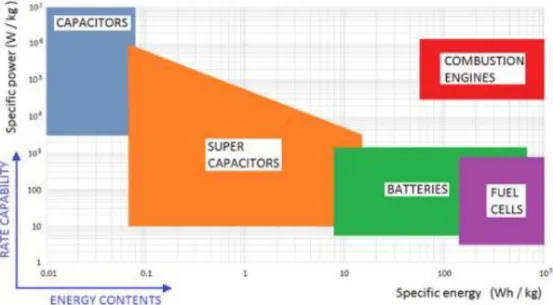
The voltage of a battery corresponds to the difference between the positive and negative electrode potentials. The battery voltage is maximized by having a low working voltage vs. Li/Li+ for the negative electrode and a high working voltage vs. Li/Li+ for the positive electrode. Each electrode material has its own specific capacity (in mAh.g-1) corresponding to the number of charge the material can store. For a specific application, the energy density and the power are the two main criteria to be taken into account when choosing the proper battery. The energy density (in Wh.kg-1) that can be delivered by a battery directly depends on the battery voltage and on the specific capacities of both electrodes (Energy density = Specific capacity * voltage): the higher they are, the higher the energy density is. The power density (in W.kg-1) corresponds to how fast this energy can be extracted from the battery. This power depends on the diffusion of the conductive species (ions and electrons) into the anode and cathode materials as well as in the electrolyte. The faster the diffusion of these species is, the higher the battery power is. Lithium-ion batteries are generally considered as a good compromise in terms of energy and power densities compared to fuel cells (higher energy density but lower power density) and supercapacitors (lower energy density but higher power density) (Figure 1.2).
24
Figure 1.2. Comparison of the energy and power densities for different energy storage technologies4
Each new generation of batteries is associated to an improvement in terms of energy density to obtain a lighter and smaller battery delivering the same energy (Figure 1.3). Although lead-acid batteries are the oldest type of rechargeable devices, they are still commonly used in combustion vehicles whereas Ni-Cd and NiMH batteries remain the most suitable technologies for high-power applications5.
Figure 1.3. Different technologies of batteries with their gravimetric and volumetric energy density6
Lithium started to generate interest in the 1970’s when its reversible intercalation in materials like TiS27 and MoS28 was discovered by Whittingham. Lithium metal batteries were then used in the 1980’s for mobile devices due to a higher energy density when compared to lead-acid and Ni-Cd
25 batteries. However, the development of this technology was abruptly stopped when safety issues occurred. Indeed for first lithium batteries, the anode was made of metallic lithium and the cathode works as a lithium host. During the discharge, lithium ions are inserted into the positive electrode and upon charge, the reverse reaction occurs. Unfortunately, the uneven deposition of the lithium onto the anode surface results in the formation of dendrites5(Figure 1.4).
Figure 1.4. Rechargeable Li-metal battery (the picture of the dendrite growth at the Li surface was obtained directly from in-situ scanning electron microscopy measurements)5
These dendrites grow continuously during cyclings, eventually penetrating the separator and creating a short circuit between the anode and cathode together9. This uncontrolled phenomena can lead to overheating, leakage of electrolyte and Li exposure to air: fires or explosions of the battery were then experienced by users.
To avoid this safety issue, research works were conducted to find alternatives to the use of lithium metal. The substitution of metallic lithium by a second lithium host was proposed and developed by D.W Murphy10 and B. Scrosati11 in 1980 and led to the lithium-ion technology or the so-called rocking-chair battery. In this case, during charge, lithium ions are extracted from the cathode and inserted into the anode and during discharge the reverse reaction takes place reversibly. The presence of lithium only in its ionic state rather than its metallic state limits the dendrites growth. Nevertheless, safety of Li-ion batteries remains a challenge to be addressed today.
The first generation of lithium-ion batteries (LIB) were commercialized by Sony in 199012 that stored more than twice the energy as compared to nickel and lead-acid batteries of same weight and size. The cathode material in LIB consists of LiCoO2 coupled with a graphite anode with the battery working through reversible Li-intercalation/deintercalation reactions13. During the lithiation of the anode (charge), lithium ions are inserted from the positive to the negative electrode across the electrolyte and intercalated between the graphite layers. During the discharge process (delithiation of the negative electrode), the opposite reaction occurs with lithium ions transferring back to the positive electrode as follows (Figure 1.5).
26 On the negative electrode: C6 + xe- + xLi+ = LixC6
On the positive electrode: LiCoO2 = xLi+ + xe- + Li1-xCoO2
To evaluate the reversibility of the storage reaction, the coulombic efficiency is generally calculated. This value corresponds to the ratio between the delithiated capacity and the lithiated capacity. The coulombic efficiency is expected to be as close as possible to 100% meaning that the reaction is totally reversible.
Figure 1.5. Charge/discharge process for a commercial lithium-ion battery14
The energy density of a modern LIB is between 150 and 190 Wh.kg-1. The LiCoO
2 cathode material has a theoretical capacity of 240 mAh.g-1 while the graphite anode shows a higher theoretical capacity of 372 mAh.g-1. However, in practice, the obtained capacities are lower: 140 mAh.g-1 for LiCoO2 (due to the formation of unstable cobalt dioxide during charging) and 320 mAh.g-1 for graphite. A commercial LIB possesses a voltage from 3.0 V to 4.0 V owing to the high working voltage of lithium cobaltite (3.7 V to 4.0 V vs. Li/Li+) and the low working voltage of graphite (0.15-0.25 V vs. Li/Li+)15. Nevertheless, due to this low working voltage, graphite experiences lithium plating during fast charging that can cause severe safety problems due to lithium dendrites formation. Moreover, this lithium deposition on graphite causes capacity fading due to the loss of active lithium16.
Even if these LIB allowed the democratization of portable electronics, this technology is still the object of intense research to enhance performances for next-generation applications such as electric vehicles and renewable energy storage. It is necessary to get batteries with a higher energy density and a longer cycle life while keeping high safety requirements, as well as prices and environmental impact as low as possible. To obtain high performance Li batteries in the future,
27 intense research and development work has thus to be done on both cathode and anode material to study new charge storage mechanisms and to increase energy/power density and safety. LiCoO2, but also Li(Ni,Mn,Co)O2 and Li(Ni,Co,Al)O2, the most common cathode materials used in commercial batteries, are today the most limiting issues in terms of capacity (140 to 180 mAh.g-1) compared to graphite anode. Moreover, these materials are partially constituted by cobalt, an expensive and toxic metal. On the other side, the graphite anode shows higher capacity with a good cycling stability. Nevertheless, this capacity is still relatively low when compared to other potential anode materials that will be described later with capacities over 1000 mAh.g-1. Moreover, as mentioned before, working potential of graphite vs Li/Li+ tends to favor Li plating and thus enhances safety concerns for commercial Li batteries. In this context, this work focusses on the search of an alternative anode material demonstrating higher capacity and higher working voltage vs Li/Li+ than graphite.
Many research works today are devoted to new anode materials which can be classified in three main categories based on the interaction of lithium: (i) intercalation materials, (ii) alloying materials and (iii) conversion materials. These categories will be described now.
2. Categories of anode materials depending on the lithium storage mechanism
Three categories of anode materials have been defined depending on the lithium storage mechanism during charge and discharge processes. Each category of materials has its own advantages and drawbacks.
Intercalation (or insertion) materials
For intercalation materials, lithium is inserted into the host without any modification of its crystalline structure. The most common intercalation material is graphite, that can store one lithium ion for six carbon atoms leading to a theoretical capacity of 372 mAh.g-1 owing to its lamellar structure (Figure 1.6). Moreover, graphite has the combined properties of low cost, abundant availability and high electrical conductivity (105 S/m)17,18. Although graphite presents a very low working voltage versus Li/Li+, and higher specific capacity than cathode material (~140-170 mAh.g-1), safety issues at fast charging due to Li plating, and the thrust towards future LIB large scale applications like electric vehicles requires higher specific capacity material both on the cathode and anode side.
28
Figure 1.6. Insertion of lithium ions between graphite layers19
. Research works on new materials with higher theoretical capacity like graphene20 (780 to 1100 mAh.g-1) or carbon nanotubes21 (1100 mAh.g-1) have been conducted; however, these materials suffer from high production cost as well as high irreversible consumption of Li upon cycling (i.e. low coulombic efficiency) leading to poor cycle life.
In addition to layered sulfides such as TiS2 and MoS2 previously mentioned (page 24) , another example of intercalation material is the spinel-structured Li4Ti5O12 whose storage mechanism is described below.
3Li+ + Li
4Ti5O12 + 3e- ↔ Li7Ti5O12
This material suffers from a low theoretical specific capacity (175 mAh.g-1) and a high working voltage (1.55V vs Li/Li+) leading to an energy density much lower than graphite but also has a very good cyclability especially at high currents, making this material useful for power applications9.
Due to the non-destruction of the material structure upon Li insertion, intercalation materials are known as very stable anode materials. However, they still show a limited theoretical capacity for next-generation batteries.
Alloying materials
Another lithium storage mechanism was discovered by Dey et al. who demonstrated that some metallic and semi-metallic elements (like Si, Sn, Ge, Mg) are able to reversibly form an alloy with lithium at low potential during the lithiation of the anode22. During the delithiation process, the de-alloying reaction occurs leading to the reformation of the metal or semi-metal. A typical de- alloying/de-alloying reaction is shown below:
xLi+ + yM + xe- ↔ Li
xMy (M=metal or semi-metal)
Alloying materials generally offer a higher theoretical capacity than intercalation materials as more lithium can be inserted into the material. Several materials have been studied in the literature
29 (Figure 1.7) like tin, antimony and germanium but the most promising one seems to be silicon thanks to an outstanding theoretical specific capacity allowed by the potential formation of the Li rich Li4,4Si phase (4200 mAh.g-1, more than ten times higher than graphite), and to a relatively low working voltage of 0.4 V vs. Li/Li+ compared to other alloying materials23. Nevertheless, this theoretical capacity has been reported only at high temperature (> 100°C) in experimental works. At ambient temperature, silicon is known to have a capacity around 3580 mAh.g-1 due to the formation of the Li15Si4 phase24.
Figure 1.7. Examples of alloying materials and their theoretical capacity12
In spite of very high specific capacities, alloying materials are reported to have a very poor capacity retention due to a dramatically high volume expansion during the alloying reaction. For example, Li4,4Si phase leads to a 400% lattice expansion during the alloy formation25. This creates mechanical stresses and cracks in the host material leading to the progressive destruction of the negative electrode after few charge-discharge cycles. In addition, silicon is subject to the formation of an unstable solid electrolyte interphase (SEI) on the surface of the electrode. This SEI that is also formed with other anode materials categories comes from degradation reactions of the electrolyte at the electrode/electrolyte interface, at low potential and consumes irreversibly part of the lithium ions during the lithiation process. For a graphite electrode, a stable SEI is formed at the first cycle which acts as a passivation layer, avoiding further reactions on the electrode surface26. For silicon, due to the volumetric expansion/reduction of the material during charge/discharge process, the SEI is broken
30 and reformed continuously, trapping more and more lithium during cycling, explaining the relatively low coulombic efficiency reported for this material (Figure 1.8)27.
Figure 1.8. SEI formation on silicon surface during lithiation and delithiation process27
These drawbacks still hinder alloy/dealloy-based anodes from commercialization, but intensive research work is still going on improving Si-based electrodes stability. In particular, the nanostructuration of silicon is studied by many researchers to limit the volumetric modifications, together with the coating of the Si surface by carbon in order to increase the electrode stability upon cycling28,29.
Conversion materials
In the past decade, a new lithium storage mechanism has been identified for some transition metal oxides (TMO), named conversion reaction30. Even if this reaction mechanism has also been observed for metal nitrides, sulphides, fluorides and phosphides, we will focus on transition metal oxides as they generally show a better reversibility and stability and very good capacities (generally situated between 750 mAh.g-1 and 1200 mAh.g-1)31. As this latter category is directly addressed in the experimental part of this document, the mechanisms governing Li insertion in such materials will be more specifically detailed in what follows.
For conversion materials, the storage mechanism is based on a reversible redox reaction between lithium and transition metal cations:
MxOn + 2n Li+ + 2n e- ↔ x M + n Li2O (with M=Co, Fe, Cu, Ni…).
The first lithiation of the TMO starts with the insertion of lithium into the crystalline structure of MxOn, followed by an irreversible amorphization process and the reduction of the metal oxide to form an M/Li2O nanocomposite. This nanocomposite consists in metallic nanoparticles of few nanometers in diameter embedded in an amorphous Li2O matrix32,33. The high surface area of the metallic nanograins fosters the intimate contact with the Li2O matrix that enhances the electrochemical reactivity during the following cycles34.
31 Figure 1.9 is an example of a typical lithiation process for Co3O4 with the different steps of the first discharge35. Several intermediate products are identified prior to the formation of Li
2O with Co nanoparticles, as a lithium-inserted Co3O4 phase and nanosized Co-Li-O clusters.
Figure 1.9. In-situ HREM of lithiation of Co3O4 showing the insertion, amorphization and reduction processes35
Moreover, for transition metal oxides, a thin polymeric gel-type layer is formed around the metallic nanoparticles due to the electrolyte decomposition after a deep discharge, serving as an envelope to maintain contact between the metallic nanoparticles36. This polymeric layer stores part of the lithium during the lithiation, but on the contrary of SEI, this storage was found to be reversible. Moreover, the formation of this layer seems to be catalyzed by the presence of the nanoparticles37. During the following charge, oxidation of the metallic nanoparticles occurs and Li2O is decomposed, leading to the re-formation of the metal oxide. It should be noted that the initial crystallinity of the transition metal oxide cannot be resumed, this latter being replaced by an amorphous structure.
The capacity of TMO can be calculated thanks to the Faraday’s law as follows: 𝑄 = 2𝑛𝐹𝑁
Q: capacity (Ah)
2n: number of lithium ions transferred n: number of oxygen in MxOn
F: Faraday’s constant (96500 C.mol-1 or 26800 mAh.mol-1) N: number of mole of reacting species.
Based on this formula, the theoretical specific capacity (noted C), can be calculated using the following equation38:
𝐶 (𝑚𝐴ℎ. 𝑔−1) = 𝑄
𝑚(𝑜𝑥𝑖𝑑𝑒)=
26800 × 𝑛 𝑀(𝑜𝑥𝑖𝑑𝑒)