The influence of design aesthetics and user state in usability testing
Juergen Sauer* and Andreas Sonderegger
Department of Psychology, University of Fribourg, Rue de Faucigny 2, CH-1700 Fribourg, Switzerland
Abstract
An empirical study examined the effects of two influencing factors in usability tests on user performance and usability ratings. Aesthetics of design (high vs. low) as the main
independent factor and prior usage event (positive vs. negative) as a subsidiary independent factor were varied in a between-participants design. 60 participants took part in the
experiment, completing a number of typical tasks of mobile phone users. The results showed that increased product aesthetics had a positive effect on perceived usability and led to longer task completion times. After a negative usage event had been experimentally induced, usability ratings dropped as expected but user performance on subsequent tasks remained unaffected. An important implication of the study is that the aesthetic properties of a product may have multiple effects that go beyond perceived product attractiveness.
Key words: usability test; performance; aesthetics;
1. Introduction 1.1 Usability testing
The practice of usability testing becomes increasingly widespread in the design of products (e.g., Lewis, 2006). It aims to assess the usability of a technical artefact by determining the effectiveness, efficiency and satisfaction with which users achieve task goals in a given environment. Usability testing represents a very useful method to identify shortcomings in design before the consumer product is being launched onto the market. While there is little argument about the general usefulness of usability tests (as opposed to not carrying out a usability test at all), it is less clear what can be done to
*
Corresponding author. Phone: +41-26-3007622; Fax: +41-26-3009712; Email: juergen.sauer@unifr.ch
increase their effectiveness. Therefore, it would be important to know what the factors are that influence test outcomes and what the nature of the influence is.
The Four-Factor Framework of Contextual Fidelity may provide a useful framework for identifying these factors (Sauer, Seibel & Rüttinger, in press). The term contextual fidelity refers to the context in which a usability test takes place and to what extent it is similar to the context of future product utilisation. The framework proposes four main factors that describe the chief determinants of usability test outcomes: prototype of system, user characteristics, task, and testing environment. The factors described in the framework stemmed from several sources, such as previous models that addressed the issue of fidelity in usability testing (e.g. Virzi et al., 1996; Nilsson and Siponen, 2005) and issues of general concern in the usability literature (e.g. user
competencies), Each of these main factors consists of a number of subordinate factors (a detailed account of the framework may be found in Sauer, Seibel & Rüttinger, in press). Two of these issues were examined in the present article: aesthetic features of the technical system and state of the user.
1.2 Aesthetics in product design
In the research literature, we find a number of concepts that refer to the exterior
properties of a product and how users respond to it, such as aesthetics, appearance, and attractiveness (e.g., Hekkert et al., 2003; Chang et al., 2007). The use of these concepts differs considerably across research communities. For example, Hekkert et al. (2003) have identified novelty and typicality as subfactors of aesthetics. This refers to the user’s degree of familiarity with the product (novelty) and the representativeness of the object for a class of objects (typicality). Lavie and Tractinsky (2004) have made a distinction between classical and expressive aesthetics (i.e. traditional form of orderly and clear design vs. original and creative designs). Crilly et al. (2004) even employ the term aesthetics to refer to the user’s response to the appearance of the product. In the present study, the term design aesthetics is employed to refer to the visual appearance of a product (i.e. independent variable), following criteria such as symmetry, colour, texture, and clarity (Ngo, Teo, and Bryne, 2003; Postrel, 2003). In contrast, the users’ response to these product properties is referred to as perceived attractiveness (i.e. dependent
variable).
It has long been known that appearance plays an important role in the process of decision-making and evaluation (Dion et al., 1972). This work showed that physically more appealing humans were also considered to be more competent and occupationally more successful. This kind of halo effect of easily discernable attributes influencing the evaluation of other characteristics of the person was also observed in areas in which technical artefacts had to be judged. Empirical work using computer-simulated cash machines suggests that users considered the more attractive interface also to be more usable (Kurosu and Kashimura, 1995; Tractinsky, 1997). While in these studies no interaction of the user with the product took place, another study of Tractinsky et al. (2000) using also a computer simulation of a cash machine found that even following intensive user-product interaction (involving the completion of 11 tasks), the same positive relationship between aesthetics and perceived usability was observed. Similar findings were recorded in a study in which users operated computer-simulated mobile
phones (Sauer and Sonderegger, 2009). However, in these studies the aesthetic design was confounded with at least one functional aspect. For example, the keys of a cash machine were arranged in different ways (telephone layout vs. horizontal arrangement as on a computer keyboard; Tractinsky et al., 2000) and the two mobile phones used
differed slightly in their menu-structure (Sauer and Sonderegger, 2009). Therefore, it cannot be completely excluded that differences in usability ratings as a function of aesthetics were to some extent influenced by minor functional differences.
In addition to the relationship between aesthetics and perceived usability, the influence of aesthetics on objective usability criteria (i.e. user performance) is of interest. We found five studies in the research literature that measured user performance as a function of aesthetics. In two of them, no effects of aesthetics were observed. In these studies users operated a cash machine (Tractinsky et al., 2000) and an MP3 player (Thüring and Mahlke, 2007). Two other studies found decreased performance for the more attractive product. This was observed for data entry software (Ben-Bassat et al., 2006) and mobile phone operation (Sauer and Sonderegger, 2009). One study found a positive effect of aesthetics on performance for mobile phone use in a school context (Sonderegger & Sauer, under review). However, in four of the studies reported, there was no experimental manipulation of aesthetics or, if there was, the manipulation of aesthetics was accompanied by minor functional differences. Therefore, an unequivocal cause-effect relationship between aesthetics and performance cannot be established. While the fifth study (i.e. Thüring and Mahlke, 2007) did employ an adequate experimental manipulation, it used a computer simulation of the mobile phone rather than making use of a 3-dimensional fully operational product (like most other studies referred to above which did not use a real product). It is therefore important to examine the influence of aesthetics in usability tests with a fully operational product. This is because previous work suggests that the influence of aesthetics on user performance in usability test may also depend on the kind of prototype (e.g. paper prototype, computer simulation, real product) being used (Sauer and Sonderegger, 2009). Other work also reported different outcomes in usability testing as a function of prototype fidelity (Nielsen, 1990; Hall, 1999; Sauer et al., 2008).
Examining these factors from a theoretical perspective, one may assume an influence of product aesthetics on user performance in two different directions
(Sonderegger & Sauer, under review). First, one may envisage a ‘prolongation of joyful experience’-effect, which is characterised by decreased user performance. This is because the user enjoys the aesthetic appeal of the product and therefore does not give a high priority to efficiency in task completion. Since users may wish to increase the time of operating the product, longer task completion times may ensue. Second, one may envisage an ‘increased motivation’-effect. Characterised by increments in performance, this effect may occur because the aesthetically appealing product may put the user at ease (Lindgaard, 2007) or may put the user ‘in flow’ (Csíkszentmihályi, 1997). This effect may result in shorter task completion times. Which one of the two effects occurs is currently not easy to predict, as it may be moderated by contextual factors (e.g., work vs. leisure orientation) or characteristics of the test user (e.g., mood, personality or user state).
Overall, the review of the research literature has revealed considerable evidence that aesthetics has a positive relationship with perceived usability whereas the
relationship between aesthetics and user performance appears to be rather inconsistent, requiring more research to determine the influence of contextual factors.
1.3 User state
Next to aesthetics as a feature of the prototype being used, the current state of the user also represents an influencing factor in usability testing. User states refer to constantly changing user characteristics (e.g., fatigue, task engagement). In work environments, the state of the operator is considered to be an important factor that determines overall human-machine system performance (e.g., Hockey, 1997). As there is evidence from the work context that operator states have an impact (Hockey, 1997), user states are also expected to influence the outcomes of usability tests. Users may vary in their state when arriving for the testing session (i.e. representing an unsystematic influence) and, perhaps more importantly, their state may also change during the testing session (i.e. representing a systematic influence of the testing procedure). Factors that may change the user state in a usability test include prolonged testing sessions (e.g., leading to fatigue), intimidating test environments (e.g., leading to increased anxiety), and prototypes with considerable usability deficiencies (e.g., leading to frustration, decreased effort or perceived
incompetence). In the early stages of the product design cycle, the occurrence of task completion failures may be particularly frequent (e.g., paper prototypes with considerable usability deficiencies). A failure to complete the task may be considered a negative usage event which may be attributed internally (i.e. incompetence of the user) rather than externally (i.e. poor product design). This may lead to changes in the psychological state of the user, such as affecting mood or self-efficacy (Jones et al., 2005). These changes might emerge despite the best attempts of the test facilitator to emphasise that it is the product that is being evaluated and not the user. For example, studies in human-computer interaction have shown that users often feel frustrated during and after product operation (Klein et al., 2002; Partala and Surakka, 2004; Picard and Klein, 2002). Such feelings of frustration may have negative consequences such as decreased attention and impaired productivity. Overall, the influence of such changes in user state on performance and other outcome variables of usability tests are not very well researched.
1.4 The present study
The primary research question examined the influence of aesthetics on main outcome variables of usability tests, such as user performance and perceived usability. This is done by comparing two products that differ in their aesthetic appeal but are identical in all other system features. The mobile phone was selected as a model product because for this kind of product it is not merely functionality and usability that are of relevance but also aesthetic design. The experimental manipulation of the aesthetics of functionally identical phones while employing a fully operational prototype has not yet been examined in the research literature.
A subsidiary research question concerned the impact of user state on performance and perceived usability was examined on an exploratory basis. This was examined by manipulating the success of task completion by means of an impossible task, which is expected to be experienced as a negative usage event by the user. Of particular interest
was whether any effects of such a usage event would interact with the aesthetic quality of the product (e.g., a negative usage event will affect perceived usability more strongly for the aesthetically less appealing product than for the more appealing one).
The following predictions were made: (a) Perceived usability will be higher for the aesthetically more pleasing product than for the less pleasing one. (b) This difference in perceived usability will remain stable across the different phases of the usability test (i.e. before and after task completion), that is, there will be no interaction between aesthetics and phase of usability test. (c) With regard to the effects of aesthetics on
performance no prediction was made since the literature is rather equivocal about it. (d) A negative usage event will reduce perceived usability and degrade user performance on subsequent tasks.
2. Method 2.1 Participants
Sixty participants (41.7 % female), aged between 19 and 36 yrs (M = 24.1 yrs), took part in the study. All of them were students of the University of Fribourg. They were regular users of a mobile phone but none of them had operated the type of phone before that was going to be used in the study.
2.2 Experimental design
The experiment employed a 2 x 2 between-participants design, with aesthetics of design and prior usage event as independent variables. Participants were randomly assigned to a group using a mobile phone with an aesthetically appealing design or a group employing an aesthetically unappealing design. Half of the participants in each group were given a task to induce a positive experience of user-product interaction (i.e. successful task completion) while the other half completed a task that was designed to produce a negative experience (i.e. task completion failed).
2.3 Measures and instruments 2.3.1 Perceived usability
An overall measurement of perceived usability was taken by a one-item scale (‘This mobile phone is usable’), presented to the participants on three occasions throughout the testing procedure (prior to the usability test, during the course of the usability test, and following the usability test). The item used a 7-point Likert scale as a response format (strongly agree, agree, partly agree, neither agree nor disagree, partly disagree, disagree, strongly disagree). Using this short scale was considered to be advantageous to ensure that participant motivation was maintained during a prolonged testing session, involving repeated measurements. A similar approach has also been adopted by Tractinsky et al. (2000). The use of a single-item measure is justifiable if the item is unambiguous and captures the main concept (Wanous et al., 1997; Christophersen & Konradt, under review).
In addition to using the one-item scale for measuring changes over time, a modified version of the Post-Study System Usability Questionnaire (PSSUQ; Lewis, 2002) was administered once to control for the suitability of the one-item scale. The PSSUQ represents a standard instrument to measure perceived usability, comprising three subscales (see table 1). For the purpose of this study, the questionnaire was translated into German. Originally designed for the application field computer software, four items removed from the PSSUQ since they were not relevant for mobile phone usage. The remaining items are presented in table 1. Some of the remaining items were slightly modified to make them sound more relevant to the model product (e.g., ‘system’ were replaced by ‘mobile phone’). The psychometric properties of the original version of the PSSUQ are very good, with an overall Cronbach’s alpha of .97 for the overall scale and similarly good coefficients for the different subscales: system usefulness (α = .96), information quality (α = .91), interface quality (α = .91; Lewis, 1995). The alpha coefficients for the modified scale were slightly smaller (probably due to the reduced number of items) but still satisfactory: overall scale (α = .90), system usefulness (α = .88), and information quality (α = .74). The alpha coefficient for interface quality could not be calculated on the basis of two items.
Table 1: Modified version of Post-Study System Usability Questionnaire (Lewis, 2002) Subscale ‘System usefulness’
Overall, I am satisfied with how easy it is to use this mobile phone. It was simple to use this mobile phone.
I was able to complete the tasks and scenarios quickly using this mobile phone.
I felt comfortable using this mobile phone. It was easy to learn to use this mobile phone.
I believe I could become productive quickly using this mobile phone. Subscale ‘Information quality’
The mobile phone gave error messages that clearly told me how to fix problems.
Whenever I made a mistake using the mobile phone, I could recover easily and quickly.
The information provided by this mobile phone was clear. It was easy to find the information I needed.
The information was effective in helping me complete the tasks and scenarios.
The organization of information on the mobile phone’s display was clear.
Subscale ‘Interface quality’
The interface of this mobile phone was pleasant. I liked using the interface of this mobile phone. Overall satisfaction
2.3.2 Product attractiveness
As a manipulation check, the attractiveness of the appliance was measured by a one-item scale (‘The design of the mobile phone is attractive’), using a 7-point Likert scale as a response format (strongly agree, agree, partly agree, neither agree nor disagree, partly disagree, disagree, strongly disagree). While it is acknowledged that product aesthetics may be considered a multi-facetted construct (e.g., Leder et al., 2004), the main goal in the present study was to gain an overall assessment of how attractive the product was perceived rather than providing a fine-grained analysis of subtle effects of sub-facets of aesthetics (e.g., innovativeness, expressiveness). The advantages of using a one-item scale have already been pointed out above (see 2.3.1). This single-item measure serving as a manipulation check was already used in previous studies (Sonderegger and Sauer, in press; Sauer and Sonderegger, 2009).
2.3.3 User performance
Two measures of user performance were recorded: Task completion time (s) measured the time needed to accomplish each task. Interaction efficiency was a composite measure, dividing the optimal number of user inputs by the actual number of user inputs.
2.4 Materials
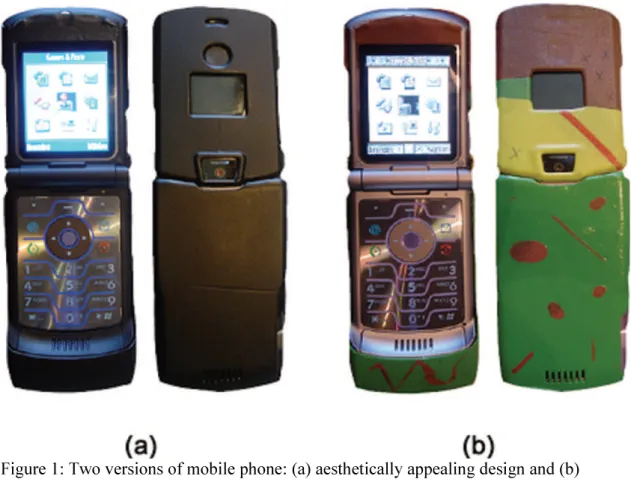
Two versions of the same mobile phone (Motorola RAZR V3i) were used in the study. The appliance was launched onto the market in the year 2006. At the time of the
completion of the study, this appliance was new on the market, which had the advantage of the appliance being hardly known among prospective participants.
The rationale for creating an aesthetically appealing and an aesthetically
unappealing version of a functionally identical mobile phone was based on findings from previous research, which identified a number of facets of object attractiveness, such as being symmetrical and clear (Lavie and Tractinsky, 2004). Since most mobile phones have rather an aesthetically appealing design (and this one was no exception), the goal was to make the design aesthetically sufficiently unappealing without creating an unrealistic design (i.e. one that would not gain acceptance by users because it does not look like a real phone). The main means to make the design aesthetically unappealing was to use asymmetrical and unclear patterns as well as to employ less appealing colours. This was achieved by attaching masking tape in brown, green and yellow colours to the case of the aesthetically less appealing mobile phone. In contrast, the aesthetically appealing phone had black masking tape attached to it. Furthermore, the skin of the computerised interface was varied. The skin ‘diamond’ comprising different shades of grey was chosen for the low aesthetics condition while the full-colour skin ‘moto’ was selected for the high aesthetics condition. To prevent an influence of the brand name on user ratings, the make ‘Motorola’ was covered by masking tape in both experimental conditions.
2.5 Pilot study
In a pilot study, various options of manipulating the aesthetic appeal of the appliance were tested. Ten participants (aged between 19 and 25 yrs) were to evaluate the
attractiveness of different designs. Two designs were consistently rated as highly attractive and unattractive, respectively (M = 8.4, SD = 1.1 vs. M = 1.8 SD = 0.6 on a scale ranging from 1 to 10). The two designs are displayed in figure 1.
Figure 1: Two versions of mobile phone: (a) aesthetically appealing design and (b) aesthetically unappealing design
2.6 Experimental tasks
For the experimental trial, three tasks were presented to the participant. The first
represented the experimental manipulation task and differed in the two conditions of prior usage event. In negative usage event condition, it was an impossible task with a 100 % failure rate (‘Switch on the radio!’), which was aborted by the experimenter after 5 min if the participant had not given up before. In the positive usage event condition, it
represented a very simple task with a 100 % success rate (‘The phone number of Bruno is stored. Give him a call!’)). This followed by two further experimental tasks, which allowed the measurement of various parameters of user performance: (a) sending a prepared text message to another phone user and (b) suppressing the user’s phone number when making a call.
2.7 Procedure
The experiment was carried out in a usability laboratory at the University of Fribourg. Before taking part in the experiment, it was checked whether participants had any experience of using the particular appliance (if that was the case, participants would not be allowed to participate in the study). Participants were then randomly allocated to one of the four experimental conditions. They were informed that they would take part in a usability evaluation of a mobile phone.
The usability test took about 45 min to complete. The instructions were that the participant would have to carry out several tasks with a mobile phone with a view to provide feedback about the usability of the mobile phone. It was emphasised that the idea was to evaluate the mobile phone and not the participant. Furthermore, participants were told that the design of the prototype was not yet complete but was still undergoing some testing.
The first activity of the participant in the experiment was to rate the mobile phone with regard to attractiveness and usability prior to having used it. For that purpose, the mobile phone was placed on a table, closed, with the back facing up so that participants had a full view of the modified exterior casing. This allowed participants to carry out a thorough visual inspection before task completion began. The first task given to
participants represented the experimental manipulation. After having worked on the task, attractiveness and usability of the appliance were rated again. This was followed by the completion of two further experimental tasks. After task completion, attractiveness and usability of the appliance were rated for a third time, followed by the administration of the PSSUQ. The experiment concluded with a debriefing session, in which the participant was also given the opportunity to give further feedback to the experimenter about the mobile phone and the testing procedure.
2.8 Data analysis
The dependent variables were analysed with an analysis of variance (ANOVA). A two-factorial ANOVA was carried out on the performance variables and the PSSUQ data. A three-factorial ANOVA with the additional factor ‘time of measurement’ was conducted on product attractiveness and the single-item measure of usability. The alpha level was set to 5%.
3. Results
3.1 Perceived product attractiveness
The pilot study had already indicated considerable differences in the aesthetic perception of the two variants of the mobile phone. This rating was confirmed in the main
experiment (aesthetically appealing phone: M = 4.86, SD = 1.61; aesthetically unappealing phone: M = 2.25, SD = 1.29), using a 7-point scale. This difference was significant (F = 42.7; df = 1, 56; p < .01). This indicates a positive outcome of the
manipulation check. The actual interaction of the user with the product did not change the perceived attractiveness of the appliance, resulting in the main effect of stage of usability
test not being significant (pre-task: M = 3.50, post-task: M = 3.61; F = 1.22; df = 1, 56; ns). Similarly, prior usage event did not influence user perception of appliance
attractiveness (positive: M = 3.63; negative: M = 3.48; F < 1). No interaction between any of the independent variables was observed.
3.2 User performance 3.2.1 Task completion time
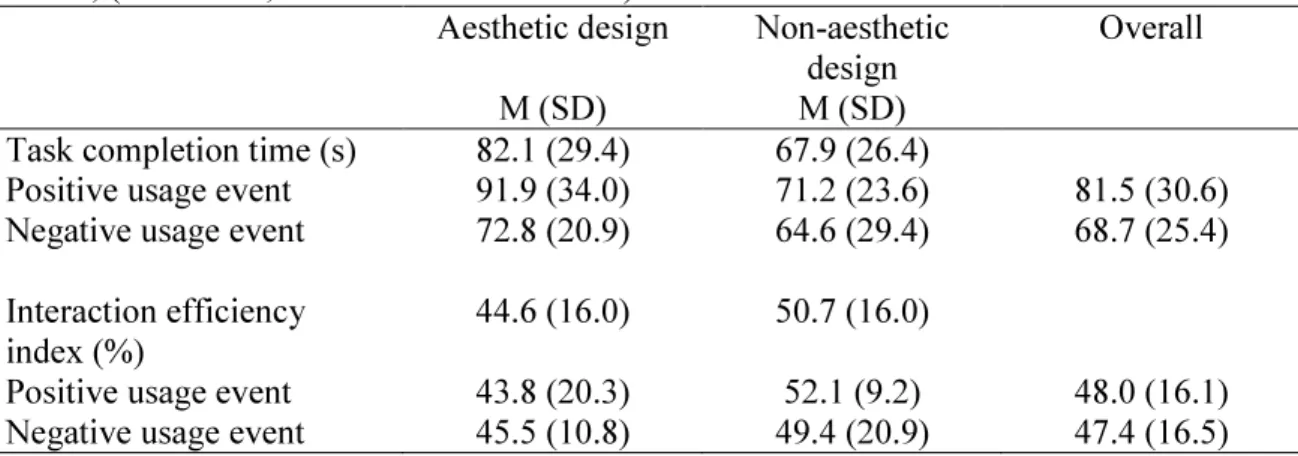
Users with an aesthetically pleasing appliance needed more time (s) to carry out the task than the comparison group (see table 2). This difference was significant (F = 4.12; df = 1, 56; p < .05). However, there was no significant effect of prior usage event (F = 3.27; df = 1, 56; ns). This suggests that performance on a preceding task does not affect
performance on subsequent tasks. Lastly, the interaction between the two factors was not significant (F < 1).
3.2.2 Interaction efficiency index
The ratio of optimal and actual number of user inputs was calculated, resulting in an index of interaction efficiency expressed as a percentage (i.e. higher values indicate increased efficiency). The data are presented in table 2. In contrast to the performance measure task completion time, the analysis revealed no significant difference between the aesthetics groups (F = 2.13; df = 1, 56; ns). As for task completion, there was no main effect of prior usage event (F < 1) and no interaction between the two factors was observed (F < 1). Again, this suggests that performance on a preceding task is unrelated to performance on a subsequent task and also to the attractiveness of the product.
Table 2: Measures of user performance as a function of design aesthetics and prior usage event; (M = mean; SD = standard deviation)
Aesthetic design M (SD) Non-aesthetic design M (SD) Overall
Task completion time (s) 82.1 (29.4) 67.9 (26.4)
Positive usage event 91.9 (34.0) 71.2 (23.6) 81.5 (30.6) Negative usage event 72.8 (20.9) 64.6 (29.4) 68.7 (25.4) Interaction efficiency
index (%)
44.6 (16.0) 50.7 (16.0)
Positive usage event 43.8 (20.3) 52.1 (9.2) 48.0 (16.1) Negative usage event 45.5 (10.8) 49.4 (20.9) 47.4 (16.5)
3.3 Perceived usability 3.3.1 Single-item measure
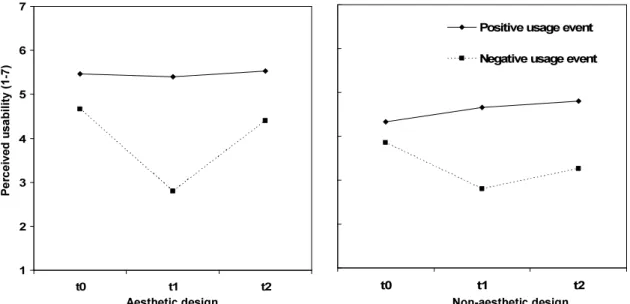
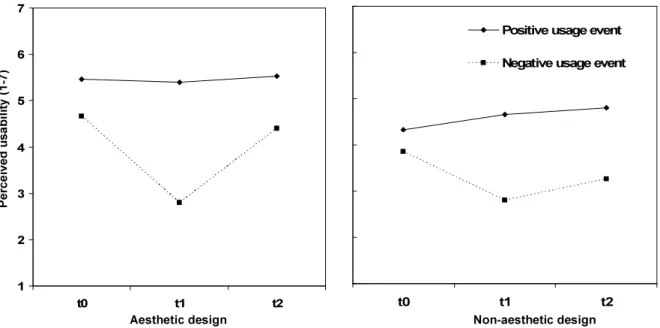
Perceived usability was measured on three occasions, prior to task completion (t0), after the task representing the experimental manipulation (t1), and after the two experimental
tasks (t2). A three-factorial analysis of variance revealed a main effect of aesthetics, with
users giving higher usability ratings to the aesthetically more appealing appliance (M = 4.7 vs. M = 3.9; F = 6.41; df = 1, 56; p < .05). As figure 2 indicates, there was no interaction between aesthetics and time of measurement (F = 1.30; df = 2, 112; ns) since both aesthetics conditions followed the same U-shaped pattern across the three points of measurement. The graph also shows that the ratings for the group with a positive usage event remained rather stable across measuring points while the group with the negative usage event showed decreased ratings at t1, after the attempt to complete the impossible
task, followed by a recovery at t2. This pattern was confirmed by a significant interaction
between prior usage event and time of measurement (F = 7.38; df = 2, 112; p < .001). The drop in perceived usability for one of the experimental groups resulted in a significant main effect of prior usage event, with a negative event leading to lower usability ratings (M = 3.6 vs. M = 5.0; F = 22.0; df = 1, 56; p < .001). Furthermore, due to this decrease in the ratings at t1 for one of the groups, the main effect of time of measurement was also
significant (F = 6.06; df = 2, 112; p < .005). No other interaction was significant.
1 2 3 4 5 6 7 t0 t1 t2 t0 t1 t2
Positive usage event Negative usage event
Aesthetic design Non-aesthetic design
P e rc e iv e d u s a b il it y (1 -7 )
Figure 2: Usability ratings (1-7) as a function of design aesthetics, prior usage event and time of measurement: (t0) prior to task completion, (t1) after completion of experimental
manipulation task, (t2) after completion of two experimental tasks
3.3.2 Post-Study System Usability Questionnaire (PSSUQ)
The pattern of findings observed with the one-item scale was largely confirmed by the data for this questionnaire. The two-factorial analysis of variance (the PSSUQ was administered only once at the end of the usability test) revealed a main effect for the overall measure usability, indicating that the more aesthetically pleasing mobile phone was also considered to be more usable (4.5 vs. 3.9; F = 6.67; df = 1, 56; p < .05). It also emerged that a positive usage event led to an increase in usability ratings (4.6 vs. 3.9; F = 10.3; df = 1, 56; p < .005). No significant interaction was found. A separate analysis of the sub-scales revealed the same pattern of results (for reason of brevity, these are not reported here), suggesting that users did not differentiate very strongly between the
different aspects of the interface. The correlation between the PSSUQ and the single-item scale at t2 was r = .64 (p < .001).
4. Discussion
A primary research question of the current work concerned the effects of design aesthetics on performance. In the present study, an effect of design aesthetics on performance was observed in that users took longer to complete the tasks with the aesthetically appealing phone than with the less appealing one. The increased task completion time provided support for the ‘prolongation of joyful experience’- hypothesis (Sonderegger & Sauer, under review). This hypothesis suggests that users are more inclined to take their time before committing themselves to a control action (resulting in a longer time interval between two user inputs and hence leading to higher task completion time) or they spend more time playing around with the product (resulting in an increased number of interactions which leads to a deteriorating interaction efficiency index). Both types of adaptation may be the result of enjoying the operation of a highly appealing product design and both represent decrements of user performance. In the present study, however only the intervals between two user inputs increased in size whereas a rise in the frequency of exploratory behaviour was not observed. The reason why users increased the intervals remains unclear. It is conceivable that the intervals between user inputs increased because users were sidetracked by the attractive design. In the only other study that reported decreased performance for the aesthetically more pleasing product, the authors recorded a reduced number of data points being entered into an electronic
telephone book (Ben-Bassat et al., 2006). This slow-down in data entry speed bears some resemblance with the increased intervals observed in the present study.
Conversely, it would have also been conceivable that a highly appealing aesthetic design may increase user performance because users are more highly motivated to complete a series of tasks with an appealing product rather than an unappealing one (i.e. ‘increased motivation’ – hypothesis). There is hitherto one study that found empirical evidence to support this assumption (Sonderegger & Sauer, under review). This study was conducted in a school context, which may have been characterised by a stronger performance orientation than the present work. This suggests that future research takes into consideration possible moderating variables such as usage context and time pressure.
In contrast to the somewhat equivocal relationship between aesthetics and performance, the research literature provides a highly consistent pattern for the positive influence of aesthetics on perceived usability (e.g., Tractinsky et al., 2000; Lavie and Tractinsky, 2004; Schenkman and Jonsson, 2000), which was also confirmed in the present study. This demonstrated that the pattern found in previous work also applied to a 3-D fully operational prototype, which is a very close match to a real product.
Furthermore, the present study showed that the difference in ratings between the two aesthetics conditions found prior to any user-product interaction was largely maintained as users gradually became familiar with the functionalities of the appliance. This suggests that first impressions of a product caused by aesthetic properties continue to have an effect even after interaction with product took place. Furthermore, it suggests that substantial judgements about usability are made very early, often before users have actually interacted with the product. There is evidence from other work that a judgement
about the visual appeal is made within 50 ms of being exposed to the product (Lindgaard, Fernandes, Dudek and Brown, 2006). At the same time, our findings reiterate that the objective usability of a product has only a limited influence on perceived usability (Nielsen and Levy, 1994). Although our data show that shortcomings in usability (operationalised by the impossible task) are mirrored in user ratings, overall the ratings are remarkably stable and provide some support for the argument that the influence of aesthetics on perceived usability does not substantially change with increasing product-specific experience. This may correspond to a visceral reaction, which is considered an instantaneous response to a stimulus without a conscious evaluation (Lindgaard et al., 1996; Norman, 2004).
The positive effect of aesthetics on perceived usability was recorded for both instruments employed, that is, not only for the single-item scale with perhaps more moderate psychometric properties but also for the PSSUQ as an established instrument with very good reliability coefficients. It appears that the problem of the usability scales is primarily related to their diagnosticity rather than their sensitivity (cf. O’Donnell & Eggemeier, 1986), that is, the scales are better able to detect changes in the level of product usability (i.e. sensitivity) than to distinguish between usability and aesthetics (i.e. diagnosticity).
The findings of the study have some implications for practitioners. Not only do they need to be aware of the positive influence of aesthetics on perceived usability (as demonstrated by this study and numerous others), they also need to know about the influence of aesthetics on performance, even if the direction and the size of this impact are currently difficult to predict. The absence of carryover-effects of the impossible task on subsequent task performance represented a positive finding for usability practitioners since it provides them with some liberty concerning the order in which tasks are
presented.
Finally, some implications of the study for future research are pointed out. There is a need to identify the influencing factors that modify the relationship between
aesthetics and performance, given the inconsistent pattern in that relationship across domains. An important candidate for a factor of influence would be the context in which the product is being used (e.g., domestic, public or work domain). One may expect negative effects on performance in the domestic domain, positive effects in the work domain and more inconsistent effects in the public domain with so-called walk-up-and-use products (e.g., cash machine). Future research also needs to determine which performance indicators are most sensitive to the effects of aesthetics since the present study showed inconsistent effects across performance measures. For example, is it interaction efficiency in combination with task completion time (which together may be indicative of increased interface exploration) or task completion alone (which may be indicative of a non-explorative and more reflective enjoyment of the product)? The extension of work into these directions (i.e. identification of domain-specific factors and more fine-grained measurement of performance) appears to be a promising avenue for future research.
Acknowledgements
We are grateful to Gerold Zbinden and Jonas Marty for their help with this piece of research.
References
Bandura, A., Locke, E., 2003. Negative self-efficacy and goal effects revisited. Journal of Applied Psychology, 88 (1), 87-99.
Ben-Bassat, T., Meyer, J., Tractinsky, N., 2006. Economic and subjective measures of the perceived value of aesthetics and usability. ACM Transactions on Computer-Human Interaction, 13 (2), 210-234.
Chang, H.C., Lai, H.H., Chang, Y.M., 2007. A measurement scale for evaluating the attractiveness of a passenger car form aimed at young consumers. International Journal of Industrial Ergonomics, 37 (1), 21–30.
Crilly, N., Moultrie, J., Clarkson, P.J., 2004. Seeing things: consumer response to the visual domain in product design. Design Studies, 25 (6), 547–577.
Dion, K., Berscheid, E., Walster, E., 1972. What is beautiful is good. Journal of Personality and Social Psychology, 24 (3), 285-290.
Hall, R.R., 1999. Usability and product design: a case study. In: Jordan, P., Green,W.S. (Eds.), Human Factors in Product Design. Taylor & Francis, London, pp. 85–91. Heckert, P., Snelders, H.M.J.J., van Wieringen, P.C.W., 2003. Most advanced, yet
acceptable: typicality and novelty as joint predictors of aesthetic preference. British Journal of Psychology, 94, 111–124.
Jones, F., Harris, P., Waller, H., Coggins, A., 2005. Adherence to an exercise prescription scheme: The role of expectations, self-efficacy, stage of change and psychological well-being. British Journal of Health Psychology, 10 (3), 359-378.
Klein, J., Moon, Y., Picard, R.W., 2002. This computer responds to user frustration: Theory, design, and results. Interacting with Computers, 14 (2), 119-140. Kurosu, M., Kashimura, K., 1995. Apparent Usability vs. Inherent Usability:
experimental analysis on the determinants of the apparent usability. Conference companion on Human factors in computing systems, May 07-11, 1995, Denver, United States, pp. 292-293.
Lavie , T., Tractinsky, N., 2004. Assessing dimensions of perceived visual aesthetics of web sites. International Journal of Human-Computer Studies, 60 (3), 269-298.
Leder, H., Belke, B., Oeberst, A., & Augustin, D., 2004. A model of aesthetic
appreciation and aesthetic judgements. British Journal of Psychology, 95, 489-508.
Lewis, J. R., 1995. IBM computer usability satisfaction questionnaire: Psychometric evaluation and instructions for use. International Journal of Human-Computer Interaction, 7 (1), 57-78.
Lewis, J.R., 2002. Psychometric Evaluation of the PSSUQ: Using Data from Five Years of Usability Studies. International Journal of Human-Computer Interaction, 14 (3-4), 463-488.
Lewis, J.R., 2006. Usability testing. In: Salvendy, G. ed. Handbook of Human Factors and Ergonomics. New York: John Wiley, 1275-1316.
Nielsen, J., 1990. Paper versus computer implementations as mockup scenarios for heuristic evaluation. In: Proceedings of the IFIP TC13 Third International Conference on Human–Computer Interaction, August 27–31, 1990. North-Holland,
Cambridge, UK. Amsterdam, pp. 315–320.
Nielsen, J., Levy, J., 1994. Measuring Usability – Preference vs. Performance. Communications of the ACM, 31 (4), 66-75.
O’Donnell, R. D. and Eggemeier, F. T. (1986). Workload assessment methodology. In Boff, K.R., Kaufman, L. and Thomas, J.P. (eds): Handbook of Perception and Human Performance. New York: Wiley. ..pp??
Partala, T., Surakka, V., 2004. The effects of affective interventions in human-computer interaction. Interacting with Computers, 16 (2), 295-309.
Picard, R.W., Klein, J., 2002. Computers that recognise and respond to user emotion: theoretical and practical implications. Interacting with Computers, 14 (2), 141-169.
Sauer, J., Franke, H., Rüttinger, B., 2008. Designing interactive consumer products: utility of low-fidelity prototypes and effectiveness of enhanced control labelling. Applied Ergonomics 39, 71–85.
Sauer, J., Seibel, K., Rüttinger, B., in press. The influence of user expertise and prototype fidelity in usability tests. Applied Ergonomics.
Sauer, J., Sonderegger, A., 2009. The influence of prototype fidelity and aesthetics of design in usability tests: effects on user behaviour, subjective evaluation and emotion. Applied Ergonomics, 40, 670-677.
Schenkman, B.N., Jonsson, F.U., 2000. Aesthetics and preferences of web pages. Behavior and Information Technology, 19 (5), 367-377.
Shneiderman, B., 1998. Designing the user interface. In: Strategies for effective human-computer interaction (3rd Ed.), Addison-Wesley, Reading.
Tractinsky, N., 1997. Aesthetics and apparent usability: Empirically assessing cultural and methodological issues. Proceedings of the SIGCHI conference on Human factors in computing systems, March 22-27, 1997, Atlanta, United States, pp. 115-122.
Tractinsky, N., Katz, A.S., Ikar, D., 2000. What is beautiful is usable. Interacting with Computers, 13 (2), 127–145.
Wanous, J.P., Reichers, A.E., Hudy, M.J., 1997. Overall job satisfaction: how good are single-item measures? Journal of Applied Psychology, 82 (2), 247-252.
Tables
Table 1: Modified version of Post-Study System Usability Questionnaire (Lewis, 2002) Subscale ‘System usefulness’
Overall, I am satisfied with how easy it is to use this mobile phone. It was simple to use this mobile phone.
I was able to complete the tasks and scenarios quickly using this mobile phone.
I felt comfortable using this mobile phone. It was easy to learn to use this mobile phone.
I believe I could become productive quickly using this mobile phone. Subscale ‘Information quality’
The mobile phone gave error messages that clearly told me how to fix problems.
Whenever I made a mistake using the mobile phone, I could recover easily and quickly.
The information provided by this mobile phone was clear. It was easy to find the information I needed.
The information was effective in helping me complete the tasks and scenarios.
The organization of information on the mobile phone’s display was clear.
Subscale ‘Interface quality’
The interface of this mobile phone was pleasant. I liked using the interface of this mobile phone. Overall satisfaction
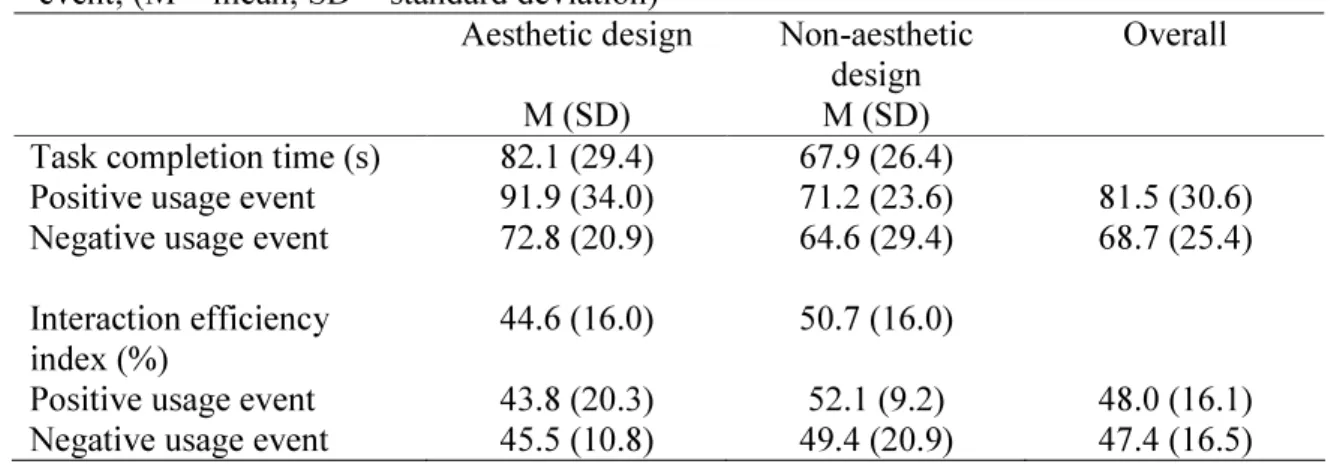
Table 2: Measures of user performance as a function of design aesthetics and prior usage event; (M = mean; SD = standard deviation)
Aesthetic design M (SD) Non-aesthetic design M (SD) Overall
Task completion time (s) 82.1 (29.4) 67.9 (26.4)
Positive usage event 91.9 (34.0) 71.2 (23.6) 81.5 (30.6) Negative usage event 72.8 (20.9) 64.6 (29.4) 68.7 (25.4) Interaction efficiency
index (%)
44.6 (16.0) 50.7 (16.0)
Positive usage event 43.8 (20.3) 52.1 (9.2) 48.0 (16.1) Negative usage event 45.5 (10.8) 49.4 (20.9) 47.4 (16.5)
Figure 1: Two versions of mobile phone: (a) aesthetically appealing design and (b) aesthetically unappealing design
Figure 2: Usability ratings (1-7) as a function of design aesthetics, prior usage event and time of measurement: (t0) prior to task completion, (t1) after completion of experimental
manipulation task, (t2) after completion of two experimental tasks
1 2 3 4 5 6 7 t0 t1 t2 t0 t1 t2
Positive usage event Negative usage event
Aesthetic design Non-aesthetic design
Pe rc e iv e d u s a b ili ty (1 -7 )