1. Introduction
The use of long-fiber laminates and organic matrix (O.M.C) continues to grow in most of various fields of engineering applications. The good specific mechanical properties of these materials make it possible to relief structures, particularly in the aeronautical and aerospace industries. Although these materials have several advantages, they should be used with caution.
Damage mechanisms involved in laminated composites are contrary to that of conventional metallic materials. One of the most important types of deterioration encountered in laminated composite materials is the decomposition of the two layers. This damage is known as delamination, which can be observed according to the scale of study. The resistance of the material decreases significantly due to delamination.
Practically, it is very important to identify the initiation of delamination and prevent further spread resulting in ultimate failure [01]. In addition, the prediction for the beginning of the delamination is also useful for the structure design. Short et al. [02] have studied the effect of the geometry and location of a single square delamination. The results of their experiments and finite element analyzes show that the
size of the delamination and position through the thickness, affects the compression breaking load. Kutlu and Chang. [03] reported the first studies on the effects of delamination on the compression behavior of multiple laminates (one or two). They performed an analytical and experimental analysis to determine the effects of the size and position across the width of delamination. Wang et al. [04] studied the effects of single and multiple position delamination on compressive resistance of the composite reinforced with glass fiber. Their experimental and numerical results show that several delaminations reduce the compressive resistance more than one delamination. Li et al. [05] used a LayerWise method to study the effects of the size and position of several delamination for unidirectional and diagonal beams. Suemasu et al. [06] determines the behavior in compression and composite failure mechanism with several circular delaminations using cohesive interface elements. Their results indicate that the load capacity of a composite structure with several delaminations depends on the growth of delamination. Jayatilake et al. [07] have developed a 3D finite element model to study the dynamic behavior (free vibration) of multilayer composite sandwich panels with delaminated interlayer. The results suggest that the size of delamination and the boundary conditions are the main factors responsible for the reduction in stiffness due to damage in composite laminates. A survey was Conducted again by TODO et al. using the model and fashion II ENF (End Notched Flexure)
Delamination of a Composite Laminated under
Monotonic Loading
Habib Achache
1, Abdelouahab Benzerdjeb
2,1
Department of Materials Engineering, University Dr Yahia Fares of Medea,
Urban Pole – 26000 Medea, , Algeria
2
Department of Mechanical Engineering University of Science and Technology
Oran Mohammed Boudiaf (USTO), BP1505 El Menaouar, 31036 Oran, Algeria.
Abstract.Our work aims to analyze using the finite element method the evolution of the stress intensity factor
(SIF) parameter K of three laminated folded plates stacks [+ α, -α], made of the same epoxy matrix and different reinforcement fibers (boron, graphite and glass). Our results show that the angle of orientation of the boron / epoxy composite has no great influence on the variation of the parameter KI. Compared to composite
graphite / epoxy and glass / epoxy, the laminated composite boron / epoxy reduces more the SIF KI in the
middle of the plate for angles 0 ° ≤α≤30 °.
Keywords: Cracks, delamination, stress intensity factor, fibers orientations, finite element method and
composite glass-fiber / vinyl ester [09]. Haneef et al. [08] have carried out finite element analysis to analyze the delamination effect on composite structures with two models. TODO and JAR presented a finite element study on micro-macro mechanical growth of interlaminar crack array fiberglass / epoxy DCB specimens for mode I [09]. Lonquan Liu et al. [10] studied the mechanical behavior of curved laminates experimentally and numerically using three right angle composite angles to determine progressive failure modes based on the Ye criterion of resistance failure. They found that the mode of failure of all specimens is delamination. Yang Liu and Dong W. Shu. [11] developed an analytical model to study the effect of a crack of the edge on the characteristics of vibration of the delaminated beams.
The present work aim is to analysis, by the finite element method, the evolution of the stress intensity factor parameter K of three laminated folded plates stacks [+ α, -α], made of the same epoxy matrix and various reinforcing fibers (boron, graphite and glass), by varying several parameters such as the fiber orientation, the delamination length and the load applied.
2. Geometric model
Our model is an orthotropic square plate of 150x20 mm2 consisting of eight 0.125 mm thick crossed plies
[+ α - α]; each layer with an epoxy matrix is reinforced by glass or graphite or bore fibers Fig.1.
The material mechanical properties of the unidirectional composites are shown in Table1 [12].
Table 1 Mechanical properties of composites
Proprieties Glass/epoxy Boron/epoxy Graphite/epoxy
E11[MPa] 50000 208000 13400 E22[MPa] 14500 25400 10300 E33[MPa] 14500 25400 10300 ν12 0.33 0.1677 0.33 ν13 0.33 0.1677 0.33 ν23 0.33 0.035 0.53 G12[MPa] 2560 7200 5500 G13[MPa] 2560 7200 5500 G23[MPa] 2240 4900 3200
Fig. 1 Geometric model. l: width of the plate = 20 mm
L: Length of the laminate sheet = 150 mm e: plate thickness = 1 mm (8 plies)
d: Length of variable delamination (30 to 60) mm α: fiber orientation angle (+ α - α)
σ: variable applied stress (1 to 10) MPa
The Simulation of linear tensile behavior and the influence of fiber orientation and other parameters, have been carried out using the numerical code Abaqus [13] and this for the analysis of composite structures was done by the finite element method. This code provides a complete system, incorporating not only the actual computing functions, but also the model construction functions (preprocessor) and output treatment (post-processor). To properly conduct this study, we have chosen a three-dimensional element whose quadrilateral elements are of quadratic type (see Fig. 2).
Fig. 2 Mesh with quadrilateral elements of quadratic type
3. results
3.1 Influence of the width of delamination on
stress intensity factors of three composite:
0 2 4 6 8 10 12 0 50 100 150 200 250 300 350 400 450 500 550 600 650 700 750 800 850 KI,II,III (MPa .m 1/2 )
width of the plate (mm)
(KI) (KII) (KIII) (a) glass/epoxy 0 2 4 6 8 10 12 -100 0 100 200 300 400 500 600 700 800 KI,II,III (MPa .m 1 /2) (KI) (KII) (KIII)
width of the plate (mm)
(b) boron/epoxy 0 2 4 6 8 10 12 0 100 200 300 400 500 600 (KI) (KII) (KIII) KI,II,III (MPa .m 1/2 )
width of the plate (mm)
(c) graphite/epoxy
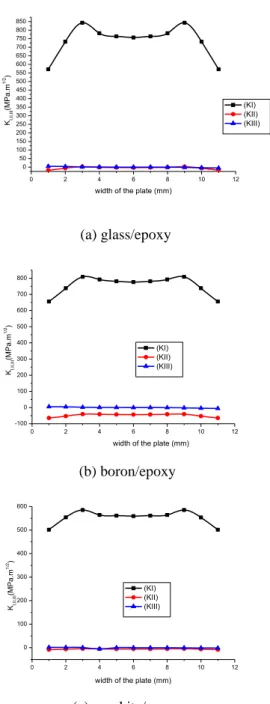
Fig. 4 Variation of the stress intensity factors KI, KII and KIII
depending on the width of delamination of the three composites for α = 0 ° and d = 30mm.
Figure 4 shows the variation of the stress intensity factors KI, KII and KIII depending on the width of
delamination of glass / epoxy composite. It is noted that the delamination spread of the composite plate is carried out in pure mode I and this according to the force applied to the composite. KI stress intensity
factor is much higher than the other two failure modes according to the plan and the anti-slip map, which shows that the detachment of the folds happens in pure mode I. In our study the pure mode I is predominant and it is the only parameter to be considered and the two sliding modes KII and KIII areneglected.
3.2 Influence of the width of delamination of
the composite glass / epoxy on the K
I/ K
Icratio
for different angles α (+α / - α) and different
lengths "d"
Figure 5 shows the variation of ratio KI / KIC ratio as a
function of the delamination width for different angles of orientation +/- of the folds of the glass / epoxy composite and different lengths d of the detached surface. The graphs of Figs. 5a, 5b, 5c, 5d, 5e, 5f and 5g are respectively determined for the delamination lengths 30 mm, 35 mm, 40 mm, 45 mm, 50 mm, 55 mm and 60 mm. It should be noted that regardless of the length of detachment of the layers of the glass / epoxy laminate composite, the curve of the ratio KI /
KIC has a symmetry with respect to the middle of the
delamination width and therefore the analysis could be performed over half the width of delamination. From the numerical results obtained by the finite element method, there are three different zones of the curve of the ratio KI / KIC:
The first zone is located at the free edges of the composite plate over a distance of 10% of the delamination half width in which the value of KI / KIC
ratio depends on the angle of the layers of the laminated composite and the surface of detachment and it reaches minimum values in this area and even negative values. At the free edges of the composite, it can be seen that regardless of the angle and the length d of the detachment surface, the propagation of the delamination is either slowed down or completely stopped.
The second zone is in the vicinity close to the free ends over a distance of 20% of the half width of the detachment. It is noted that regardless of the angle and the length L the curve of the ratio KI / KIC is in the
form of a parabola, it increases progressively to reach a peak and then decreases to a stable value in the middle of the plate composite. It is noted that the peak of the stress intensity factor is more intense for the angles of orientations of the fibers ranging from 0 ° to 50 ° and its intensity decreases with the increase of the angle in the interval [60 ° , 90 °]. The two orientations of the fibers at the 80 ° and 90 ° angles result in a small peak of the SIF KI. It is also observed
that the increase in the detachment surface leads to an increase in the peak of the SIF KI.
0 2 4 6 8 10 12 0,02 0,04 0,06 0,08 0,10 0,12 0,14 0,16 KI /KIC
width of the plate (mm)
0 10 20 30 40 45 50 60 70 80 90
(a) Delamination lengths 30mm
0 2 4 6 8 10 12 -0,05 0,00 0,05 0,10 0,15 0,20 0,25 KI /KIC
width of the plate(mm)
0° 10° 20° 30° 40° 45° 50° 60° 70° 80° 90° (b) Delamination lengths 35mm 0 2 4 6 8 10 -0,02 0,00 0,02 0,04 0,06 0,08 0,10 0,12 0,14 0,16 0,18 0,20 KI /KIC
width of the plate (mm)
0° 10° 20° 30° 40° 45° 50° 60° 70° 80° 90° (c) Delamination lengths 40mm 0 2 4 6 8 10 12 -0,12 -0,10 -0,08 -0,06 -0,04 -0,02 0,00 0,02 0,04 0,06 0,08 0,10 0,12 0,14 0,16 0,18 0,20 0,22 0,24 KI /KIC
width of the plate (mm)
0° 10° 20° 30° 40° 45° 50° 60° 70° 80° 90° (d) Delamination lengths 45mm 0 2 4 6 8 10 12 -0,08 -0,06 -0,04 -0,02 0,00 0,02 0,04 0,06 0,08 0,10 0,12 0,14 0,16 0,18 0,20 0,22 0,24 0,26 0,28 0,30 KI /KIC
width of the plate (mm)
0° 10° 20° 30° 40° 45° 50° 60° 70° 80° 90°
(e) Delamination lengths 50mm
0 2 4 6 8 10 12 -0,2 -0,1 0,0 0,1 0,2 0,3 KI /KIC
width of the plate (mm)
0° 10° 20° 30° 40° 45° 50° 60° 70° 80° 90° (f) Delamination lengths 55mm 0 2 4 6 8 10 12 -0,2 -0,1 0,0 0,1 0,2 0,3 0,4 KI /KIC
width of the plate (mm)
0° 10° 20° 30° 40° 45° 50° 60° 70° 80° 90° (g) Delamination lengths 60mm
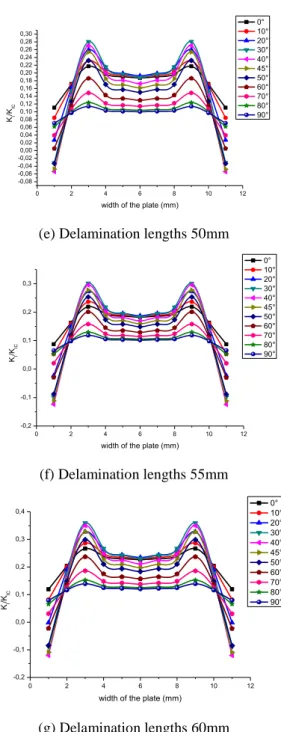
Fig. 5 Variation of KI / KIc depending on the width of
delamination of the composite glass / epoxy for different angles α (+α / - α) and different lengths (a:
30 mm b: 35 mm c: 40 mm, d: 45mm, e 50mm f: g 55mm and 60mm).
The third zone is in the middle of the composite plateover a distance of 20% of the half width of delamination. It can be seen that, regardless of the angle α and the length L, the KI / KIC ratio is almost
constant and the level of the stress intensity factor KI
depends strongly on the angle of orientation of the fibers and the length of delamination .
3.3Influence of fiber orientation on the K
I/ K
IC0 20 40 60 80 100 0,05 0,06 0,07 0,08 0,09 0,10 0,11 0,12 0,13 0,14 0,15 0,16 0,17 0,18 0,19 0,20 0,21 0,22 0,23 0,24 KI /KIC Fiber orientation (°) 30 35 40 45 50 55 60
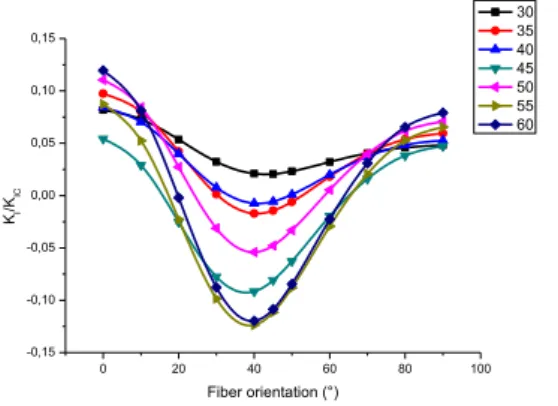
Fig. 6 variation of the KI / KIC ratio in the middle of the
composite plate as a function of the angle α for different lengths L of the detachment surface.
Figure 6 illustrates the variation of the KI / KIC ratio in
the middle of the composite plate as a function of the angle α for different lengths d of the detachment surface. It should be noted that whatever the length d, the ratio KI / KIC is almost constant for angles α
ranging from 0 ° to 30 ° and then decreases proportionally to the angle of orientation of the folds to a minimum value corresponding to α = 90 °.
3.4Influence of fiber orientation on the K
I/ K
ICratio at the free edge of the plate
Figure 7 illustrates the variation of the KI / KIC ratio at
the free edge of the composite plate as a function of the angle for different lengths d of the detachment surface. It can be seen that the curve of the parameter KI / KIC is in the form of a parabola whose extremum
corresponds to the angle = 40 ° for the different lengths of delamination. It is also noted that the variation of KI / KIC is not proportional to the
detachment surface, confirming the results obtained previously (see Figure 6).
0 20 40 60 80 100 -0,15 -0,10 -0,05 0,00 0,05 0,10 0,15 KI /KIC Fiber orientation (°) 30 35 40 45 50 55 60
Fig. 7 Variation of the KI / KIC ratio to the free edge
of the composite plate as a function of the angle of the glass / epoxy for different lengths d of the detachment surface.
3.5 Influence the length of delamination on
factor K
I 30 35 40 45 50 55 60 300 400 500 600 700 800 900At middle of the plate Plate exterior edges
KI (MPa .m 1 /2) Width of delamination (mm)
Fig. 8 Variation of the FIC KI as a function of the delamination length for different positions
(middle and outer) with = 90 °.
Figure 8 shows the variation of the SIF KI as a
function of the delamination length for an angle = 90 °, this curve shows the effect of the length of the detachment surface on the parameter KI. From the results obtained numerically, it is noted on one hand that the parameter KI increases with the increase of
delamination the length and on the other hand this variation is not proportional to this length.
3.6 Influence of the mechanical properties of
the composite on the parameter K
I0 2 4 6 8 10 12 500 520 540 560 580 600 620 640 660 680 700 720 740 760 780 800 820 840 860 KI (MPa .m 1 /2) Width of delamination(mm) Graphite/Epoxy Glass/Epoxy Boron/Epoxy
0 2 4 6 8 10 12 500 550 600 650 700 750 800 850 900 Graphite/Epoxy Glass/Epoxy Boron/Epoxy KI (MPa .m 1 /2) Width of delamination(mm) (b) Fiber orientation 10° 0 2 4 6 8 10 12 200 300 400 500 600 700 800 900 1000 Graphite/Epoxy Glass/Epoxy Boron/Epoxy KI (MPa .m 1 /2) Width of delamination(mm) (c) Fiber orientation 20° 0 2 4 6 8 10 12 0 200 400 600 800 1000 Graphite/Epoxy Glass/Epoxy Boron/Epoxy KI (MPa .m 1 /2) Width of delamination(mm) (d) Fiber orientation 30° 0 2 4 6 8 10 12 -100 0 100 200 300 400 500 600 700 800 900 1000 Graphite/Epoxy Glass/Epoxy Boron/Epoxy KI (MPa .m 1 /2) Width of delamination(mm)
(e) Fiber orientation 40°
0 2 4 6 8 10 12 0 100 200 300 400 500 600 700 800 900 1000 Graphite/Epoxy Glass/Epoxy Boron/Epoxy KI (MPa .m 1 /2) Width of delamination(mm) (f) Fiber orientation 45° 0 2 4 6 8 10 12 0 100 200 300 400 500 600 700 800 900 Graphite/Epoxy Glass/Epoxy Boron/Epoxy KI (MPa .m 1 /2) Width of delamination(mm) (g) Fiber orientation 50° 0 2 4 6 8 10 12 100 150 200 250 300 350 400 450 500 550 600 650 700 Graphite/Epoxy Glass/Epoxy Boron/Epoxy KI (MPa .m 1 /2) Width of delamination(mm) (h) Fiber orientation 60° 0 2 4 6 8 10 12 150 200 250 300 350 400 450 500 550 600 650 Graphite/Epoxy Glass/Epoxy Boron/Epoxy KI (MPa .m 1 /2) Width of delamination(mm)
0 2 4 6 8 10 12 200 250 300 350 400 450 500 550 600 650 Graphite/Epoxy Glass/Epoxy Boron/Epoxy KI (MPa .m 1 /2) Width of delamination(mm) (j) Fiber orientation 80° 0 2 4 6 8 10 12 200 250 300 350 400 450 500 550 600 650 Graphite/Epoxy Glass/Epoxy Boron/Epoxy KI (MPa .m 1 /2) Width of delamination (mm) (k) Fiber orientation 90°
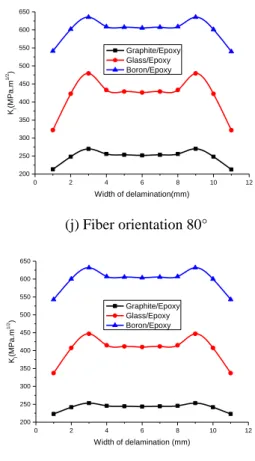
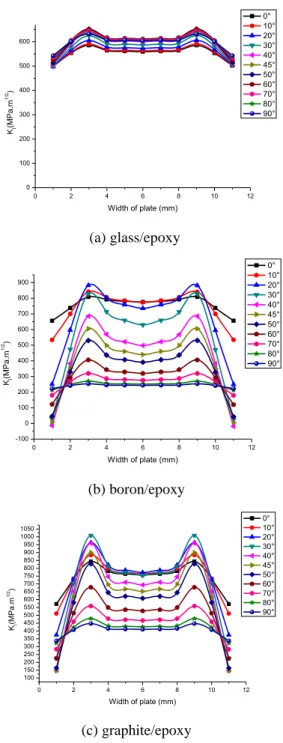
Fig. 9 Variation of the KI factor as a function of
the width of delamination of composites (glass/epoxy, graphite/epoxy and boron/epoxy) for different angles α(+/-) (has a: 0 °, b: 10 °, c:20 °, d: 30 °, e: 40 °, f: 45 °, g: 50 °, h: 60 °, i: 70 °, j: 80 ° and k: 90 °).
Figure 9 illustrates the variation of the SIF KI as a
function of the delamination width for the three glass / epoxy, graphite / epoxy and boron / epoxy laminated composites. These graphs are determined for a detachment length equal to 30 mm and the angles of orientations of the folds ranging from 0 ° to 90 ° with a pitch of 10 ° and they show the influence of the mechanical properties of the composite on the parameter KI . It is noted that the SIF KI is almost
constant along the delamination width of the composite plate with the presence of a slight variation at the free ends of the boron / epoxy composite, whatever the angle of the fibers. Consequently, for this type of composite, the angle of orientation of the fibers does not have a great influence on the variation of the parameter KI. Compared to graphite / epoxy and
glass / epoxy composites, the boron / epoxy laminate composite further reduces the SIF KI in the middle of
the plate for angles 0° ≤ 𝛼 ≤ 30° .. However, for
angles 40° ≤ 𝛼 ≤ 60° the boron / epoxy composite loses its resistance qualities with respect to the other two graphite / epoxy and glass / epoxy composites. It is noted that the properties of these latter composites allow a better attenuation of the parameter KI
compared to the boron / epoxy composite for angles of orientation of the fibers greater than 60 °.
The results obtained numerically by the element method show the variation of the stress intensity factor as a function of the width of the delamination for two angles of orientation of the plies of the graphite / epoxy and glass / epoxy laminate composite ( = 0 ° and = 20 °). It is noted that the two curves determined for these two angles are totally confounded, that is to say that the properties of these two composites have no influence on the propagation of delamination.
It is observed that for the two angles of orientation of the fibers = 30 ° and = 40 °, the stress intensity factor of the glass / epoxy composite is higher than that of the graphite / epoxy composite in the middle of the separation width and in the vicinity close to the free end of the composite plate but it remains constant at the free edges of the two composites. The difference in the stress intensity factors of glass / epoxy and graphite / epoxy composites increases with increasing fiber orientation angle = 50 ° and = 60 ° in the middle of the delamination width and In the vicinity close to the free ends, however the phenomenon is reversed at the free ends of the composites. For angles ranging from 70 ° to 90 ° the difference between the stress intensity factors of glass / epoxy and graphite / epoxy composites is almost constant over the entire delamination width whose level of the SIF KI of the
glass / Epoxy is always higher than that of the graphite / epoxy composite.
The mechanical properties of the graphite / epoxy composite increase the mechanical strength of the composite plate and improve its mechanical strength during operation, in particular for an angle of orientation of the folds equal to 90 °.
3.7 Influence of the delamination length on the
0 2 4 6 8 10 12 0 100 200 300 400 500 600 KI (MPa .m 1 /2) Width of plate (mm) 0° 10° 20° 30° 40° 45° 50° 60° 70° 80° 90° (a) glass/epoxy 0 2 4 6 8 10 12 -100 0 100 200 300 400 500 600 700 800 900 KI (MPa .m 1/2 ) Width of plate (mm) 0° 10° 20° 30° 40° 45° 50° 60° 70° 80° 90° (b) boron/epoxy 0 2 4 6 8 10 12 100 150 200 250 300 350 400 450 500 550 600 650 700 750 800 850 900 950 1000 1050 KI (MPa .m 1 /2) Width of plate (mm) 0° 10° 20° 30° 40° 45° 50° 60° 70° 80° 90° (c) graphite/epoxy
Fig. 10 Variation of the KI factor as a function of
delamination with of the three composite and for various angles α(+/-) (a: boron/epoxy, b: glass/epoxy and c: graphite/epoxy.)
Figure 10a, 10b and 10c show the variation of the SIF KI as a function of the width of the detachment of the
three composites for different orientation angles of the fibers. These graphs confirm the result obtained in figure 9.
3.8 Influence of the applied load on the K
Ifactor for different orientations of the fibers
Figure 11a, 11b and 11c show the variation of the FIC KI as a function of the force applied to the glass / epoxy composite plate for the three orientation angles of the respective fibers 0 °, 30 ° and 90 °. It can be seen that whatever the angle of the folds + / - the SIF KI increases with the increase of the applied load.
When the fibers are oriented at an angle = 0 °, the maximum load leads to the damage of the composite in the vicinity close to the free ends.
On the other hand, the orientation of the folds at an angle = 90 ° leads to a significant reduction of the SIF KI, which slows dawn the delamination
propagation even when the composite is subjected to high intensity charges. The orientation of the folds at an angle = 30 ° of the glass / epoxy composite stressed at intense loads leads to a SIF KI which
exceeds the toughness of the composite material, which promotes delamination and weakens the mechanical strength of the laminated composite.
3.9 Influence of the applied load on the K
Ifactor for different materials
0 2 4 6 8 10 0 1000 2000 3000 4000 5000 6000 7000 8000 Glass/Epoxy Graphite/Epoxy Boron/Epoxy KI (MPa . m 1/2 ) Chargement (MPa) (a) Case α=0° 0 2 4 6 8 10 0 1000 2000 3000 4000 5000 6000 7000 8000 9000 10000 Glass/Epoxy Graphite/Epoxy Boron/Epoxy KI (MPa .m 1 /2)
Applied Load (MPa)
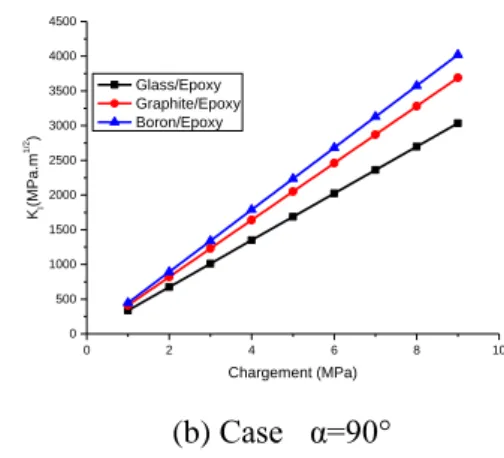
0 2 4 6 8 10 0 500 1000 1500 2000 2500 3000 3500 4000 4500 Glass/Epoxy Graphite/Epoxy Boron/Epoxy KI (MPa .m 1 /2) Chargement (MPa) (b) Case α=90°
Fig. 12 Variation of the KI factor as a function of the
applied load of the three composites and for different angles α (+α / - α) (a: α = 0 °, b: α = 30 ° and c: α = 90 °).
Figure 12 illustrates the variation of the SIF KI as a
function of the force applied to the glass / epoxy, graphite / epoxy and glass / epoxy composite plate for the three angles of orientation of the fibers respectively 0 °, 30 ° and 90 °. It is noted that the SIF varies in proportion to the load applied to the glass / epoxy composite. The curve of the stress intensity factor is a straight line.
4. Conclusions
This numerical analysis by the finite element methods allows us to draw the following conclusions:
. The propagation of pure mode I delamination depends on the type of stress applied to the laminated composite. In our study, mode I was decoupled of the two modes II and III.
. The delamination of the composite begins at the zone which is in the vicinity close to the two free ends of the laminated composite.
. The peak of the stress intensity factor is more intense for the angles of orientations of the fibers ranging from 0 ° to 50 ° and its intensity decreases with the increase of the angle in the interval [60 °, 90 ° ].
. The two orientations of the fibers at 80 ° and 90 ° angles result in a small peak of the SIF KI.
. The increase of the detachment surface leads to an increase of the peak of the SIF KI.
. Regardless of the angle and the length d, the KI / KIC ratio is almost constant in the middle over a
distance of 40% of the delamination width and the level of the stress intensity factor KI strongly depends
on the angle fiber orientation and delamination length. The parameter KI reaches a minimum value for an
angle of the fibers = 90 °.
. At the free edges of the composite plate, the KI
/ KIC ratio depends on the angle of the layers of the
laminated composite and the detachment surface and reaches minimum values in this area and even negative values. At the free edges of the composite, it can be seen that whatever the angle and the length d of the detachment surface. Therefore the propagation of the delamination is either slowed down or totally stopped. The angle of the fibers equal to 40 ° leads to a decrease in the stress intensity factor and the variation of the parameter KI is not proportional to the detachment length.
. The mechanical properties of the graphite / epoxy composite increase the mechanical strength of the composite plate and improve its mechanical strength during operation, in particular for an angle of orientation of the folds equal to 90 °. Compared with graphite / epoxy and glass / epoxy composites, the boron / epoxy laminate composite reduces more the SIF KI in the middle of the plate for fiber angles 0° ≤
𝛼 ≤ 30° . However, for corners the boron / epoxy composite loses its qualities of resistance.
. Whatever the angle of the folds + / - the SIF KI grows proportionally with the increase of the
applied load.
References
[01] Maimi P, Camanho PP, Mayugo JA, Turon A., “Matrix cracking and delamination in laminated composites”. Part I: Ply constitutive law, first ply failure and onset of delamination. Mech. Mater. 43, (2011) 169–85.
[02] Short GJ, Guild FJ, Pavier MJ., “The effect of delamination geometry on the compressive failure of composite laminates”. Compos Sci
Technol 61, (2001) 2075e86.
[03] Kutlu Z, Chang FK., “Modeling compression failure of laminated composites containing multiple through-the-width delaminations”. J
Compos Mater 26, (3): (1992) 350e86.
[04] Wang XW, Lezica IP, Harris JM, Guild FJ, Pavier MJ., “Compressive failure of composite laminates containing multiple delaminations ”.
Compos Sci Technol 65, (2005) 191e200.
[05] Li DH, Liu Y, Zhang X. “An extended Layerwise method for composite laminated beams with multiple delaminations and matrix cracks”. Int J
Numer Meth Eng 101, ( 2015) 407e34.
[06] Suemasu H, Sasaki W, Ishikawa T, Aoki Y. “A numerical study on compressive behavior of composite plates with multiple circular
delaminations considering delamination propagation”. Compos Sci Technol 68, (2008). [07] Jayatilake N., Warna Karunasena and Weena
Lokuge, , “Finite element based dynamic analysis of multilayer fibre composite sandwich plates with interlayer delaminations. Indunil”, Advances
in Aircraft and Spacecraft Science, Vol. 3 No. 1,
(2016).
[08] Haneef, M., R M S. A. & Ali, M. M.,. “Studies on Delaminating Effects on Stress Development in Composite Structures”, Proceedings of the World
Congress on Engineering Vol. III WCE, July 6 - 8,
London, U.K(2011) .
[09] Todo, M. – JAR, P. Y. B., “Study of Mode-I Interlaminar Crack Growth in DCB Specimens of Fibre-Reinforced Composites”, Composites Science and Technology, 58, (1998) pp. 105–118.
2562e7
[10] Lonquan Liu, Junqi Zhang, Hai Wang and Zhongwei Guan, “Mechanical behavior of the composite curved laminates in practical applications”. Steel and Composite Structures, Vol. 19 No. 5(2015) .
[11] Yang Liu and Dong W. Shu, “Effects of edge crack on the vibration characteristics of delaminated beams” Structural Engineering and
Mechanics, Vol. 53 No. 4 (2015).
[12] Seo, Dae-Cheol and Lee, Jung-Ju, “Fatigue crack growth behavior of cracked aluminum platerepaired with composite patch” Korea, Composite Structures publication 57, (2002) 323–330.
[13] Product Dassault Systèmes Simulia Corp, ABAQUS Standard Version 6.12, Providence, RI, USA (2012).
[14] Zhao L, Gong Y, Zhang J, Chen Y, Fei B. “Simulation of delamination growth in multidirectional laminates under mode I and mixed mode I/II loadings using cohesive elements”. Compos Struct. 116(1): (2014) 509–