Electronic copy available at: http://ssrn.com/abstract=1478201
MIT Sloan School of Management
MIT Sloan School Working Paper 4758-09
Comparison of Generality Based Algorithm Variants for Automatic Taxonomy Generation
© Andreas Henschel, Wei Lee Woon, Thomas Wachter, Stuart Madnick
Andreas Henschel, Wei Lee Woon, Thomas Wachter, Stuart Madnick
All rights reserved. Short sections of text, not to exceed two paragraphs, may be quoted without
explicit permission, provided that full credit including © notice is given to the source.
This paper also can be downloaded without charge from the
Social Science Research Network Electronic Paper Collection:
Electronic copy available at: http://ssrn.com/abstract=1478201
Comparison of Generality Based Algorithm Variants
for Automatic Taxonomy Generation
Andreas Henschel
Wei Lee Woon
Thomas Wachter
Stuart Madnick
Working Paper CISL# 2009-12
September 2009
Composite Information Systems Laboratory (CISL)
Sloan School of Management, Room E53-320
Massachusetts Institute of Technology
Cambridge, MA 02142
Electronic copy available at: http://ssrn.com/abstract=1478201
Comparison of generality based algorithm variants for automatic taxonomy
generation
Andreas Henschel
Masdar Institute of Science and Technology
P.O. Box 54224, Abu Dhabi, UAE
[email protected]
Wei Lee Woon
Masdar Institute of Science and Technology
P.O. Box 54224, Abu Dhabi, UAE
[email protected]
Thomas W¨achter
Technische Universit¨at Dresden
Tatzberg 47-52, 01307 Dresden, Germany
[email protected]
Stuart Madnick
Massachusetts Institute of Technology
77 Mass. Ave.,Building E53-321
Cambridge, MA 02139-4307, U.S.A.
[email protected]
Abstract
We compare a family of algorithms for the auto-matic generation of taxonomies by adapting the Heymann-algorithm in various ways. The core Heymann-algorithm determines the generality of terms and iteratively inserts them in a growing taxonomy. Variants of the algorithm are created by altering the way and the frequency, generality of terms is calculated. We analyse the performance and the com-plexity of the variants combined with a systematic threshold evaluation on a set of seven manually created benchmark sets. As a result, betweenness centrality calculated on un-weighted similarity graphs often performs best but requires threshold fine-tuning and is computationally more expen-sive than closeness centrality. Finally, we show how an entropy-based filter can lead to more precise taxonomies.
1. Introduction
Taxonomies for scientific research bodies facilitate the organisation of knowledge. They are used in Information Retrieval and Text Mining where it is beneficial to abstract from plain words to hierarchical concepts, which allows to structure document databases semantically. Immediate applications are Ontology based searching [10], a success-fully applied search engine for biomedical literature [4] and emerging trend detection [3].
Manual taxonomy construction is accurate but is unsuit-able for many resources that contain vast amounts of text documents. Further, it is desirable to deterministically and objectively develop taxonomies in order to provide
consis-tent maintenance, which is not guaranteed with nondeter-ministic algorithms or subjective curators.
To extract subsumption (taxonomic) relationships from text, there are two classes of approaches described in the literature: syntactic patterns such as ’A’ is a ’B’ ([8]) and statistical methods (e.g. [13]). Both classes rely on the distributional hypothesis introduced by Harris [7], which defines that two words which appear in many similar lin-guistic contexts are semantically similar. A promising ap-proach among the latter class is the algorithm developed in [9] which is simple, fast and extensible, and hence can in-clude ideas from various approaches. Although it was orig-inally designed for tagging systems in social web commu-nities, it can be adapted to general literature databases us-ing co-occurrence of terms as the base for expressus-ing term similarity. In [18] it was shown that by utilising the co-occurrence frequencies between a collection of representa-tive keywords, it is possible to infer the overall taxonomy of a given domain of research. A similar approach is presented by [12], where the authors propose a subsumption criterion for terms based on conditional probabilities for their co-occurrences. Other term distance measures employed are citation based, collaboration pattern based as well as more elaborate techniques of context similarity.
The remainder of this document is organised as follows: we elucidate several techniques originated from the Hey-mann algorithm, including generality ordering methods, various distance measures, weighting schemes and rerank-ing. The algorithms are systematically compared using seven benchmarks derived from a manually created ontol-ogy of medical terms. Finally we show, how cautious in-sertion into a taxonomy can improve the precision without
worsening the F-measure.
2. Systematic comparison of algorithms
2.1. Creation of MeSH benchmark sets
Quality assessment of taxonomy generation methods is preferably carried out using gold standard taxonomies. Medical Subject Headings (MeSH) is a man-curated ontol-ogy for medical terms [14]. It is well suited as a benchmark to test the ability of an algorithm to reproduce a gold stan-dard. We focus on several diverse branches in order to avoid over-fitting. For the automatic comparison of a manually and automatically generated taxonomies, the input terms are taken from the MeSH benchmarks. This poses a sim-plification of the overall taxonomy creation, where terms are selected using various methods (see e.g.[5, 1])
We then measure the precision by counting how many direct links of the original taxonomy are reproduced by the algorithm. Further we consider those links that are not only direct parent-child related but also grandchildren or great-grandchildren (upper part in Fig. 2) in the original bench-mark.
Occurrences are detected in the abstracts of 18 Million articles from Pubmed (a literature database for the life sci-ences), using stemming and term alignment ([4]).
2.2. Heymann-Algorithm
The taxonomy creation algorithm presented in [9] (Heymann-Algorithm) was originally intended for social networks where users annotate documents or images with keywords. The algorithm is fast, deterministic and easily extensible. Each keyword or “tag” is associated with a vec-tor that contains the frequencies of annotations for all doc-uments. These tag vectors are then comparable, e.g. using cosine similarity. We adapt the algorithm to general tax-onomy creation from scientific literature using binary tag vectors.
The algorithm consists of two stages: the first creates a similarity graph of tags, from which an order of centrality for the tags is derived. Obeying this order and starting from the most general tag, the tags are inserted to a growing tax-onomy by attaching tags to either the most similar tag or to the taxonomy root.
Two thresholds are used in the algorithm: first, the value above which an edge is permitted to the similarity graph (τS) filters very small similarities that might have occurred
by chance during the generality calculation. Second, the similarity above which a node is attached to its most similar non-root node rather than the root (τR) influences the
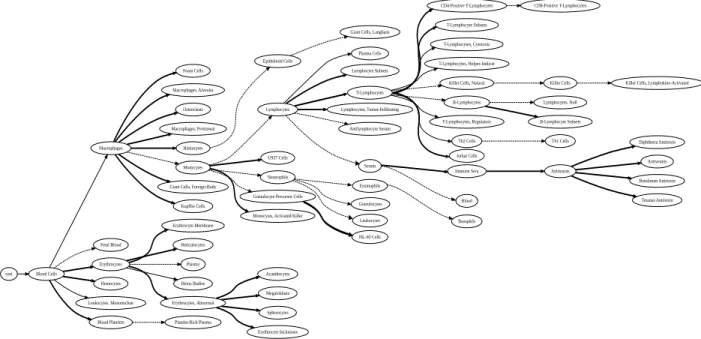
topol-ogy of the taxonomy. An example of a generated taxonomy is shown in Figure 1.
2.3. Algorithm modifications
2.3.1 Term generality derived from centrality in simi-larity graphs
A set of n terms gives rise to a similarity graph G = (V, E) where the nodes V represent terms and the edges E are sim-ilarities as provided by the similarity measure, see section 2.3.2. Generality can be deducted from a terms’ centrality in such a similarity graph. A variety of centrality measures exists. Amongst them betweenness and closeness central-ity are elaborate, global measures and therefore subject to further scrutiny.
Betweenness centrality cB for a node v is defined as:
cB(v) = X v∈V \{s,t} s6=t σst(v) σst (1)
where σstis the number of shortest paths from s to t, and
σst(v) is the number of shortest paths from s to t that pass
through a vertex v. The complexity of the betweenness cen-trality is O(n3). A fast algorithm for unweighted graphs of complexity O(ne) (e is the number of edges, which could be O(n2) in fully connected graphs, but can be less in other graph types) is given in [2] and implemented e.g. in [6], which we use in our benchmark system.
Closeness centrality cC for a node v is given as :
cC(v) =
1 P
t∈V \{v}1 − sim(v, t)
. (2)
with sim(v, t) being the similarity between nodes t and v. The complexity is O(n2).
Considering graph-theoretical aspects: Edge weights and disconnected graphs Betweenness and closeness centrality can be calculated using weighted or unweighted graphs. We investigate both types.
Figure 2 compares the precision of the Heymann-Algorithm variants with several centrality calculations in dependence of τS. Various values for τR are probed (see
Supplementary Material) but are of less influence. 2.3.2 Vector based term similarity
Originally Heymann et. al used vectors xt= [x1, . . . , xN]
of length equal to the number of documents N , where xi
describes, how many times a numbered document i in a user community has been annotated with term t. We adapt this to binary term-vectors (or set representations) indicat-ing whether a term occurs in a document (1) or not (0). Standard cosine vector similarity is therefore applicable.
Figure 1. A generated taxonomy for “Blood”. The fat links are correct wrt. the MeSH benchmark, semi-fat links are in grand- or great-grandchild relation in MeSH.
2.3.3 Reranking
A further modification to the Heymann algorithm is the in-termediate reranking of the remaining terms wrt. their cen-trality after inserting a term to the taxonomy. Note, that this step increases the algorithm complexity since the centrality calculation is run for every inserted term (O(n3) and O(n4)
for closeness and betweenness centrality, resp.).
2.3.4 Entropy of similarities
The basic Heymann algorithm attaches nodes to the most similar node in the growing taxonomy. Often terms, in par-ticular non-specific or ambiguous terms, exhibit similarities to many subjects. The Entropy ES, given in equation 3, is
an information theoretical concept that can be used to quan-tify that intuition and hence accounts for the uncertainty of adding a node. This edge annotation can later be used for quality assessment and semi-automatic curation.
ES(j) = − n
X
i∈T
sijlogbsijfor sij > 0 (3)
where sijare the similarities of the node to be inserted j and
the nodes i that are already in the taxonomy T . Similarities are normalised such that their sum yields 1. Thus a node j0
being similar to exactly one node but having 0 similarity to
all other nodes leads to a minimal entropy of 0, whereas a maximal entropy of 1 is reached when all nodes are equally similar to the node to be inserted.
3. Results
3.1. Term generality and systematic
thresh-old evaluation
The benchmark sets were scrutinised with respect to al-gorithm variants (centrality, rooting threshold τR, similarity
graph threshold τS). One example is given in Figure 2. It
shows that unweighted closeness and betweenness central-ity yield the best results for 0 < τS ≤ 0.1. This finding
was consistent with most benchmarks. Exceptions occurred for the “Blood” and “Cardiovascular system” benchmarks, where single peaks of weighted closeness scored highest (Supplementary material).
The threshold for attaching a term to the root τRhas been
systematically probed in the range of 0 − 0.06 with step-size 0.005 and best results were consistently achieved with a very small value, i.e. avoiding node-attachments to the root as much as possible. Note that a histogram of all similarities revealed that most similarities are below 0.01.
Figure 2. Precision curves for centrality vari-ants for the MeSH-benchmark “Carbohy-drates”.
3.2. Intermediate reranking of term
gener-ality
Depending on the similarity graph threshold τS, the
intermediate reranking improves precision in 46% of the cases, decreases precision in 23% and achieves equal pre-cision in 30% of the cases.
3.3. Entropy based filtering improves
preci-sion
According to [17], taxonomy generation algorithms usu-ally achieve only 40-50% precision on general benchmarks. Velardi et al. therefore suggests in [16] to follow a semi-automatic approach including systematic human validation steps. As a basis for hand-curated taxonomies, precision be-comes paramount when automatically generating draft tax-onomies. We therefore monitor the F-measure, which trades off precision vs. recall and is frequently used in information theory to evaluate performance based on a single number [15].
Fβ= (1 + β2) ·
(precision · recall)
β2· precision + recall (4)
In order to appreciate precision, the F0.5-measure for
ex-ample values precision twice as important as recall.
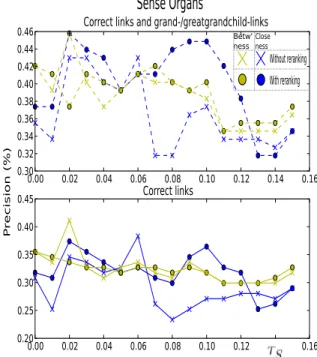
Omit-Figure 3. Benchmark: Sense Organs, with and without generality reranking
ting links comes to the expense of decreasing the recall. Yet, we argue that the omissions are justified as long as the F-measure improves.
By filtering high entropy links with ES > 0.7, precision
increases most notably for benchmark “Blood” (from 60% to 81%), “Carbohydrates” (from 38% to 43%) and “Fungi” (from 31% to 39%), see Figure 4.
The precision of all other benchmarks improves as well, but to a smaller extend. Larger margins are possible with other thresholds but might yield in over-fitting to the given benchmarks.
4. Conclusion
Unweighted betweenness centrality generally performs best but often only marginally better than the faster un-weighted closeness centrality. Neither method strictly dom-inates the other and both are dependent on fine-tuning of the similarity graph threshold. A good choice for τSis not
obvious but should be a value between 0 and 0.1. Both methods are complementary in the sense that their highest scoring taxonomies are not identical. A consensus-based meta-algorithm can benefit from this fact by only including the links both methods agree on.
Using weighted similarity graphs rarely improved the performance and hence did not justify the higher
compu-tational cost. Moreover, they fluctuate stronger wrt. τS.
Reranking the centrality often improves the algorithm performance but increases the computational expense. Fi-nally the proposed entropy-based filter for edges allows to shift focus towards more precise (but less complete) tax-onomies which arguably facilitates manual post-processing. Co-occurrence based similarity measures of terms are easily extractable from literature databases and can provide a scaffold for taxonomy creation. However, they also limit the success of taxonomy creation when dealing with seman-tically related terms that can not be ordered by generality: High-level terms such as “wind power” or “solar energy”, or terms that somehow interact (e.g., “hammer” and “nail”) frequently co-occur and hence exhibit a misleadingly high co-occurrence similarity. Yet neither are subsumable in the strict sense (“is-a” or “part-of” relations) of standard taxonomies. As a result, the semantics of taxonomy sub-and superconcepts merely allows the interpretation as “is-related-to” relation. Such a property is not transitive and hence less useful for purposes, where complete semantic subtrees of the taxonomy are required. As a remedy, it would be beneficial to incorporate more sophisticated simi-larity and generality measures using Natural language pro-cessing techniques as proposed in [11]. To this end it seems most promising to device a meta-algorithm, for which the Heymann algorithm is a suitable platform.
References
[1] D. Alexopoulou, T. W¨achter, L. Pickersgill, C. Eyre, and M. Schroeder. Terminologies for text-mining; an experiment in the lipoprotein metabolism domain. BMC Bioinformatics, 9 Suppl 4:S2, 2008.
[2] U. Brandes. A faster algorithm for betweenness centrality. Journal of Mathematical Sociology, 25:163–177, 2001. [3] C. Chen. CiteSpace II: Detecting and visualizing emerging
trends and transient patterns in scientific literature. Journal of the American Society for Information Science and Tech-nology, 57:359–377, 2006.
[4] A. Doms and M. Schroeder. GoPubMed: Exploring PubMed with the Gene Ontology. Nucleic Acids Res, 33(Web Server issue):783–786, Jul 2005.
[5] K. Frantzi, S. Ananiadou, and H. Mima. Automatic recog-nition of multi-word terms:. the c-value/nc-value method. International Journal on Digital Libraries, V3(2):115–130, 2000.
[6] A. A. Hagberg, D. A. Schult, and P. J. Swart. Exploring network structure, dynamics, and function using NetworkX. In Proceedings of the 7th Python in Science Conference (SciPy2008), pages 11–15, Pasadena, CA USA, Aug. 2008. [7] Z. Harris. Mathematical Structures of Language. Wiley,
1968.
[8] M. A. Hearst. Automatic acquisition of hyponyms from large text corpora. In Proceedings of the Fourteenth Inter-national Conference on Computational Linguistic, Nantes, France, 1992.
[9] P. Heymann and H. Garcia-Molina. Collaborative creation of communal hierarchical taxonomies in social tagging sys-tems. Technical Report 2006-10, Stanford University, April 2006.
[10] M. Klein and A. Bernstein. Searching for services on the semantic web using process ontologies. In In Proceedings of the International Semantic Web Working Symposium, pages 159–172. IOS press, 2001.
[11] P.-M. Ryu and K.-S. Choi. Taxonomy learning using term specificity and similarity. In Proceedings of the 2nd Work-shop on Ontology Learning and Population: Bridging the Gap between Text and Knowledge, pages 41–48, Sydney, Australia, July 2006. Association for Computational Lin-guistics.
[12] M. Sanderson and B. W. Croft. Deriving concept hierarchies from text. In Research and Development in Information Re-trieval, pages 206–213, 1999.
[13] R. Snow, D. Jurafsky, and A. Y. Ng. Semantic taxonomy induction from heterogenous evidence. In ACL ’06: Pro-ceedings of the 21st International Conference on Computa-tional Linguistics and the 44th annual meeting of the ACL, pages 801–808, Morristown, NJ, USA, 2006. Association for Computational Linguistics.
[14] U.S. Dept. of Health. Medical subject headings.
[15] C. J. Van Rijsbergen. Information Retrieval, 2nd edition. Dept. of Computer Science, University of Glasgow, 1979. [16] P. Velardi, A. Cucchiarelli, and M. Petit. A taxonomy
learn-ing method and its application to characterize a scientific web community. IEEE Trans. on Knowl. and Data Eng., 19(2):180–191, 2007.
[17] D. Widdows. Unsupervised methods for developing tax-onomies by combining syntactic and statistical informa-tion. In NAACL ’03: Proceedings of the 2003 Confer-ence of the North American Chapter of the Association for Computational Linguistics on Human Language Technol-ogy, pages 197–204, Morristown, NJ, USA, 2003. Associ-ation for ComputAssoci-ational Linguistics.
[18] W. Woon and S. Madnick. Asymmetric information dis-tances for automated taxonomy construction. Knowledge and Information Systems, 2009.
Figure 4. The figure shows the F0.5-measure (solid) and the precision (dashed lines) for three MeSH
benchmarks. Higher entropy of similarities expresses lower confidence in a taxonomy-link. Not filtering by entropy at all yield in precision and F-measure equal to the rightmost data point of each curve, indicated by horizontal dotted lines. The figure shows that indeed high entropy links are often wrong and precision decreases for all benchmark sets. Therefore, by filtering these low confidence links, the algorithm improves in terms of precision, while maintaining or slightly improving the F-measure. Any threshold above 0.7 increases precision without worsening the F-F-measure.