HAL Id: hal-00517560
https://hal.archives-ouvertes.fr/hal-00517560
Submitted on 16 Sep 2010HAL is a multi-disciplinary open access archive for the deposit and dissemination of sci-entific research documents, whether they are pub-lished or not. The documents may come from teaching and research institutions in France or
L’archive ouverte pluridisciplinaire HAL, est destinée au dépôt et à la diffusion de documents scientifiques de niveau recherche, publiés ou non, émanant des établissements d’enseignement et de recherche français ou étrangers, des laboratoires
Impact of three ampicillin dosage regimens on selection
of ampicillin resistance in Enterobacteriaceae and
excretion of blaTEM genes in swine feces.
Delphine Bibbal, Véronique Dupouy-Guiraute, Jean-Pierre Ferré, Pierre-Louis
Toutain, Olivier Fayet, Marie-Françoise Prère, Alain Bousquet-mélou
To cite this version:
Delphine Bibbal, Véronique Dupouy-Guiraute, Jean-Pierre Ferré, Pierre-Louis Toutain, Olivier Fayet, et al.. Impact of three ampicillin dosage regimens on selection of ampicillin resistance in Enterobacteri-aceae and excretion of blaTEM genes in swine feces.. Applied and Environmental Microbiology, Amer-ican Society for Microbiology, 2007, 73 (15), pp.4785-90. �10.1128/AEM.00252-07�. �hal-00517560�
Impact of three ampicillin dosage regimens on selection of ampicillin
1
resistance in Enterobacteriaceae and excretion of bla
TEMgenes in swine feces
2
3
D. Bibbal,1 V. Dupouy,1 J.P. Ferré,1 P.L. Toutain,1 O. Fayet, 2 M.F. Prère, 2 and A. Bousquet-4
Mélou1* 5
6
UMR181 Physiopathologie et Toxicologie Expérimentales, INRA, ENVT, Ecole Nationale 7
Vétérinaire de Toulouse, 23 Chemin des Capelles, BP 87 614, 31076 Toulouse Cedex 3, 8
France1. 9
UMR5100 Microbiologie et Génétique Moléculaires, CNRS, UPS, Laboratoire de 10
Microbiologie et Génétique Moléculaires, Université Paul Sabatier, 118 route de Narbonne, 11
31062 Toulouse Cedex, France2. 12
13
14
* Corresponding author. Mailing address: UMR181 Physiopathologie et Toxicologie 15
Expérimentales, INRA, ENVT, Ecole Nationale Vétérinaire de Toulouse, 23 Chemin des 16
Capelles, BP 87 614, 31076 Toulouse Cedex 3, France. Phone: 33 (0) 561 193 925. Fax: 33 17
(0) 561 193 917. E-mail: a.bousquet-melou@envt.fr 18
ABSTRACT
19
The aim of this study was to assess the impact of three ampicillin dosage regimens on 20
ampicillin resistance among Enterobacteriaceae recovered from swine feces using phenotypic 21
and genotypic approaches. Phenotypically, ampicillin resistance was determined from the 22
percentage of resistant Enterobacteriaceae and MICs of E. coli isolates. The pool of 23
ampicillin resistance genes was also monitored by quantification of blaTEM genes, which code
24
for the most frequently produced β-lactamases in Gram-negative bacteria, using a newly-25
developed real-time PCR assay. Ampicillin was administered intramuscularly and by oral 26
route to fed or fasted pigs for 7 days at 20 mg/kg. The average percentage of resistant 27
Enterobacteriaceae before treatment was between 2.5% and 12% and blaTEM genes quantities
28
were below 107 copies/g of feces. By days four and seven, the percentage of resistant 29
Enterobacteriaceae exceeded 50% in all treated groups, with some highly resistant strains
30
(MIC>256µg/mL). In the control group, blaTEM genes quantities fluctuated between 104 - 106
31
copies/g of feces, whereas they fluctuated between 106-108 and 107-109 copies/g of feces for 32
intramuscular and oral routes, respectively. Whereas phenotypic evaluations did not 33
discriminate between the three ampicillin dosage regimens, blaTEM genes quantification was
34
able to differentiate between the effects of two routes of ampicillin administration. Our results 35
suggest that fecal blaTEM genes quantification provides a sensitive tool to evaluate the impact
36
of ampicillin administration on the selection of ampicillin resistance in the digestive 37
microflora and its dissemination in the environment. 38
INTRODUCTION
39
40
The major mechanism of resistance to β-lactam antibiotics in Gram-negative bacteria 41
results from the production of β-lactamases. Most of these are coded by the plasmid-mediated 42
blaTEM-1 gene (16, 25). The continuous introduction of new β-lactam antibiotics with different
43
activity spectra in human medicine has led to the selection of β-lactamase mutations, which 44
confer resistance to the newly-developed β-lactam antibiotics (22). β-lactam antibiotics are 45
also used in veterinary medicine where they contribute to the selective pressure that leads to 46
the emergence and diffusion of intestinal bacteria harboring resistance genes. Thus, 47
commensal bacteria in the gut form a reservoir of antibiotic resistance genes potentially 48
transmissible to humans via the food-chain and the environment (24, 26, 30). 49
Antimicrobial resistance in food animals deserves special attention. One of the most 50
heavily medicated sectors is pig-farming, world-wide antibiotic consumption in pigs 51
accounting for 60% of the antibiotics used in animals (8). A relationship has been 52
demonstrated between the high use of antimicrobials in pig herds and increased occurrence of 53
resistant bacterial strains in their digestive tracts (4, 10, 30, 33).When antibiotics are 54
administered to pigs, both the level and time-development of antibiotic exposure of the 55
intestinal microflora are dependent on the mode of drug administration (34). This exposure is 56
a key determinant of antibiotic resistance development in the gut flora, and the relation 57
between antibiotic dosage regimen and resistance merits attention. The impact of different 58
antibiotic dosage regimens on the emergence of resistance must be evaluated by appropriate 59
quantitative indicators of the resistance level. Traditionally, this has involved phenotypic 60
methods that measure bacterial antibiotic susceptibility (28). In addition, quantitative PCR has 61
been recommended for resistance genes surveillance because i) it is sensitive ii) unambiguous 62
standard curves can be used to quantify the resistance genes from various matrices and iii) no 63
bacterial cultivation is required (12, 17, 27, 35). 64
The aim of the present study was both to develop and validate a real-time PCR assay 65
to quantify fecal blaTEM genes in swine stools, and to explore the impact of three different
66
ampicillin dosage regimens on fecal ampicillin resistance in swine using different indicators. 67
Ampicillin resistance was evaluated by quantifying the blaTEM genes in feces by real-time
68
PCR assay associated with two conventional phenotypic methods based on determination of 69
the MICs of E. coli isolates and the percentage of resistant Enterobacteriaceae. The three 70
dosage regimens tested were: intramuscular route, oral route in fed and oral route in fasted 71
swine. 72
MATERIALS AND METHODS
74
Study design and sample collection. Eighteen 7-week old, commercial healthy
75
piglets, that had never received antibiotics, were used. They were housed separately in 76
individual pens throughout all the experiments. A meal was given twice daily and water was 77
provided ad libitum. Ampicillin was administered once a day at 20 mg/kg for seven days 78
(from day 0 to day 6) following three modalities: intramuscular route, oral route in fasted pigs 79
or oral route in fed pigs. The design schedule consisted of three successive series of 6 animals 80
receiving ampicillin treatments as follows: intramuscular (n=2), oral route in fed conditions 81
(n=2), control without treatment (n=2) in the first series; intramuscular (n=2), oral route in 82
fasted conditions (n=2), control without treatment (n=2) in the second series; oral route in fed 83
conditions (n=2), oral route in fasted conditions (n=2), control without treatment (n=2) in the 84
third series. Six pigs were used in the control group and 4 pigs in each ampicillin treatment 85
group. Intramuscular injections of ampicillin sodium (Ampicilline Cadril, Laboratory 86
Coophavet, Ancenis, France) were administered in the neck. For oral routes, a medicinal 87
premix (Ampicilline 80 Porc Franvet, Laboratory Franvet, Segré, France) was dissolved in 88
water and administered by gastric intubation. Fasted swine were starved 16 hours before 89
ampicillin administration and fed 4 hours after ampicillin administration. Ampicillin was 90
administered to fed pigs just at the end of their morning meal. 91
For phenotypic evaluation of ampicillin resistance, fecal samples were taken from 92
each pig, by digital manipulation or immediately after spontaneous defecation, at days 0 93
(before ampicillin administration), 1, 4, and 7. The samples were immediately transferred to 94
the laboratory and the Enterobacteriaceae were counted. For the quantification of blaTEM
95
genes in feces by real-time PCR, feces of each pig were collected two or three times before 96
the treatment. The value given for day 0 is the mean of these samplings. Feces were then 97
collected each day from day 1 to day 7. Samples were obtained as already described. Two 98
hundred mg of feces from each sample were frozen in liquid nitrogen and stored at -80°C 99
until assayed. 100
Phenotypic evaluation of ampicillin resistance. Feces (5 g) from each pig were
101
homogenized with 45 mL of peptone water, including 30% of glycerol, with a BagMixer 102
(Interscience, St Nom, France). Ten-fold serial dilutions of the filtrate were prepared and 100 103
µL of the dilutions were spread on MacConkey plates (AEB 151602, AES, Ker Lann, France) 104
containing 0 and 16 µg/mL of ampicillin. Enterobacteriaceae growing in the presence of 16 105
µg/mL of ampicillin were classified as resistant, considering the MIC breakpoint proposed by 106
the CLSI (MIC ≥ 32 µg/mL) (20). The plates were incubated at 37°C for 24 h. 107
Enterobacteriaceae counts from both plates were used to calculate the percentage of resistant
108
Enterobacteriaceae at each sampling time.
109
For each sample, 20 colonies were randomly picked on the MacConkey plates without 110
ampicillin and stored at -80°C until assayed. These colonies were considered as E. coli on the 111
basis of β-glucuronidase production using TBX agar (Tryptone Bile X-glucuronide agar, AES 112
laboratoire, Bruz, France) (11). Only a few colonies were β-glucuronidase negative. All β-113
glucuronidase negative isolates and a portion of β-glucuronidase positive isolates were tested 114
by the API 20E Enterobacteriaceae identification system (bioMérieux, Marcy l’Etoile, 115
France) to confirm their identification. For MICs determination, ampicillin susceptibility was 116
tested by microdilution broth dilution method according to the recommendations reported by 117
the CLSI (19). The control strain was E. coli ATCC 25922. 118
Bacteria and growth conditions. E. coli JS238[pOFX326], the plasmid of which
119
carries a monocopy of the target gene blaTEM-1, was used to optimize real-time PCR, assess
120
sensitivity and generate quantification standards. The strain was cultured in Mueller-Hinton 121
broth containing ampicillin at the concentration of 50 µg/mL at 37°C overnight. 122
DNA extraction. pOFX326 was purified with the QIAprep Spin Miniprep (Qiagen,
123
Hilden, Germany). Quality was assessed by migration on gel electrophoresis in 1% agarose, 124
after digestion with HindIII and concentration was assessed by spectrophotometry at 260 nm. 125
The QIAamp DNA Stool kit (Qiagen, Hilden, Gremany) was used to extract DNA from feces 126
according to manufacturer’s recommendations. For each series of extractions, a positive 127
control and a negative control were co-extracted and subjected to real-time PCR. 128
Design of primers. The PCR primers were designed with Pimer 3 and Oligo
129
Analyser. The specificity of the sequence was further checked against all the available 130
GenBank DNA sequences. The forward and reverse primers chosen for blaTEM genes
131
quantification were 5’-TTCCTGTTTTTGCTCACCCAG-3’ and 5’-132
CTCAAGGATCTTACCGCTGTTG-3’, respectively. These primers amplify a 112 bp 133
segment of the blaTEM-1D gene (GeneBank accession number AF 1888200) from nucleotide
134
positions 270 to 382. A 100% homology was demonstrated with 130 blaTEM genes for which
135
the nucleotide sequence was available, except for TEM-60. 136
Real-time PCR assay. The PCR amplification was performed in a 25 µL reaction
137
mixture with a SYBR Green PCR Core Reagents kit (Perkin Elmer Biosystems, Foster City, 138
USA). The reaction mixture contained 5 µL of test DNA solution, 2.5 µL of 10X SYBR 139
Green PCR Buffer, 1.6 µL of a deoxynucleoside triphosphate solution (2.5 mM each of 140
dATP, dCTP and dGTP and 5 mM of dUTP), 0.25 µL of each primer (20 µM), 4 µL of 25 141
mM MgCl2, 11.275 µL of Ultra Pure Water (Qbiogene, Montréal, Canada) and 0.125 µL of
142
AmpliTaq Gold DNA Polymerase, LD (5 U/µL) (Perkin Elmer Biosystems). Amplification 143
was performed using a GeneAmp PCR System 5700 thermocycler (Perkin Elmer 144
Biosystems) with the following conditions: 95°C for 10 min followed by 45 cycles of 15 145
seconds at 95°C and 1 minute at 60°C. A standard curve with three replicates of the control 146
plasmid pOFX326 diluted in Tris-EDTA buffer was generated for each PCR assay. All 147
sample PCRs were done in duplicate. The samples were checked for absence of background 148
levels of PCR-inhibiting compounds by spiking DNA extracted from the samples with target 149
DNA and subjecting these spiked DNA samples to real-time PCR both undiluted and diluted 150
(1:10). 151
The impact of DNA fecal environment on amplification sensitivity and performance was 152
assessed by comparing standard curves obtained with the control plasmid diluted in Tris-153
EDTA or in swine fecal DNA. The accuracy and reproducibility of the entire assay (from 154
DNA extraction to real time PCR analysis) was measured by spiking 200 mg of feces with an 155
overnight culture of E. coli JS238[pOFX326]. Five aliquots per day were subjected to DNA 156
extraction on three different days. The extraction recovery rate was calculated. It was checked 157
to be the same for different concentrations of blaTEM genes in feces by spiking fecal samples
158
with 10-fold serial dilutions of an overnight culture of E. coli JS238[pOFX326]. These 159
samples were subjected to DNA extraction and then to real-time PCR. 160
Statistical analysis. Statistical analysis was performed using Systat 10 (Systat
161
Software Inc., Richmond, CA, USA). Changes in the level of ampicillin resistance were 162
analyzed using a generalized linear mixed-effects model with the following equation: 163 Yijk = µ + Mi + Dj + i M k A + M*Dij + εijk, 164
where Yijk is the measure of resistance for pig k undergoing ampicillin administration with
165
modality i at day j, µ the overall mean, Mi the differential effect of treatment i, Dj the
166
differential effect of day j, M*Dij the corresponding interaction,
i M k
A the differential effect 167
of animal k nested within treatment i and εijk an error term. Y, the measure of resistance, was
168
monitored in various ways. For the phenotypic evaluation of resistance, Y was the log-169
transformed percentage of the resistant Enterobacteriaceae population or the log-transformed 170
percentage of E. coli isolates with MIC > 16 µg/ml. For the genotypic evaluation, Y was the 171
log-transformed quantity of blaTEM genes. Multiple comparisons were performed using the
172
Tukey test. The selected level of significance was P<0.05. 173
RESULTS
174
175
Validation of the PCR assay. In order to construct calibration curves and determine
176
the specificity and sensitivity of the primers in swine fecal DNA, the control plasmid 177
pOFX326 was diluted in Tris-EDTA buffer and in swine fecal DNA. Each dilution was 178
subjected to real time PCR and the amplifications were repeated four times. Melting-curve 179
analysis of the control plasmid, diluted either in Tris-EDTA buffer or in swine fecal DNA, 180
showed specific amplification with a PCR amplicon at a Tm value of 81°C (data not shown).
181
Despite the use of highly purified AmpliTaq Gold DNA Polymerase, analysis of the Ultra-182
Pure Water melting-curves revealed contamination and thus restricted the PCR quantification 183
limit (data not shown). Fig. 1 shows the two standard curves: the relation between Ct 184
(threshold cycles) values and the logarithm of blaTEM concentration was linear from 10 to 106
185
copies/µL. The determination coefficients (r2) were of 0.996 in Tris-EDTA and 0.985 in 186
swine fecal DNA. The closeness between these standard curves indicated that the complex 187
fecal DNA environment did not affect amplification sensitivity or performance. The intra- and 188
inter-day coefficients of variation of the entire assay (from DNA extraction to real time PCR 189
analysis) were 16.7% and 18.2%, respectively. The extraction recovery rate was 70-113% 190
(mean 98.5 %). This was checked to be the same for different concentrations of blaTEM genes
191
in feces by spiking fecal samples with 10-fold serial dilutions of an overnight culture of E. 192
coli JS238[pOFX326]. The correlation between blaTEM copy number/g feces and dilution
193
factors of the JS238[pOFX326] solution was high (with a determination coefficient, 194
r2=0.904). Thus the extraction yields for different concentrations of E. Coli JS238[pOFX326] 195
in feces were similar. Overall data demonstrated that this PCR analysis was suitable for 196
quantification of blaTEM genes in swine feces from 10 to 106 copies/µL of eluate of extracted
197
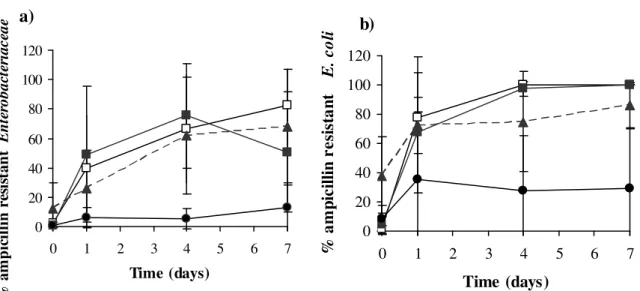
Phenotypic evaluation of ampicillin resistance. Average percentages of ampicillin-
199
resistant Enterobacteriaceae for each treatment group are given in Fig. 2a. The average 200
percentage of resistant Enterobacteriaceae ranged from 0.9% to 12% before ampicillin 201
administration. On the first day of treatment, it rose to 26% for the intramuscular route and to 202
40% and 49% for the oral routes in fed and fasted pigs respectively. By days 4 and 7, the level 203
of resistance exceeded 50% in all treated groups. In contrast, the level of resistance in the 204
control group remained below 13% at all times. Treated animals excreted significantly higher 205
percentages of resistant Enterobacteriaceae compared to the control group (P<0.05). 206
However, no significant differences were observed between the three modes of drug 207
administration (P>0.05). Furthermore, Fig. 2a shows the high inter-individual variability 208
within each group. 209
Ampicillin resistance was also monitored from the percentage of resistant E. coli 210
isolates for each treatment group (Fig. 2b). The average percentage of resistant E. coli ranged 211
from 1% to 38% before ampicillin administration. At day 1 of treatment, about 70% of 212
isolates were resistant, whatever the mode of drug administration. By days 4 and 7, nearly all 213
the isolates, whatever the dosage regimen, were resistant. In contrast, the percentages of 214
resistant E. coli remained below 36% in the control group. Statistical analysis indicated that 215
oral administration in fed pigs led to a higher fecal excretion of resistant E. coli than in 216
control pigs (P<0.05). The two other dosage regimens did not differ significantly from the 217
control group due to the great heterogeneity of the control group data (P>0.05). High inter-218
individual variability also existed within each ampicillin-treated group. 219
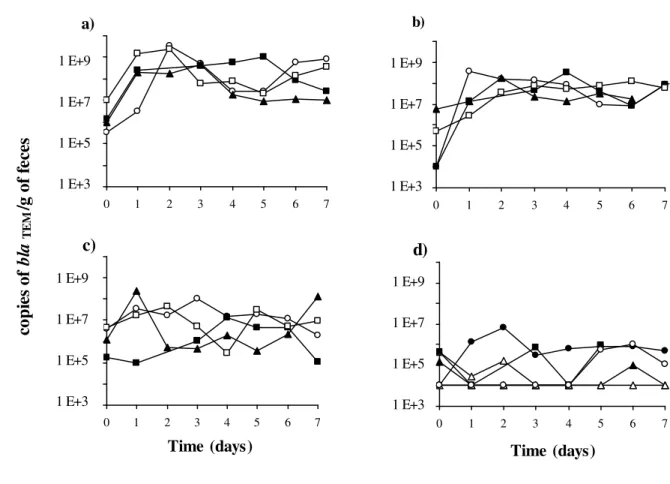
Genotypic evaluation of ampicillin resistance. Ampicillin resistance in feces was
220
measured by blaTEM genes quantification using the validated PCR assay. blaTEM genes copy
221
numbers per gram of wet feces were measured on each day of treatment for each pig (Fig. 3). 222
The baseline values for all pigs were below 107 copies/g of feces. blaTEM quantities increased
after ampicillin administration. The between-day fluctuations for a given animal were large. 224
The blaTEM quantities for the oral routes fluctuated between 107 and 109 copies/g of feces, but
225
only between 105 and 108 copies/g of feces for the intramuscular route. Two fed pigs treated 226
by oral route excreted the highest blaTEM quantities with values above 109 copies/g of feces.
227
The blaTEM quantities for the control group were lower than those of the three
ampicillin-228
treated groups and fluctuated between 104 and 106 copies/g of feces. 229
Fig. 4 shows the mean quantities of blaTEM genes for each dosage regimen. Statistical
230
analysis indicated that all ampicillin treatments had a significant effect on the excretion of 231
blaTEM genes compared to the control group (P<0.001). Moreover, oral administration in fed
232
pigs led to a significantly higher excretion of blaTEM genes than intramuscular administration
233
(P<0.05). 234
Comparisons of real time PCR assessments and phenotypic plate assays. We
235
investigated the agreement between resistant Enterobacteriaceae counts and blaTEM
236
concentrations. Fig. 5 shows a significant correlation (with a determination coefficient, 237
r2=0.67) between the quantities of blaTEM genes and the counts of ampicillin-resistant
238
Enterobacteriaceae.
239
DISCUSSION
241
The aim of this study was to explore the impact of three ampicillin dosage regimens 242
on the selection of ampicillin resistance in swine feces. Three indicators of ampicillin 243
resistance i.e. two classical phenotypic methods and a new genotypic method allowing 244
quantification of blaTEM genes in feces were selected. The results, whichever resistance
245
indicator was used, indicated that the different modes of ampicillin administration led 246
immediately (day one of treatment) to a large increase in the level of ampicillin resistance in 247
the fecal microflora. In addition, the results suggested that the quantitative PCR of fecal 248
blaTEM genes might be a promising tool to quantify the digestive reservoir of blaTEM genes and
249
evaluate the impact of β-lactam administration on the selection of ampicillin resistance in the 250
gut microflora. 251
Antibiotic impact on the gut microflora is generally measured by phenotypic 252
evaluation of antibiotic resistance on a limited bacterial population, either using isolates of 253
indicator bacteria or families of bacteria. E. coli and Enterobacteriaceae are good candidates 254
for studies of the antibiotic resistance level of the fecal flora and are commonly used for this 255
in pigs (28). These bacteria are easily culturable and their isolation is facilitated by specific 256
culture media. In the present experiment, results obtained with the two phenotypic indicators 257
of ampicillin resistance implied that all treatments had a similar negative impact on the gut 258
microflora with the emergence of a high level of resistance at all three dosage regimens. 259
These results are consistent with those of previous studies demonstrating that ampicillin 260
treatment could have a marked effect on the level of resistance in intestinal microbiota of 261
several species (7, 18, 29). Nevertheless, the phenotypic indicators commonly used to assess 262
antibiotic resistance exhibit methodological features that impact both their metrological 263
performances and relevance. Firstly, the selected indicator bacteria must be cultured and the 264
reliability of results has been questioned due to considerable variation originating from the 265
culture medium, bacterial inoculum, antibiotic preparation and incubation conditions (23). 266
Secondly, the isolates might not be representative of the whole population of bacteria (6). 267
These limits impair the sensitivity and precision of phenotypic indicators for the assessment 268
of resistance levels and have prompted investigators to develop molecular techniques as 269
alternatives, in particular quantitative PCR (12, 17, 27, 35). 270
Molecular techniques can be used to reveal the presence of genetic determinants without 271
bacterial cultivation and irrespective of the bacterial species carrying these genetic 272
determinants (5, 31). However, a requisite to this approach is the knowledge of the underlying 273
resistance mechanisms, and when few genes are involved in resistance, they may provide 274
candidates for resistance markers (3). blaTEM genes code for the most commonly encountered
275
β-lactamases in Gram-negative bacteria (21). We therefore developed and validated a real-276
time PCR assay to quantify blaTEM genes in swine feces. This PCR assay was suitable for
277
quantification of blaTEM genes from 104 to 109 copies/g of feces.
278
Examination of the agreement between resistant Enterobacteriaceae counts and blaTEM
279
concentrations revealed a significant correlation between the quantities of blaTEM genes and
280
the counts of ampicillin-resistant Enterobacteriaceae. The observed scatter is probably due 281
partly to the inaccuracy of both techniques and to the fact that amplified blaTEM genes may be
282
harbored by bacteria other than Enterobacteriaceae (13). 283
During our experiment to monitor blaTEM genes excretion, we found that treated pigs
284
excreted more blaTEM genes than control pigs. Moreover, as in the phenotypic evaluations, the
285
fecal excretion of blaTEM genes showed large individual day-to-day fluctuations. As indicated
286
above, these fluctuations were correlated with counts of ampicillin-resistant 287
Enterobacteriaceae. Similarly, Belloc et al. (2) studied the effect of quinolone treatment on
288
selection and persistence of quinolone-resistant E. coli in swine fecal flora and observed great 289
variability both in the percentage of resistant strains and pattern of emergence of resistance. In 290
the present study, despite the great variability and the small number of pigs per mode of 291
treatment, at least two of the three modes of drug administration (i.e. intramuscular route and 292
oral route in fed pigs) could be differentiated by quantifying the blaTEM genes excreted in
293
feces, but not by phenotypic evaluation. These results imply that a genotypic indicator can be 294
used advantageously as a complement to phenotypic approaches to quantitatively evaluate the 295
intestinal reservoir of resistance genes. For example, blaTEM genes quantification has already
296
been used to evaluate ampicillin-induced selective pressure on the gut microbiota in dogs 297
(12). 298
Our results, showing that oral administration of ampicillin in fed pigs was associated 299
with the highest excretion level of fecal blaTEM genes, are consistent with both our
300
pharmacokinetic measurements (not shown) and published data. These latter indicate that β-301
lactam absorption following oral administration is largely incomplete in pigs (1, 14) and that 302
feeding decreases β-lactam absorption in pigs as in dogs (15) and humans (32). As a 303
consequence, these expected high concentrations of unabsorbed ampicillin in the intestine are 304
likely to exert great pressure on the gut microflora, and this all the more if ampicillin is 305
administered to fed pigs. Following intramuscular administration, ampicillin can gain access 306
to the gastrointestinal lumen by biliary excretion (9), which explains why the intramuscular 307
route was also associated with an increase in fecal blaTEM genes excretion. Thus the
308
pharmacokinetic profiles of the three modes of ampicillin administration tested in the present 309
study were apparently different and resulted in different intestinal exposures. 310
In conclusion, our study indicates that fecal blaTEM genes quantification might be a
311
useful tool to evaluate and discriminate the impact of different modes of ampicillin 312
administration on the gut microflora. In the future, this quantitative tool might help to 313
quantify the flux of resistance genes in epidemiological investigations. 314
ACKNOWLEDGMENTS
315
This work was supported by the Conseil Régional de Midi-Pyrénées grant 03011987. 316
We thank Nathalie Arpaillange and Nadine Gauthier for their technical support and Jean-317
Pierre Gau, Patrice Rouby, Joseph Maligoy and Jean Denjean for taking care of the animals. 318
REFERENCES
319
1. Agerso, H., and C. Friis. 1998. Bioavailability of amoxycillin in pigs. J Vet
320
Pharmacol Ther 21:41-6. 321
2. Belloc, C., D. N. Lam, J. L. Pellerin, F. Beaudeau, and A. Laval. 2005. Effect of
322
quinolone treatment on selection and persistence of quinolone-resistant Escherichia 323
coli in swine faecal flora. J Appl Microbiol 99:954-9. 324
3. Bergeron, M. G., and M. Ouellette. 1998. Preventing antibiotic resistance through
325
rapid genotypic identification of bacteria and of their antibiotic resistance genes in the 326
clinical microbiology laboratory. J Clin Microbiol 36:2169-72. 327
4. Blake, D. P., R. W. Humphry, K. P. Scott, K. Hillman, D. R. Fenlon, and J. C.
328
Low. 2003. Influence of tetracycline exposure on tetracycline resistance and the
329
carriage of tetracycline resistance genes within commensal Escherichia coli 330
populations. J Appl Microbiol 94:1087-97. 331
5. Courvalin, P. 1991. Genotypic approach to the study of bacterial resistance to
332
antibiotics. Antimicrob Agents Chemother 35:1019-23. 333
6. Davison, H. C., J. C. Low, and M. E. Woolhouse. 2000. What is antibiotic
334
resistance and how can we measure it? Trends Microbiol 8:554-9. 335
7. Escoula, L., M. Coste, and G. Larrieu. 1982. Small filter membrane bags for the
336
study of antibiotic action in the digestive tract: bioavailability and in situ efficacy of 337
ampicillin in the pig caecum. Res Vet Sci 33:338-42. 338
8. FEDESA. 2000. Press release on the European Union conference: The microbial
339
threat. Copenhagen, FEDESA. 340
9. Galtier, P., and J. Charpenteau. 1979. Pharmacokinetics of ampicillin in pigs. J. vet.
341
Pharmacol. Therap. 2:173-180. 342
10. Gellin, G., B. E. Langlois, K. A. Dawson, and D. K. Aaron. 1989. Antibiotic
343
resistance of gram-negative enteric bacteria from pigs in three herds with different 344
histories of antibiotic exposure. Appl Environ Microbiol 55:2287-92. 345
11. Hansen, W., and E. Yourassowsky. 1984. Detection of beta-glucuronidase in
346
lactose-fermenting members of the family Enterobacteriaceae and its presence in 347
bacterial urine cultures. J Clin Microbiol 20:1177-9. 348
12. Harmoinen, J., S. Mentula, M. Heikkila, M. van der Rest, P. J. Rajala-Schultz, C.
349
J. Donskey, R. Frias, P. Koski, N. Wickstrand, H. Jousimies-Somer, E.
350
Westermarck, and K. Lindevall. 2004. Orally administered targeted recombinant
351
Beta-lactamase prevents ampicillin-induced selective pressure on the gut microbiota: a 352
novel approach to reducing antimicrobial resistance. Antimicrob Agents Chemother 353
48:75-9.
354
13. Heritage, J., N. Ransome, P. A. Chambers, and M. H. Wilcox. 2001. A comparison
355
of culture and PCR to determine the prevalence of ampicillin-resistant bacteria in the 356
faecal flora of general practice patients. J Antimicrob Chemother 48:287-9. 357
14. Jensen, G. M., J. Lykkesfeldt, K. Frydendahl, K. Moller, and O. Svendsen. 2004.
358
Pharmacokinetics of amoxicillin after oral administration in recently weaned piglets 359
with experimentally induced Escherichia coli subtype O149:F4 diarrhea. Am J Vet 360
Res 65:992-5. 361
15. Kung, K., B. R. Hauser, and M. Wanner. 1995. Effect of the interval between
362
feeding and drug administration on oral ampicillin absorption in dogs. J Small Anim 363
Pract 36:65-8. 364
16. Livermore, D. M., F. Moosdeen, M. A. Lindridge, P. Kho, and J. D. Williams.
365
1986. Behaviour of TEM-1 beta-lactamase as a resistance mechanism to ampicillin, 366
mezlocillin and azlocillin in Escherichia coli. J Antimicrob Chemother 17:139-46. 367
17. Maeda, H., C. Fujimoto, Y. Haruki, T. Maeda, S. Kokeguchi, M. Petelin, H. Arai,
368
I. Tanimoto, F. Nishimura, and S. Takashiba. 2003. Quantitative real-time PCR
369
using TaqMan and SYBR Green for Actinobacillus actinomycetemcomitans, 370
Porphyromonas gingivalis, Prevotella intermedia, tetQ gene and total bacteria. FEMS 371
Immunol Med Microbiol 39:81-6. 372
18. Mentula, S., T. Virtanen, A. Kanervo-Nordstrom, J. Harmoinen, E.
373
Westermarck, M. Rautio, P. Huovinen, and E. Kononen. 2006. Relatedness of
374
Escherichia coli strains with different susceptibility patterns isolated from beagle dogs 375
during ampicillin treatment. Int J Antimicrob Agents 27:46-50. 376
19. NCCLS. 2003. Methods for dilution antimicrobial susceptibility tests for bacteria that
377
grow aerobically; Approved standard-Sixt Edition - Document M7-A6. NCCLS, 378
Wayne, PA. 379
20. NCCLS. 2003. Performance Standards for Antimicrobial Susceptibility Testing;
380
Thirteenth Informational Supplement- Document M100-S13 (M7) for use with 381
document M7-A6-MIC testing. NCCLS, Wayne, PA. 382
21. Paterson, D. L. 2006. Resistance in gram-negative bacteria: Enterobacteriaceae. Am J
383
Infect Control 34:S20-8; discussion S64-73. 384
22. Paterson, D. L., and R. A. Bonomo. 2005. Extended-spectrum beta-lactamases: a
385
clinical update. Clin Microbiol Rev 18:657-86. 386
23. Phillips, I. 1998. The 1997 Garrod Lecture. The subtleties of antibiotic resistance. J
387
Antimicrob Chemother 42:5-12. 388
24. Phillips, I., M. Casewell, T. Cox, B. De Groot, C. Friis, R. Jones, C. Nightingale,
389
R. Preston, and J. Waddell. 2004. Does the use of antibiotics in food animals pose a
390
risk to human health? A critical review of published data. J Antimicrob Chemother 391
53:28-52.
25. Poole, K. 2004. Resistance to beta-lactam antibiotics. Cell Mol Life Sci 61:2200-23.
393
26. Salyers, A. A., A. Gupta, and Y. Wang. 2004. Human intestinal bacteria as
394
reservoirs for antibiotic resistance genes. Trends Microbiol 12:412-6. 395
27. Smith, M. S., R. K. Yang, C. W. Knapp, Y. Niu, N. Peak, M. M. Hanfelt, J. C.
396
Galland, and D. W. Graham. 2004. Quantification of tetracycline resistance genes in
397
feedlot lagoons by real-time PCR. Appl Environ Microbiol 70:7372-7. 398
28. Sorum, H., and M. Sunde. 2001. Resistance to antibiotics in the normal flora of
399
animals. Vet Res 32:227-41. 400
29. Sullivan, A., C. Edlund, and C. E. Nord. 2001. Effect of antimicrobial agents on the
401
ecological balance of human microflora. Lancet Infect Dis 1:101-14. 402
30. Sunde, M., K. Fossum, A. Solberg, and H. Sorum. 1998. Antibiotic resistance in
403
Escherichia coli of the normal intestinal flora of swine. Microb Drug Resist 4:289-99. 404
31. Tenover, F. C. 1989. DNA probes for antimicrobial susceptibility testing. Clin Lab
405
Med 9:341-7. 406
32. Welling, P. G. 1989. Effects of food on drug absorption. Pharmacol Ther 43:425-41.
407
33. Wiuff, C., J. Lykkesfeldt, O. Svendsen, and F. M. Aarestrup. 2003. The effects of
408
oral and intramuscular administration and dose escalation of enrofloxacin on the 409
selection of quinolone resistance among Salmonella and coliforms in pigs. Res Vet Sci 410
75:185-93.
411
34. Yan, S. S., and J. M. Gilbert. 2004. Antimicrobial drug delivery in food animals and
412
microbial food safety concerns: an overview of in vitro and in vivo factors potentially 413
affecting the animal gut microflora. Adv Drug Deliv Rev 56:1497-521. 414
35. Yu, Z., F. C. Michel, Jr., G. Hansen, T. Wittum, and M. Morrison. 2005.
415
Development and application of real-time PCR assays for quantification of genes 416
encoding tetracycline resistance. Appl Environ Microbiol 71:6926-33. 417
FIGURE LEGENDS
418
419
FIG. 1. Standard curves calculated with the control plasmid diluted in Tris -EDTA buffer (
●
) 420or in DNA extracted from swine feces (
♦
). Amplification was repeated four times for each 421dilution. 422
423
FIG. 2. a) Percentage of ampicillin resistant Enterobacteriaceae for each mode of ampicillin 424
administration. These percentages were calculated from the total counts of 425
Enterobacteriaceae in the absence or presence of ampicillin (16 µg/mL). b) Percentage of
426
ampicillin-resistant E. coli (i.e. with MIC above 16 µg/mL), for each mode of ampicillin 427
administration. Ampicillin susceptibility was tested at each sampling point on 20 isolates 428
from each pig. Treated pigs had received ampicillin at 20 mg/kg from day 0 to day 6 by 429
intramuscular route (▲) (n=4), oral route in fasted (
■
) (n=4) or fed (□
) (n=4) pigs. 6 pigs 430were used as a control (
●
). Values are means and error bars represent standard deviations. 431432
FIG. 3. Copy number of blaTEM genes per g of feces detected by real-time PCR for each pig.
433
Ampicillin was administered at 20 mg/kg from day 0 to day 6. Modes of administration were: 434
a) oral route in fed pigs (n=4), b) oral route in fasted pigs (n=4), c) intramuscular route (n=4). 435
d) 6 pigs were used as a control. 436
437
FIG. 4. Copy number of blaTEM genes per g of feces for each mode of ampicillin
438
administration. Treated pigs had received ampicillin at 20 mg/kg from day 0 to day 6 by 439
intramuscular route (▲) (n=4), oral route in fasted (
■
) (n=4) or fed (□
) (n=4) pigs. 6 pigs 440were used as a control (
●
). Values are means and error bars represent standard deviations. 441442
FIG. 5. Relationship between the log of the blaTEM copy number/g feces and the log of counts
443
of ampicillin-resistant Enterobacteriaceae /g of feces. 444
FIGURE 1 446 447 10 15 20 25 30 35 0 1 2 3 4 5 6 7
Log [copy number]
T h re sh o ld c y cl e (C t) 448 449 450
FIGURE 2 451 452 a) 0 20 40 60 80 100 120 0 1 2 3 4 5 6 7 Time (days) % a m p ic il li n r es is ta n t E n te ro b a c te r ia c e a e b) 0 20 40 60 80 100 120 0 1 2 3 4 5 6 7 Time (days) % a m p ic il li n r e si st a n t E . c o li 453 454 455 456
FIGURE 3 457 458 b) 0 1 2 3 4 5 6 7 1 E+5 1 E+3 1 E+7 1 E+9 c) 0 1 2 3 4 5 6 7 Time (days) 1 E+5 1 E+3 1 E+7 1 E+9 a) 0 1 2 3 4 5 6 7 1 E+5 1 E+3 1 E+7 1 E+9 d) 0 1 2 3 4 5 6 7 Time (days) 1 E+5 1 E+3 1 E+7 1 E+9 co p ie s o f b la T E M / g o f fe ce s 459 460
FIGURE 4 461 462 0 1 2 3 4 5 6 7 Time (days) co p ie s o f b la T E M / g o f fe ce s 1 E+4 1 E+5 1 E+6 1 E+7 1 E+8 1 E+9 1 E+10 463 464 465
FIGURE 5 466 467 R2 = 0.67 3 4 5 6 7 8 9 10 11 12 3 5 7 9 11
Log (blaTEM/g of feces)
L o g ( a m p ic il li n r es is ta n t E n te r o b a c te r ia c e a e /g o f fe ce s) 468 469 470