HAL Id: inria-00428972
https://hal.inria.fr/inria-00428972
Submitted on 30 Oct 2009
HAL is a multi-disciplinary open access
archive for the deposit and dissemination of
sci-entific research documents, whether they are
pub-lished or not. The documents may come from
teaching and research institutions in France or
abroad, or from public or private research centers.
L’archive ouverte pluridisciplinaire HAL, est
destinée au dépôt et à la diffusion de documents
scientifiques de niveau recherche, publiés ou non,
émanant des établissements d’enseignement et de
recherche français ou étrangers, des laboratoires
publics ou privés.
Automated Behavioral Fingerprinting
Jérôme François, Humberto Abdelnur, Radu State, Olivier Festor
To cite this version:
Jérôme François, Humberto Abdelnur, Radu State, Olivier Festor. Automated Behavioral
Finger-printing. 12th International Symposium on Recent Advances in Intrusion Detection - RAID 2009, Sep
2009, St Malo, France. �10.1007/978-3-642-04342-0_10�. �inria-00428972�
Automated Behavioral Fingerprinting
J´erˆome Fran¸cois12, Humberto Abdelnur1, Radu State3, and Olivier Festor1 1
MADYNES - INRIA Nancy-Grand Est, France – {firstname.lastname}@loria.fr
2
CNRS, Nancy-Universit´e, France
3
University of Luxembourg, Luxembourg – [email protected]
Abstract. This paper addresses the fingerprinting of devices that speak a common, yet unknown to the fingerprinting engine, protocol. We con-sider a behavioral approach, where the fingerprinting of an unknown protocol is based on detecting and exploiting differences in the observed behavior from two or more devices. Our approach assumes zero knowl-edge about the syntax and state machine underlying the protocol. The main contribution of this paper consists in a two phased method. The first phase identifies the different message types using an unsupervised support vector clustering algorithm. The second phase is leveraging re-cent advances in tree support kernel in order to learn and differentiate different implementations of that protocol. The key idea is to represent behavior in terms of trees and learn the distinctive subtrees that are specific to one particular device. Our solution is passive and does not assume active and stimulus triggered behavior templates. We instanti-ate our solution to the particular case of a VoIP specific protocol (SIP) and validate it using extensive data sets collected on a large size VoIP testbed.
1
Introduction
Over the past few years, there has been an increased effort in the research com-munity towards the automated analysis and reverse engineering of network pro-tocols. The driving forces are multiple and range from practical needs to analyze network traffic generated by malware where the most notorious case is the Storm bot and up to the development of open source implementation for poorly doc-umented protocols, as it was the case of the SMB protocol [1] for example. A related problem is the automated and passive fingerprinting of devices using an unknown protocol. While some research efforts in this direction have been recently made in [2] in order to learn the syntax and grammar that generated the protocol messages, to our knowledge, none until now has addressed the au-tomated learning of the specific behavior of a protocol in order to fingerprint a device or a protocol stack. [3] and [4] are close and complementary works as they aim to learn an unknown protocol to automatically respond to requests. The research challenges that we face are related to learning the relevant protocol operations/primitives and modeling the protocol message sequences such that automated learning is possible. If packet captures from an unknown protocol are given, we aim first to automatically discover the unknown types of messages. We
assume furthermore that no learning set with labeled protocol messages exists, that no encryption is used and that no reverse engineering of the application using such a protocol is possible. We also assume that the number of different message types is a-priori unknown.
Reverse engineering of network protocols is clearly related to the security problem since understanding the protocols is a necessary step for detecting pro-tocol misuse. In addition, fingerprinting is a useful task in the security domain. For an attacker, fingeprinting is a prior work for performing efficient attacks. For a network administrator, it is a tool for security assessment and testing.
The two contributions presented in this paper are:
– the automated analysis of protocols with respect to the types of messages exchanged based on unsupervised learning methods. For instance, if we con-sider a stripped-off ICMP version, an ICMP echo request message has to be answered by an ICMP echo reply message; assuming that a collection of captured messages is available, our approach should automatically discover that several types of messages exist (ICMP echo request and ICMP echo reply). Thus, our technique can be used as an essential preprocessing phase to the automated learning of the protocol related state machine;
– the learning of the device/stack specific behavior that results from recon-structing/reverse engineering a state machine for a device under test. In the previous example of ICMP for instance, it may be possible to detect a specific device by peculiar behavior related features. Although ICMP is a simple protocol, a large and comprehensive research work [5] (using mostly manual and tedious tests) showed that reliable fingerprinting is possible. We address a new and automated research direction that leverages support vec-tor machines and tree kernels for learning structural behavior features of the underlying protocol.
The paper is structured as follows: related work is analyzed in the next section; the SIP protocol that we use as the first application case is described in the third section; the different metrics to classify the messages are presented in section 4. Message types identification methods and results are described in section 5. Section 6 focuses on the behavioral fingerprinting. Finally, the last section concludes the paper and sketches future research directions.
2
Related works
Automatically recognizing the different messages of a protocol without prior knowledge is a challenging task. This is one part of the reverse protocol engi-neering goals which also aims to clearly infer the syntax and grammar of messages i.e., the different fields. Historically, the first technique available was hand-based analysis of dump files provided by packet sniffing software like tcpdump [6]. Ob-viously, this technique is tedious, limited and very time consuming. Therefore, new methods appeared. The Protocol Informatics project [7] proposes a solution
which uses well known bioinformatics algorithms and techniques based on se-quence alignment. Given a set of messages protocols, the program tries to deter-mine both constant and variable fields. Several approaches consider the context semantics i.e., the target computer behavior itself: [2] looks for extracted bytes in the message to rebuild the different fields; [8] is based on the execution trace i.e., system calls; [9] proposes a dynamic binary analysis to identify separators and keywords; [10] introduces a semi-supervised learning method to determine the message fields. Closer to our goal, an approach to cluster the messages cap-tured on the network by types before trying to infer their format is proposed in [11]. To achieve this clustering, the authors propose to tokenize each message i.e., to find the different fields by considering that each binary bytes is a binary token and that each text sequence between two binary bytes is a field. The tech-nique proposed in [12] is also based on identifying the different fields thanks to a delimiter. This is done by instrumenting the protocol application by studying how the program parses the messages. [13] focuses more on the state machine construction of multiple flows protocol. Application dialog replay is a very close domain since its goal is to construct a valid replay dialog by identifying the contents which need to be modified thanks to sequence alignment techniques [3] or by building a model from application inputs and outputs [14]. ScriptGen [4] is another approach which is able to construct the partial state-machine of a protocol based on network traces in order to automatically generate responses to attacker requests sent to a honeypot. Network and service fingerprinting is a common task is security assessment, penetration testing and intrusion detection. The key assumption is that subtle differences due to development choices and/or incomplete specification can trace back the specific device/protocol stack [15]. There are excellent tools that implement such schemes: p0f [16] uses TCP/IP fields to passively identify the signature of a TCP/IP stack, while nmap [17] does actively follow a stimulus-response test in order to detect the operating system and service versioning of a remote device. [18] aims to construct automatically the fingerprints by active probing. The research community has addressed the fingerprinting of SIP devices [19, 20] by automatically constructing message spe-cific fingerprints. In [21] and [22], the goal is a little bit different because the authors aim to correctly identify the flow types i.e., the protocols used. In a pre-vious contribution [23], we have addressed a syntax driven fingerprinting, where parse trees of captured messages were used to learn distinctive features capable to perform fingerprinting. In that study, we assumed that BNF [24] specifications are available and that individual messages can be used to infer vendor/stack spe-cific implementation characteristics. This is different from the current approach where no a-priori knowledge of the syntax is assumed. Secondly, we did not con-sider until now the behavioral aspects for the fingerprinting task. In this paper we do consider the latter and we leverage differences in induced state machines in order to perform fingerprinting.
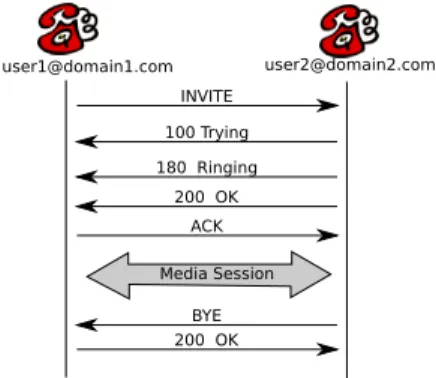
Fig. 1.SIP transaction example
3
Session Initiation Protocol (SIP)
SIP [25] is the de-facto signalisation protocol for the management of VoIP com-munications. Its main features are related to the establishment, tear-down and negotiation of VoIP sessions and it comprises a rich set of protocol primitives and options as well as a complex underlying state machine. We consider SIP to illustrate our approach for several reasons. Firstly, the number of operations is relatively important (more than 10). Secondly, due to its design, a clear de-limitation of transport level information and network level information does not exist, thus making the automated analysis difficult. Thirdly, the distribu-tion of individual message types is quite unbalanced: some message types ap-pear very rarely such that small sided and under-represented classes have to be dealt with. Although a complete overview of SIP is beyond the scope of this paper, a short introduction is given below. SIP messages are divided into two categories: requests and responses. Each request begins with one of the fol-lowing keywords: REGISTER, OPTIONS, INVITE,UPDATE, CANCEL, ACK, BYE, SUBSCRIBE, NOTIFY, PRACK, PUBLISH, INFO, REFER, MESSAGE. The SIP re-sponses begin with a numerical code of 3 digits divided into 6 classes identified by the first digit.
A SIP transaction is illustrated in the figure 1. It is an usual example when [email protected] wants to call [email protected]. So user1 initiates the connection by sending an INVITE request. First, the callee user2 informs that it receives the request and will try to achieve its by the Trying message. The Ringing message means that the user is alerted of the incoming call. When user2 decides to accept the call, the OK response is sent. The caller acknowledges this one and the media session over RTP (Realtime Transport Protocol) [26] is established. Finally, user2 hangs the phone, a BYE message is sent and the other party send an OK response to accept the ending of the session. Obviously, many details are omitted like the negotiation of parameters.
We have built a dataset of 1580 SIP messages, generated using several phones coming from different manufacturers. In our traces we minded 27 different kinds
0 0.05 0.1 0.15 0.2 0.25
1-2000-OPTIONS1-1000-REGISTER1-4010-INVITE0-ACK0-NOTIFY1-1801-4070-BYE1-5010-INFO0-MESSAGE1-1831-4041-5031-4811-4861-2020-REFER1-6030-CANCEL1-4801-4150-PUBLISH1-487
SIP messages distribution
Fig. 2.SIP messages distribution
of message which are the most important and used in VoIP networks. Their empirical distribution is illustrated in figure 2.
Regarding SIP as a target protocol, we would like to be able to automatically identify the 27 types of messages and automatically build tools that can identify abnormal sequences which are not compliant with the protocol, but can be linked to a specific SIP stack and/or vendor. We had to use a known protocol (SIP) in order to be able to assess the accuracy and precision of our approach but it can be generalized towards any protocol. One of the key components is the differentiation among several method types with appropriate metrics.
4
Metrics and distances for protocol messages
Character distribution The character distribution d of a message is based on the statistical distribution of its characters. Intuitively, if two messages ma and
mb are of the same type, their distributions should be similar. The natural and
logical measure is the symmetric relative entropy or Kullback-Leibler divergence: char dist(ma, mb) = X i d(ma)ilog( d(ma)i d(mb)i ) +X i d(mb)ilog( d(mb)i d(ma)i ) (1) where i represents all possible characters.
Relative character distribution An alternative character distribution can be constructed to capture the relative character distribution of the message m: rel char dist. It is based on the distribution of characters but can deal with simple enciphering schemes like for example the per character XOR encryption. It uses an ordered distribution [27] of the character frequencies. Thanks to this metric we have:
Character position A third metric that can be associated to each message is the character position. Basically, each message of a protocol has different fields and each message of the same type usually has common field filled with similar content. Therefore, the character at a certain position is often the same for a cer-tain type of message. This metric char pos(m) determines the average position of each character of the message m:
char pos(m)(c) = Pi=k
i=1pos(ai)
k (3)
where i is the index of the character c with k occurrences in the message and pos() the function returning the position of the index of a given character. Weighted character position Most protocol messages are formed by a header containing the type of the message followed by options, arguments and an addi-tional payload. This comes from good and established protocol design patterns. The weighted char pos(m) balances more the first characters:
∀ character c occurring k times, p2(m)(c) =
Pi=k
i=1pos(ai)−1
k (4)
The key assumption is that messages of the same types should start with similar headers even if the message contents are totally different.
5
Automated protocol clustering
Using the previously defined metrics, we derive an unsupervised clustering method that combines two clustering methods in order to determine the number of differ-ent messages types. The first technique is a new method relying on unsupervised support vector clustering [28]. The second method is based on the well known agglomerative nearest neighbor method [29]. This last technique considers each data point as an individual cluster. The two clusters with the smallest inter-distance are merged into one. Then, this step is repeated until the smallest inter-distance is higher than a threshold t.
5.1 Support vector clustering
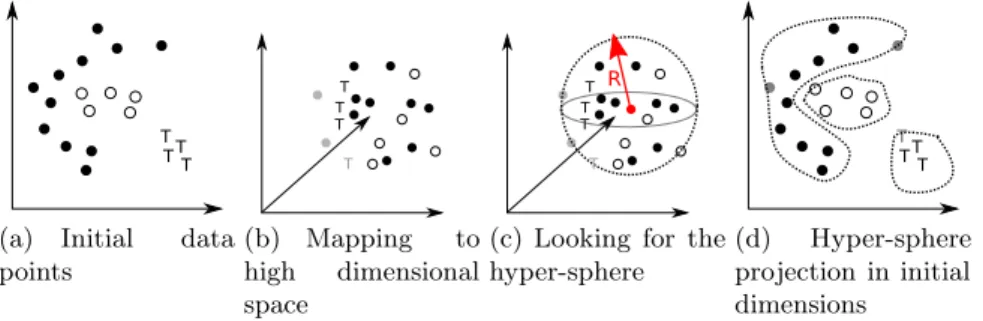
The support vector clustering (SVC) technique has been introduced in [28] and leverages machine learning paradigms based on support vector machines (SVM) [30] techniques. Such techniques show good accuracy with a limited overhead in different domains [31]. The initial data points 3(a) are mapped from the input space to a high dimensional space using a non linear transformation 3(b). The goal is to find the smallest sphere which contains all the points in the high dimensional space 3(c). This sphere is mapped back to the original input space and forms a set of countours which are considered as the cluster boundaries 3(d). The final step determines the cluster of each point by checking which boundaries contain it.
(a) Initial data points
(b) Mapping to high dimensional space
(c) Looking for the hyper-sphere
(d) Hyper-sphere projection in initial dimensions
Fig. 3.SVC example
Consider Φ, a nonlinear transformation and {xi} the set of N points in the
original d-dimensional input space. The training phase consists of finding the smallest hyper-sphere containing all the transformed points i.e., {Φ(xi)} which
is characterized by its radius R and its center a. Therefore we have:
kΦ(xi) − ak2≤ R2 ∀i (5)
The original problem is casted into the Lagrangian form by introducing the lagrangian multipliers (βi and µi) and the penalty term (CPiξi):
L = R2−X i (R2+ ξ i− kΦ(xi) − ak2)βi− X i ξiµi+ C X i ξi (6)
In fact, the ξ terms are slack variables allowing some classification errors. Then, the problem is turned into its Wolfe dual form and the variables a and R are eliminated due to Lagrangian constraints.:
W =X i Φ(xi)2βi− X i,j βiβjK(xi, xj) (7)
where K(xi, xj) is typically defined by a Gaussian Kernel:
K(xi, xj) = e−qkxi−xjk
2
(8) where q is another parameter named Gaussian width.
Next, a labeling step has to determine the points that belong to the same clusters by a geometric approach. In fact, two points are considered of the same clusters if all the points on the segment between them in the original space are in the hypersphere in the high dimensional feature space.
5.2 Global method
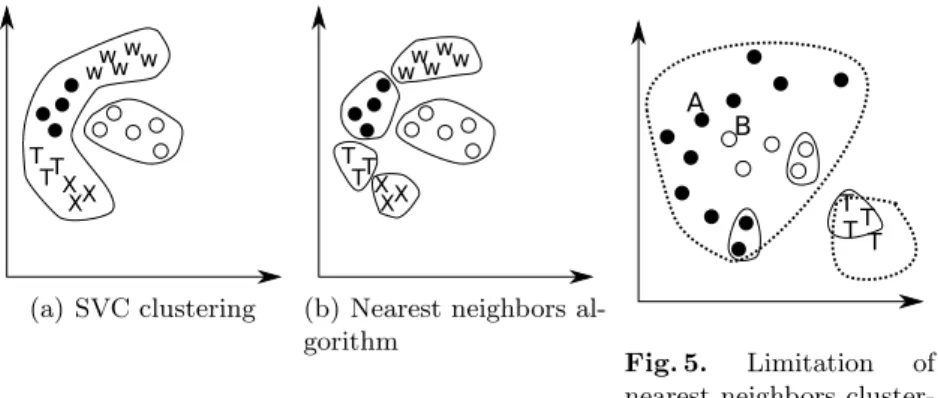
Even if SVC enables the discovery of intertwined clusters, the accuracy can be limited when a single shape comprises different clusters. The figure 4 shows such
(a) SVC clustering (b) Nearest neighbors al-gorithm
Fig. 4.Global Method
Fig. 5. Limitation of nearest neighbors cluster-ing
a case, where in figure 4(a), the SVC method is able to isolate two large clus-ters but none the single ones which composes the largest one. These constructed clusters can be furthermore split by an additional nearest neighbors technique for each of them. Hence, this second step is necessary. Obviously, it depends also on the data to classify and our experiments in the next sections show the ben-efits of the combination of these two methods. Furthermore, several multi-pass clustering methods exist and are introduced in [32]. Complex clusters bound-aries are discovered by the SVC technique. By applying the nearest neighbors technique, the result shown in figure 4(b) can be obtained. However, applying only the nearest neighbors technique will entail a bad classification as illustrated in figure 5. Therefore, we propose a global method which consists in two steps:
– a first clustering using SVC
– a second cluster splitting using nearest neighbors technique
5.3 Evaluation metrics
We consider several metrics in order to assess the quality of the clustering method Consider n messages to be classified, m1. . . mn, divided into r types and k
clusters found: c1. . . ck with k ≤ n. At the end of the classification, a label is
assigned to each cluster which is the predominant type of the messages within. However, only one cluster per type, the largest one, is allowed. If c(mi) represents
the cluster containing mithen t(mi) is the real type of the message miand t(ci)
is the type assigned to the cluster (ci).
The first metric is the classification rate cr and represents the ratio of mes-sages which are classified in the right clusters:
cr = P
i|t(mi)=t(c(mi))1
n (9)
The second metric is the proportion of different message types which were discovered:
cf = r
k (10)
The latter is a rather important metric because performing a good classi-fication rate can be easy by discovering the main types and ignoring unusual ones. In our dataset for instance, having a classification rate close to 100% can be obtained without discovering small clusters like 603, 480, 486, 487 as shown in figure 2. Some of these classes have only one recognized message. The classi-fication rate can also be computed for each type y:
crtype(y) = P i|t(mi)=yxi P i|t(mi)=y1 where xi= 1 if t(mi) = t(c(mi)) else 0 (11)
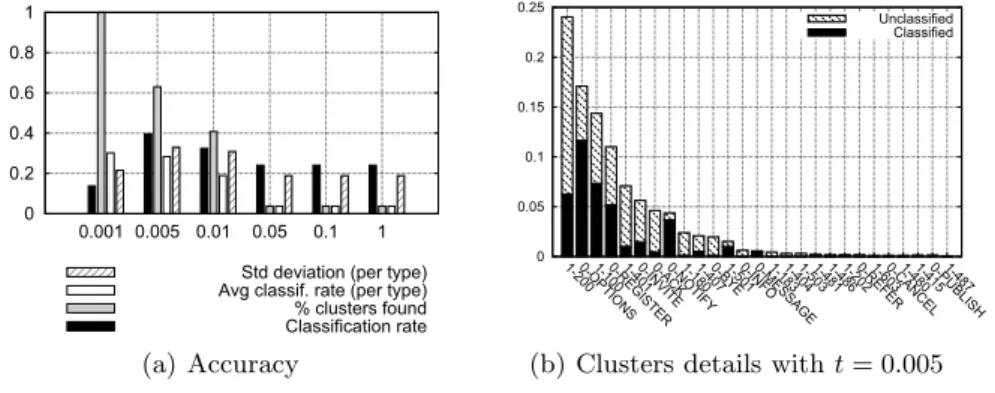
In practice we will consider the average value and the standard deviation by computing this metric for all possible kinds. Therefore, the classification accuracy has to be discussed regarding these different metrics. Because, several figures relate to the accuracy, a common key will be used and will be displayed only in figure 6(a). We analyze the composition of the different clusters with two metrics. The first one is the percentage of good classified messages which are contained in the considered cluster type. The second one is the percentage of messages of this type which are not present in the cluster.
5.4 Nearest neighbors technique results
We consider the first metric to be the relative character distribution. The results are presented on figure 6 where the parameter t varies. This parameter is the maximal distance authorized between two points. The best tradeoff between the classification rate and the number of clusters found is obtained for t = 0.005 on the figure 6(a). In this case, about 40% of messages are classified correctly and 60% of the types are found. This shows that for 40% of types the average classification rate is 0% and the standard deviation of the classification rate per type is relatively high. The third bar represents the average classification rate per type which is close to the global classification. The composition of the clus-ters is interesting since they are similar (see figure 6(b)). In fact, there is no type which is totally well classified. So each cluster contains a relatively high propor-tion of misclassified messages. t is the main parameter of the nearest neighbors algorithm and does have a high impact on the accuracy (see figure 6(a)). When t increases, less clusters are found because the maximum distance between two points of a cluster is increased and so the cluster sizes are larger. Hence, when t increases, the clusters are merged. The classification rate variation is less obvious: when t increases, it begins by increasing and followed by a decrease. The reason is correlated to the number of clusters. With a small t, the cluster sizes are small too leading messages of the same types to be split into multiple clusters. This entails a bad classification rate because only the biggest one is considered for each kind. When t increases, the clusters are merged, especially many clusters
0 0.2 0.4 0.6 0.8 1 0.001 0.005 0.01 0.05 0.1 1
Classification rate% clusters found Avg classif. rate (per type) Std deviation (per type)
(a) Accuracy 0 0.05 0.1 0.15 0.2 0.25
1-2000-OPTIONS1-1000-REGISTER1-4010-INVITE0-ACK0-NOTIFY1-1801-4070-BYE1-5010-INFO0-MESSAGE1-1831-4041-5031-4811-4861-2020-REFER1-6030-CANCEL1-4801-4150-PUBLISH1-487
Classified Unclassified
(b) Clusters details with t = 0.005
Fig. 6.Relative character distribution results
of the same kind. Then, clusters of different types can be grouped into one and in this case all messages of one type are missclassified in the new cluster which decreases the classification rate.
The next experiment is based on the character distribution which captures the information in the characters. To limit the effect of the zero values, the results using the smoothing distribution is presented on the figure 7. We checked with other experiments that the smoothing technique has a low impact on the classification rate but allows to discover easily more kinds of message. Comparing the relative character distribution results, they are not significantly improved except for the number of clusters found: about 90% with a classification rate of about 40% (t = 0.05). The number of found clusters is better with the same classification rate. This is confirmed by the increase of the average classification rate per type. This means that some small clusters are found too. Moreover, the associated standard deviation is reduced for the same reason.
0 0.2 0.4 0.6 0.8 1 0.01 0.05 0.1 0.3 0.7
Fig. 7.Smoothing character distribution results - Accuracy
The character position metric is accounting for that the first characters in a message are most probably relevant for the message identification. For instance, the INVITE message has two “I” in the first 7 bytes, and thus a good
0 0.2 0.4 0.6 0.8 1 0.1 1 10 (a) Accuracy 0 0.05 0.1 0.15 0.2 0.25
1-2000-OPTIONS1-1000-REGISTER1-4010-INVITE0-ACK0-NOTIFY1-1801-4070-BYE1-5010-INFO0-MESSAGE1-1831-4041-5031-4811-4861-2020-REFER1-6030-CANCEL1-4801-4150-PUBLISH1-487
Classified Unclassified
(b) Clusters details with t = 1
Fig. 8.Weighted characters position results
istic of this message is that this letter is more present at the beginning. However, an INVITE message contains basically a long payload formed with uri, param-eters and so on. It may also contain “I” because its length is much higher than the INVITE keyword. The weighted character position metric gives more impor-tance to first characters. The results plotted in figure 8(a) are very good as it is possible to find all the different kinds of message with a global and per type classification rate close to 85%. The details of the classification are illustrated in figure 8(b). In fact, the misclassified messages are shared out within several clusters which entails a small standard deviation for the classification rate per type on figure 8(b). So, increasing the accuracy has not to focus on single or few types of messages only.
5.5 SVC technique results
We applied the SVC method with different values for the Gaussian width q and the penalty factor C. The weighted character position metric is used because it is the best to differentiate the messages. As it is shown in the figure 9(a), the best possible accuracy is 0.73 for the classified messages with all types of messages found. This result is good but slightly lower than the nearest neighbors technique on figure 8 (85% of good classification). This is mainly due to a poor discovery of the smallest clusters because the standard deviation of the specific classification rate per type is higher. When the Gaussian width q increases between 0.1 and 1, the difference between the packets is emphasized in the high dimensional feature space. Hence, the messages clusters are more split and the accuracy is improved. However, when q is too high, the number of clusters continues to increase with redundant types. The number of found clusters is then still good but due to many redundant cluster types, the classification rate drops.
The cluster composition is interesting. In this case, the best accuracy provides clusters similar to the previous obtained in the figure 8 where all kinds of clusters are represented with a little proportion of missclassified messages inside each one. However, if we consider the case of C = 0.04 and q = 0.1 in figure 9(b)
(a) Accuracy 0 0.05 0.1 0.15 0.2 0.25
1-2000-OPTIONS1-1000-REGISTER1-4010-INVITE0-ACK0-NOTIFY1-1801-4070-BYE1-5010-INFO0-MESSAGE1-1831-4041-5031-4811-4861-2020-REFER1-6030-CANCEL1-4801-4150-PUBLISH1-487
Classified Unclassified
(b) Clusters details with q = 0.1
Fig. 9.Weighted characters position SVC results
with a lower accuracy, the clusters are totally different, all types are not found but for most of them, all messages are totally discovered. It means that these clusters represented by black bars contain also messages of other types because the latter ones are not classified in their own clusters -represented by stripes bar (unclassified). We apply the nearest neighbors technique on each cluster to split them. By looking for the best t value, we found t = 1.1 which allows to classify 91% of the messages and to discover 96% of the types of the message.
5.6 Other protocols
We have applied also our method to other protocols. We considered only the weighted character position metric because it provided the best results in the previous section. Two well known protocols were tested: SMTP [33] (150 packets and 10 types) and IMAP [34] (289 packets and 24 types). To ease the compari-son of results, a classical standardization of the data is done. When the nearest neighbors technique is applied, the classification rates are similar for these proto-cols -as shown in figure 11 - and less than 50% of the messages are well identified. The number of clusters found is better for SMTP. Moreover, using standardized data helps to choose the parameter t in order to obtain the best classification rate. Then t = 20 seems to be a good value to apply the nearest neighbors method with the standardized weighted character position metric.
The SVC method instantiated with the IMAP does not improve the cluster-ing accuracy since in the best case, only 36% of the messages are well classified. Hence, doing the second step with nearest neighbors technique is necessary and allows to obtain 49% of good classification. This is slightly better than the near-est neighbors technique as it was 47% on the figure 11. Obviously, this difference is very low but the number of different types found increases from 62% to 96% with SVC. Therefore, even if the combined method doesn’t improve the classifi-cation rate, it is able to keep the classificlassifi-cation rate stable and at the same time discovering more message types. The figure 10 shows the accuracy of SVC for
Fig. 10.SVC - SMTP dataset Fig. 11.Nearest neighbors clustering
the SMTP traffic. Since the nearest neighbors technique was able to find most of the types in figure 11, SVC can also find them. Moreover, the classification rate is greatly improved: 72% of messages are correctly identified and 80% of kinds are found. By applying the nearest neighbors technique on the obtained clusters, the results are very close because only one additional type is identified with one packet. Hence, the number of discovered types is 90%. The standard deviation of the classification rate per type is quite high (0.39) principally due to one type totally ignored in both cases.
5.7 Semi automated parameters identification
The assessing of the classification results for a known protocol is easy. The same is much more difficult with unknown because no reference exists. The first con-clusion of our study is that the standardized weighted character position metric is the most suitable. For SVC technique, there are two parameters: C and q. In our experiments C has not a great impact as it is highlighted in figure 10. This value is constrained by the SVC technique itself and we have β initi< C < 1 where
β initiare initial values of βi in the Wolfe dual form. These values can be
ran-domly selected since their impacts is only limited to the computation time. Their sum has to be one and we can choose β initi= β = 1/#number of data points.
In our case, the number of data points is the number of packets in the dataset. We can consider a minimal dataset size of 100 and so C = 0.2 or C = 0.3 are suitable. The parameter q is the Gaussian width and has a real impact on the classification. The aim of the SVC clustering is to obtain large clusters re-grouping several types within in. Then, the width of a classification instance is the width of the largest cluster. The width of a cluster is the maximal distance (depending on the metric used) between two points within it. For small values of q, all data points are regrouped into the same cluster and when it increases, they are split. Therefore, when the big clusters will be divided into several ones, if the width is about the same, there will be still a big cluster remaining. If
0 0.1 0.2 0.3 0.4 0.5 0 1 2 3 4 5 6 7 8 9 10 q evol_w(q) evol_c(q)
Fig. 12.SVC Gaussian width q selection (IMAP)
the width is different, the cluster has been really divided into several important ones. In the same time, the number of clusters has to increase more during this step. Considering p values of q: q1, q2, . . . , qp, the associated number of clusters
(#c(q1), . . . , #c(qp)) and the classification width (w(q1), . . . , w(qp)). To observe
the evolutions of these values, we define the following metrics where the division are required to have a value between 0 and 1:
evol c(qi) = |#c(qi) − #c(qi−1)| maxi(#c(qi)) if i > 1 else 0 (12) evol w(qi) = |w(qi) − w(qi−1)| maxi(w(qi)) if i > 1 else 0 (13)
These are plotted in the figure 12 for the IMAP protocol. Several peaks of evol w(q) exist, but the last one for q = 8.5 can be easily discarded because the number of clusters decreases in the same time. The second one is interest-ing since it represents the value selected by hand (q = 5.5) and the clusters number increases in the same time. This semi automated technique is able to find a good parameter. Finally, the first peak (q = 2) is not so high but it con-cerns simultaneously both metrics. By testing this value, the classification rate is slightly improved by reaching 50%. With others protocols, this approach is able to identify the same optimal parameters which were found by manual testing. Identifying optimal parameters for the nearest neighbors technique can be based on known techniques like [35].
To conclude, combination of weighted normalized position metric and SVC technique is often able to improve the recognition of the messages types. By doing a second phase based on the nearest neighbors technique, the results are always improved.
Fig. 13.Session example
(a) Device A (b) Device B
Fig. 14.Kernel trees
6
Behavioral Fingerprinting
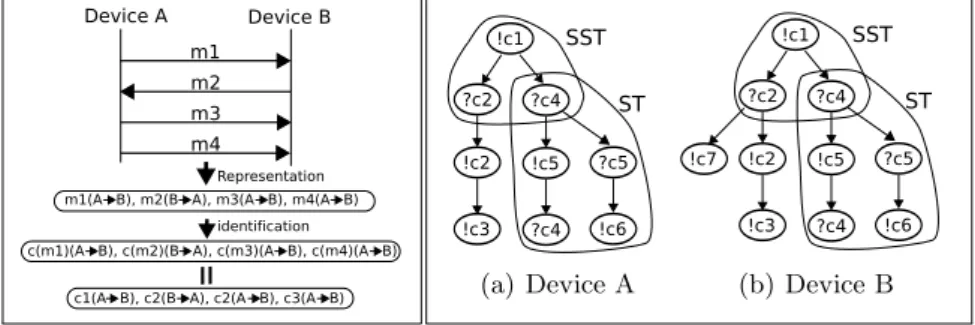
In order to best describe our approach, we will use the example illustrated in figure 13. The messages exchanged between two parties are captured first. Sec-ondly, each message can be mapped to the corresponding message type. This is done using the clustering mechanism described previously. Once each message is mapped to its cluster, a session of captured messages can be represented as a sequence of clusters. A session is composed of the messages exchanged between two entities without a relative long inactivity period. in fact, TCP based protocol sessions are easily distinguishable
The original sequence of messages can be mapped to the sequence of clusters: {m1(A → B), m2(B → A), m3(A → B), m4(A → B)}
≡ {c(m1)(A → B), c(m2)(B → A), c(m3)(A → B), c(m4)(A → B)}
≡ {c1(A → B), c2(B → A), c2(A → B), c3(A → B)}
≡ {!c1, ?c2, !c2, !c3}A→B
We use the notation ?x for a message x that is received and the notation !x to model that a message of type x is emitted by a device.
A second capture might consist in the sequence of messages (figure 13): {m5(A → B), m6(B → A), m7(A → B), m8(B → A)}
≡ {c(m5)(A → B), c(m6)(B → A), c(m7)(A → B), c(m8)(B → A)}
≡ {c1(A → B), c4(B → A), c5(A → B), c4(B → A)}
≡ {!c1, ?c4, !c5, ?c4}A→B
In the same manner, the final capture consists in the sequence: {!c1, ?c4, ?c5, !c6}A→B
Then a tree based representation can summarize them as follows: a simple algorithm adds incrementally a sequence to the tree. This is done by checking the longest prefix of the chain that is also a path sourced (in the root) in the tree. Starting with the last node in this path, the remaining suffix is added as a chain to the tree.
We construct for each device, a device specific trees - see figure 14. Each node in the tree corresponds to a message type. An edge in the tree links two nodes if the corresponding message types have been observed to succeed in the traces Although known to be NP complete (see [36],[37] and [38] for good overviews on this topic), the existing heuristics for doing it are based on building tree representations for the underlying finite state machine. In our approach we don’t prune the tree and although the final tree representation is dependent on the order in which we constructed the tree, we argue that the resulting substrees are good discriminative features. We follow a supervised training method, where protocol trees are labeled with the identity of their class. The identity of the class is assumed to be known. For instance, the figure 14(a) shows that based on traces, a node can start by sending an INVITE message (!c1) and receiving afterwards 180 (?c2) or 407 (?c4) typed messages. In SIP, a 180 typed message is used to learn that the call in in progress, while 400 messages are related to authentication requests.
The core idea behind behavioral fingerprinting consists in identifying subtrees in the underlying tree representations that can uniquely differentiate between two observed behaviors. We developed a classification method based on trees kernels in order to take into account the peculiar nature of the input space. Tree kernels for support vector machines have been recently introduced in [39], [40], [41] and do allow to use substructures of the original sets as features. These substructures are natural candidates to evaluate the similitude and differentiate among tree-like structures. We have considered two kernel types introduced in [42],[43] and [41]: the subtree (ST) kernel and the subset tree kernel (SST). Simply stated a subtree (ST) of a node is just the complete subtree rooted in that node. A subset tree corresponds to a cut in the tree - a subtree rooted in that node that does not include the original leaves of the tree. For instance, the figure 14 highlights some examples of similar SST and ST for two trees. Figure 14(a) represents a very simple tree corresponding to a Linksys SIP Phone. In the context of behavioral fingerprinting, a device specific protocol tree can be mapped to a set of ST and SST features by extracting all underlying SSTs and STs. Two protocol trees generated by two different devices (figure 14) can now be compared by decomposing each tree in its SSTs and STs followed by a pair-wise comparison of the resulted SSTs and STs. This can be done using tree kernels as proposed in [41]. The idea behind tree kernels is to count the number of similar SSTs in both features sets and/or check the exact matching of underlying STs. The interested reader is referred to [41] for more completeness and fast implementation techniques.
For our purposes, similar substructures correspond to similar behavior in terms of exchanged messages and represent thus a good measure of how much two devices are similar with respect to their behavior. We collected traces from a real VoIP testbed using more than 40 different SIP phones and SIP proxies. In the learning phase, we trained the support vector machines using a modi-fied version of the svm-light -TK [44] developed by Alessandro Moschitti. Our dataset consisted in complete SIP traces obtained during a one day capture
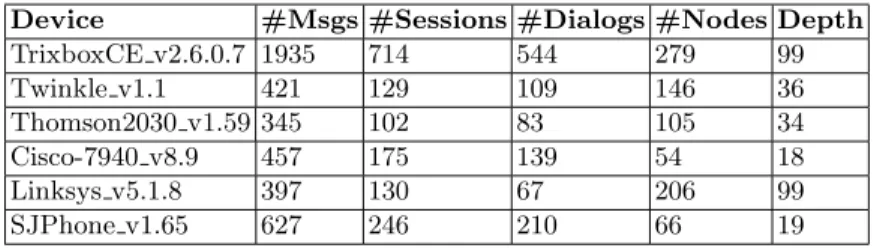
from a major VoIP provider. The capture file (8 GB) contained only the signal-ing SIP related data. Ussignal-ing the user-agent banner, we could identify 40 different end devices. We have also observed traffic coming from user-agents that were not identifiable. This latter is due probably to some topology hiding performed by home routers or session border controllers. For each device/user-agent we constructed the underlying tree representations using a maximum of 300 SIP dialogs. Therefore, devices that generated more than 300 dialogs, were tagged with more than one tree representation. We performed a multi-class classifica-tion using the one versus all method described in [41]. The classificaclassifica-tion precision was 80 % which is a relative promising result. This result was obtained using a 5 fold validation technique - one fifth of the data was taken out and used to assess the accuracy/precision of the system. The remaining four fifths of data was used to train the system. Table 1 summarizes a subset of the SIP devices used for training/testing. We could not include the complete table in the paper due to space constraints. However, the different columns of table 1 give a glance of the data samples and associated tree structures. For instance, the Tribox CE (a popular VoIP PBX) has a tree representation of depth 99 and 279 nodes. This was learned using 1935 messages split over 544 SIP dialogs.
Device #Msgs #Sessions #Dialogs #Nodes Depth TrixboxCE v2.6.0.7 1935 714 544 279 99 Twinkle v1.1 421 129 109 146 36 Thomson2030 v1.59 345 102 83 105 34 Cisco-7940 v8.9 457 175 139 54 18 Linksys v5.1.8 397 130 67 206 99 SJPhone v1.65 627 246 210 66 19
Table 1.Tested equipment
7
Conclusion and future work
We have addressed in this paper the automated fingerprinting of unknown pro-tocols. Our approach is based on the unsupervised learning of the types of mes-sages that are used by actual implementations of that protocol. The unsupervised learning method relies on support vector clustering - SVC. Our technique is using a new metric - the weighted character position metric. This metric is computed rapidly and does not suppose any knowledge about the protocols: header fields specification, number of messages. One main advantage of the SVC technique is its improvement of the accuracy of the classification for large datasets. We have also proposed a semi automated method that allows to choose the best parameters. The observed message types can be used to induce a tree-like rep-resentation of the underlying state machines. The nodes in this tree represent
the different types of observed messages and the edges do indicate an invocation relationship between the nodes. This first phase is completed by a second stage, where the behavioral differences are extracted and mined. This second phase uses tree kernel support vector machines to model the finite state machines in-duced from the first phase. The main novelty of this approach lies in the direct usage and mining of the induced state machines. We did test our approach on extensive datasets for several well known protocols: SIP, SMTP and IMAP. The observed empirical accuracy is very good and promising. We plan to extend this work towards other machine learning tasks and conceptual solutions. In addition, finding specific metrics for encrypted and binary protocols is another direction for future work.
Acknowledgments:We would like to thank Yann Guermeur, researcher at CNRS, for his support and feedback on the SVC specific implementation. This work was partially supported by the French National Research Agency under the VAMPIRE project ref#ANR-08-VERS-017.
References
1. Tridgell, A.: How samba was written http://samba.org/ftp/tridge/misc/french cafe.txt (accessed on 03/16/09)
2. Lin, Z., Jiang, X., Xu, D., Zhang, X.: Automatic protocol format reverse engi-neering through conectect-aware monitored execution. In: 15th Symposium on Network and Distributed System Security (NDSS). (2008)
3. Cui, W., Paxson, V., Weaver, N., Katz, R.H.: Protocol-independent adaptive replay of application dialog. In: Symposium on Network and Distributed System Security (NDSS). (2006)
4. Leita, C., Mermoud, K., Dacier, M.: Scriptgen: an automated script generation tool for honeyd. Computer Security Applications Conference, Annual (2005) 203–214 5. Arkin, O.: Icmp usage in scanning: The complete know-how, version 3 (June 2001)
accessed on 03/16/09.
6. tcpdump: http://www.tcpdump.org/ (accessed on 02/05/09)
7. Beddoe, M.: Protocol informatics, http://www.4tphi.net (accessed on 02/05/09) 8. Cui, W., Peinado, M., Chen, K., Wang, H.J., Irun-Briz, L.: Tupni: automatic
re-verse engineering of input formats. In: CCS ’08: Proceedings of the 15th ACM con-ference on Computer and communications security, New York, USA, ACM (2008) 391–402
9. Caballero, J., Yin, H., Liang, Z., Song, D.: Polyglot: automatic extraction of protocol message format using dynamic binary analysis. In: CCS ’07: Proceedings of the 14th ACM conference on Computer and communications security, New York, USA, ACM (2007) 317–329
10. Gopalratnam, K., Basu, S., Dunagan, J., Wang, H.J.: Automatically extracting fields from unknown network protocols (June 2006)
11. Weidong: Discoverer: Automatic protocol reverse engineering from network traces. 199–212
12. Wondracek, G., Comparetti, P.M., Kruegel, C., Kirda, E.: Automatic network protocol analysis. In: Proceedings of the 15th Annual Network and Distributed System Security Symposium (NDSS 08). (2008)
13. Shevertalov, M., Mancoridis, S.: A reverse engineering tool for extracting protocols of networked applications. (Oct. 2007) 229–238
14. Newsome, J., Brumley, D., Franklin, J., Song, D.: Replayer: automatic protocol replay by binary analysis. In: CCS ’06: Proceedings of the 13th ACM conference on Computer and communications security, New York, NY, USA, ACM (2006) 311–321
15. Douglas Comer and John C. Lin: Probing TCP Implementations. In: USENIX Summer. (1994) 245–255
16. : P0f. http://lcamtuf.coredump.cx/p0f.shtml 17. : Nmap. http://www.insecure.org/nmap/
18. Caballero, J., Venkataraman, S., Poosankam, P., Kang, M.G., Song, D., Blum, A.: FiG: Automatic Fingerprint Generation. In: The 14th Annual Network & Distributed System Security Conference (NDSS 2007). (February 2007)
19. Scholz, H.: SIP Stack Fingerprinting and Stack Difference Attacks. Black Hat Briefings (2006)
20. Yan, H., Sripanidkulchai, K., Zhang, H., yin Shae, Z., Saha, D.: Incorporating Active Fingerprinting into SPIT Prevention Systems. Third Annual VoIP Security Workshop (June 2006)
21. Ma, J., Levchenko, K., Kreibich, C., Savage, S., Voelker, G.M.: Unexpected means of protocol inference. In Almeida, J.M., Almeida, V.A.F., Barford, P., eds.: Internet Measurement Conference, ACM (2006) 313–326
22. Haffner, P., Sen, S., Spatscheck, O., Wang, D.: Acas: automated construction of application signatures. In: Proceedings of the 2005 ACM SIGCOMM workshop on Mining network data (Minet), New York, NY, USA, ACM (2005) 197–202 23. Abdelnur, H.J., State, R., Festor, O.: Advanced Network Fingerprinting. In:
RAID ’08: Proceedings of the 11th international symposium on Recent Advances in Intrusion Detection, Berlin, Heidelberg, Springer-Verlag (2008) 372–389 24. Crocker, D., Overell, P.: Augmented BNF for Syntax Specifications: ABNF. RFC
2234 (Proposed Standard) (1997)
25. Rosenberg, J., Schulzrinne, H., Camarillo, G., Johnston, A., Peterson, J., Sparks, R., Handley, M., Schooler, E.: SIP: Session Initiation Protocol. RFC 3261 (Pro-posed Standard) (2002) Updated by RFCs 3265, 3853, 4320, 4916, 5393.
26. Schulzrinne, H., Casner, S., Frederick, R., Jacobson, V.: RTP: A Transport Pro-tocol for Real-Time Applications. RFC 3550 (Standard) (2003) Updated by RFC 5506.
27. Kr¨ugel, C., Toth, T., Kirda, E.: Service specific anomaly detection for network intrusion detection. In: SAC ’02: Proceedings of the 2002 ACM symposium on Applied computing, New York, NY, USA, ACM (2002) 201–208
28. Ben-hur, A., Horn, D., Siegelmann, H.T., Vapnik, V.: Support vector clustering. Journal of Machine Learning Research 2 (2001) 125–137
29. Day, W.H., Edelsbrunner, H.: Efficient algorithms for agglomerative hierarchical clustering methods. Journal of Classification 1(1) (December 1984) 7–24
30. Cortes, C., Vapnik, V.: Support-vector networks. Machine Learning 20(3) (1995) 273–297
31. Wang, L., ed.: Support Vector Machines: Theory and Applications. Volume 177 of Studies in Fuzziness and Soft Computing. Springer (2005)
32. Berkhin, P.: A survey of clustering data mining techniques. In: Grouping Multi-dimensional Data. (2006) 25–71
33. Klensin, J.: Simple Mail Transfer Protocol. RFC 2821 (Proposed Standard) (April 2001) Obsoleted by RFC 5321, updated by RFC 5336.
34. Crispin, M.: Internet Message Access Protocol - Version 4rev1. RFC 3501 (Pro-posed Standard) (March 2003) Updated by RFCs 4466, 4469, 4551, 5032, 5182. 35. Salvador, S., Chan, P.: Determining the number of clusters/segments in hierarchical
clustering/segmentation algorithms. In: ICTAI ’04: Proceedings of the 16th IEEE International Conference on Tools with Artificial Intelligence, Washington, DC, USA, IEEE Computer Society (2004) 576–584
36. Rivest, R.L., Schapire, R.E.: Inference of finite automata using homing sequences. In: STOC ’89: Proceedings of the twenty-first annual ACM symposium on Theory of computing, New York, USA, ACM (1989) 411–420
37. Angluin, D.: Learning regular sets from queries and counterexamples. Inf. Comput. 75(2) (1987) 87–106
38. Schapire, R.E.: Diversity-based inference of finite automata. Technical report, Cambridge, MA, USA (1988)
39. Collins, M., Duffy, N.: New ranking algorithms for parsing and tagging: kernels over discrete structures, and the voted perceptron. In: ACL ’02: Proceedings of the 40th Annual Meeting on Association for Computational Linguistics, Morristown, NJ, USA, Association for Computational Linguistics (2002) 263–270
40. Vishwanathan, S., Smola, A.: Fast kernels on strings and trees. In: Proceedings of Neural Information Processing Systems. (2002)
41. Moschitti, A.: Making tree kernels practical for natural language learning. In: Proceedings of the Eleventh International Conference on European Association for Computational Linguistics. (2006)
42. Moschitti, A.: Efficient convolution kernels for dependency and constituent syn-tactic trees. In: ECML: Proceedings of the 17th European Conference on Machine Learning. (2006)
43. Moschitti, A., Pighin, D., , Basili, R.: Tree kernel engineering for proposition re-ranking. In: Proceedings of Mining and Learning with Graphs (MLG 2006). (2006)


![[The Yin and the Yang of senescence: is it possible to age without developing cancer?].](data:image/gif;base64,R0lGODlhAQABAIAAAP///wAAACH5BAEAAAAALAAAAAABAAEAAAICRAEAOw==)