HAL Id: hal-01427393
https://hal.archives-ouvertes.fr/hal-01427393
Submitted on 11 Jan 2017
HAL is a multi-disciplinary open access
archive for the deposit and dissemination of
sci-entific research documents, whether they are
pub-lished or not. The documents may come from
teaching and research institutions in France or
L’archive ouverte pluridisciplinaire HAL, est
destinée au dépôt et à la diffusion de documents
scientifiques de niveau recherche, publiés ou non,
émanant des établissements d’enseignement et de
recherche français ou étrangers, des laboratoires
Evaluation
Diemo Schwarz, Axel Roebel, Chunghsin Yeh, Amaury Laburthe
To cite this version:
Diemo Schwarz, Axel Roebel, Chunghsin Yeh, Amaury Laburthe. Concatenative Sound Texture
Synthesis Methods and Evaluation. 19th International Conference on Digital Audio Effects
(DAFx-16), Jiři Schimmel, Sep 2016, Brno, Czech Republic. pp.217-224. �hal-01427393�
CONCATENATIVE SOUND TEXTURE SYNTHESIS METHODS AND EVALUATION
Diemo Schwarz and Axel Roebel UMR STMS IRCAM - CNRS - UPMC
Paris, France
Chunghsin Yeh and Amaury LaBurthe AudioGaming
Toulouse, France
ABSTRACT
Concatenative synthesis is a practical approach to sound texture synthesis because of its nature in keeping realistic short-time sig-nal characteristics. In this article, we investigate three concatena-tive synthesis methods for sound textures: concatenaconcatena-tive synthesis with descriptor controls (CSDC), Montage synthesis (MS) and a new method called AudioTexture (AT). The respective algorithms are presented, focusing on the identification and selection of con-catenation units. The evaluation demonstrates that the presented algorithms are of close performance in terms of quality and simi-larity compared to the reference original sounds.
1. INTRODUCTION
Sound texture synthesis is an emerging research topic. It inspires to explore the physics and signal characteristics of sounds other than music and speech, and it also has a great potential to appli-cations in the film, broadcast and video game industries. Sound textures are generally understood as sound that is composed of many micro-events but have features that are stable on a larger time-scale, such as wind, rain, fire, stream, insects, crowd cheering or applause. In this work, we will focus on sounds generated by real-world physics such as environmental, mechanical, and crowd sounds. The imaginary ambiance sounds or creative texture-like sounds are therefore not within the context of this work.
Among existing sound texture synthesis methods [16], gran-ular synthesis is a relatively practical approach as it makes use of snippets of a sound recording, and thus inherits the short-time signal’s timbre which provides a shortcut to naturalness. Con-catenative synthesis can be seen as a particular kind of granu-lar synthesis [15] and we will be using this term to distinguish it from many commercial granular synthesis products that usu-ally generate sounds of different timbre than that of the original sounds. Since 2012, the authors have been working together on the French national project PHYSIS1: an industrial project focused on the modeling, transformation and real-time synthesis of diegetic sounds for interactive virtual worlds and augmented reality. The developed concatenative synthesis methods include: Concatena-tive Synthesis with Descriptor Controls (CSDC) controls transi-tions between segments using audio descriptors, thus preventing artefacts (section 2.1); Montage Synthesis (MS) analyzes energy evolution in multiple sub-bands and re-synthesizes a sound texture by means of replacing similar atoms to re-create the sequence of events (section 2.2); AudioTexture (AT) is an algorithm used in a commercial car engine sound synthesizer AudioMotors, which is originally designed to synthesize tire-rolling sound (section 2.3).
In this article, the main emphasis is laid on perceptual evalu-ation of concatenative synthesis methods for sound textures.
Per-1https://sites.google.com/site/physisproject
ceptual audio evaluation is a well understood topic [1], but the latest comprehensive survey of methods for sound textures [16] found only some previous work involving evaluation by percep-tual listening tests, e.g. [4, 6, 8]. Since then, listening tests have been more systematically carried out in the literature for sound textures [5, 7, 13, 18, 20] and general sound synthesis for vir-tual reality and gaming [10–12]. The evaluated use-case in this work is example-based sound textures extending an environmental sound texture recording for an arbitrary amount of time, even from varying (non-stable) recordings or periodic sounds, where looping would be easily detectable.
The article is organized as follows. We briefly introduce and compare the algorithms and discuss the respective advantages and disadvantages in section 2. Then, we present the listening test database and setup in section 3. The evaluation results are ana-lyzed and discussed w.r.t. the quality and similarity compared to the reference original sounds in section 3.3. Finally we draw con-clusions and present perspectives in section 4. Since this article focuses on the evaluation part, we will only describe the methods in general; readers are invited to consult the implementation details in the respective references.
2. METHODS
The principle of concatenative synthesis is to concatenate sound units in a random or controlled order. The sound units can be de-fined either by a fixed size (granular synthesis) or by more sophis-ticated analysis methods. The concatenation between two selected units is carried out by cross-fading using an analysis window such as hanning. The cross-fade shall result in smooth transition pro-vided that the selected units are of similar timbre characteristics at the boundary. For sound texture synthesis, the underlying events are usually evolving (energy, phase, modulation, etc.). Assuming that the events can be identified as consecutive units, we propose to study the identification and selection of sound units which help to reconstruct sound textures that preserve the perceptual quality of the original timbre and the underlying events.
2.1. Concatenative Synthesis with Descriptor Controls The CSDC method [18] is based on randomized granular playback with control of the similarity between grains using a timbral dis-tance measure based on audio descriptors. In previous work [18], this distance measure has been validated as generally superior to an MFCC-based timbral distance and to uncontrolled purely ran-domized playback. CSDC is based on corpus-based concatenative synthesis (CBCS) [15], that can be seen as a content-based ex-tension of granular synthesis, which allows unit (grain) selection controlled by audio descriptors.
In order to synthesize a varying texture without audible rep-etitions nor artefacts such as abrupt timbral or loudness changes, we use a timbral distance measure between the last played grain and all other grains as candidates, and randomly select a successor grain from the timbrally closest grains, thus generating a random walk through the timbral space of the recording, that never takes too far a step, but that potentially still traverses the whole space of variety of the recording.
The timbre is determined by the audio descriptors suggested by Schwarz and Caramiaux [17] with the addition of pitch. This choice has been validated by Schwarz and O’Leary [18]. The 6 in-stantaneous descriptors Loudness, FundamentalFrequency, Nois-iness, SpectralCentroid, SpectralSpread, SpectralSlope are ex-tracted with the IRCAMDESCRIPTOR library [14] and averaged over all frames of size 23 ms. To avoid too regular triggering of new grains, the duration and time of the played grains are ran-domly drawn within a 600–1000 ms range, and a random start off-set of +/- 200 ms is applied to each grain. Grains are overlapped by 200 ms, and an equal-power sinusoidal cross-fade is applied during the overlap.
2.2. Montage Synthesis
The MS algorithm [13] looks to exploit regions of similarity in the original texture to inform the sequencing of sampled elements. There are two levels to the synthesis model. Longer term sections, called segments, are used to model the higher level structure of textures. These segments are synthesized from the concatenation of shorter sections, called atoms.
In the analysis phase, sub-band energy envelopes are extracted based on perceptual criteria by using the ERB (Equivalent Rect-angular Bandwidth) scale and loudness-scale approximation. A time-frequency atom is defined by a duration of 100 ms such that it is long enough to enable the comparison of envelopes and short enough to allow variations in the synthesis phase. An envelope difference measure is proposed to measure the similarity between atoms (local texture structure) and to derive the segments (long term evolution). Based on a statistical model, the sequences of both the segments and atoms are automatically re-synthesized to avoid repetition. A new overlap-add method is also proposed based on frequency-dependent cross-fading length and position in the spectral domain. In principle, the cross fade region is taken to be 4 times the inverse of the bin center frequency, and the possibly different cross-fade position for each bin minimize phase discon-tinuities. This enables concatenation with short overlap without introducing perceptible modulations.
2.3. AudioTexture
The goal of AudioTexture (AT) is to allow sound designers to make use of any sound texture recordings available and re-create the same sound textures (with semantic controls) synchronous to video images for film/TV post-production and video games.
Principle:Similar to the concept of MS, we view sound tex-tures as composed of two levels of events: micro events (atoms) and macro events (segments). The assumption made here—that a segment boundary represents a new macro event—is essential to identify for good concatenation quality. The micro events are more difficult to handle for complicated textures like crowd cheer-ing/applauding, which will be addressed in future work. We as-sume that macro events will result in dominant energy variation
and thus can be identified from the local maxima of the energy en-velope. The boundary between two macro events (assumed to be deterministic) is then defined by the corresponding local minima. Since micro events may result in slight energy variation, the pro-posed AT algorithm aims to identify prominent local extrema as macro event units.
Method: Similar to several PSOLA (Pitch-Synchronous Overlap–Add) marker analysis algorithms [3], the analysis stage is based on detecting prominent local (energy) maxima as the po-sitions of macro events (glottal pulses in the case of speech). The density of local maxima can be understood as how often a macro event occurs, which in fact is related to the physical behaviors of sound textures. Since the event occurrence frequency varies for different sounds, we simply define a user parameter, minimum macro event duration, to avoid selecting spurious local extrema. Once the macro event units are identified, the synthesis stage uses the common cross-fade method with waveform similarity to refine the cross-fade position [21].
Implementation:In practice, we have found that, by means of low-pass filtering the signal using a biquad filter (gradual attenua-tion after the cutoff frequency), it is sufficient to obtain a smooth energy envelope of which the local maxima approximate the lo-cations of macro event positions. According to our experimen-tal tests, using a biquad filter of cutoff frequency at 20Hz and of bandwidth 0.3 seems to generalize well over a variety of sound textures. The other practical reason is that the components in the low frequency tend to evolve slowly and are thus more often re-lated in phase for a long-term evolution. The unit identification based on low-frequency emphasized signal seems to produce less perceptually-disturbing phase discontinuity (similar to the idea of MS’s frequency-dependent overlap-add treatment). The search of local maxima starts from the beginning of the processed signal. For each local maximum detected, the algorithm selects the largest local maxima within the intervals of minimum macro event dura-tion. The minimum duration of 1 s seems to be sufficiently large to generalize. This parameter should in future work be learned from annotated databases. To concatenate two units during synthesis, the cross-fade region is defined by a quarter of the unit size based on the shape of hanning window.
To summarize, the algorithm (1) searches for local amplitude maxima of the low-passed signal as the macro event positions (2) marks the related local minima (one-to-one correspondence) in the original signal as the macro event boundaries (3) concatenates by cross-fading the macro event units in a random order (or selected order). The algorithm is implemented in a commercial DAW (Dig-ital Audio Workstation) plugin AudioMotors Pro2for tire-rolling
mode synthesis. Although the product has been made available since 2013, we found that this simple idea has also been suggested in a recent granular synthesis algorithm [19]. AudioTexture is scheduled to be released as a sound design product with preset parameters adapted to different kinds of sound textures.
2.4. Baseline method
We have implemented a baseline method RND similar to Fröjd and Horner’s approach [4], which randomly concatenates sound units of sizes randomly drawn between 600 ms to 1 second with 200 ms overlap and equal-power sinusoidal cross-fade. This method is
2http://lesound.io/product/audiomotors-pro, free trials are available
Algorithm Units Analysis Synthesis
CSDC grains fixed size of 800ms without overlap descriptor similarity MS atoms/segments sub-band energy envelope difference sequence model AT segments energy evolution + minimum duration 1 s random order RND grains random sizes between 600 ms to 1 s random order Table 1: This table compares the analysis and synthesis phases of the proposed methods.
used to compare with the three proposed methods to evaluate the effectiveness of sound unit identification and selection.
2.5. Algorithm comparison
An overview of the three sound texture synthesis methods is shown in Table 1. The scale of the units are of the relation RND ≈ CSDC < MS < AT. Here we consider the scale of MS defined by its enve-lope because it imposes a constraint on the selection of the atoms. Like the usual granular synthesis, CSDC uses grain units of a fixed size that is sufficiently large to preserve the local structure gener-ated by micro events. The principal functionality of CSDC is unit selection based on descriptor similarity. RND randomizes both the unit size (close to the grain size of CSDC) and the unit selection. AT is using the largest unit scale (≥ 1 s) for macro events and there is no control strategy applied during the synthesis phase. MS models both micro events by atom units of a fixed size and macro events by segments. A statistical model of atom/segment sequenc-ing is further used at the synthesis stage. The order of complexity of the presented algorithms is RND < AT < CSDC < MS.
3. EVALUATION
The evaluation is carried out by web-based listening tests (see Fig-ure 1). In addition to the concatenative synthesis methods, we have added a signal-model based method SDIS based on spectral domain imposition of statistics [7]. This method is a more efficient implementation of the state-of-art signal-model based method pro-posed by McDermott and Simoncelli [8]. Since we assume that concatenative synthesis methods generally have the advantage over signal-model based methods in terms of quality, we have included this method for evaluation to verify if all the proposed methods do demonstrate their advantages.
3.1. Experiment setup
The algorithms presented above are evaluated in an ongoing lis-tening test accessible online3. The test database contains 27 sound
texture examples with equal duration of 7 seconds:
• 14 sounds used by McDermott et. al. in their previous stud-ies on sound texture perception [8]
• 13 sounds contributed by the PHYSIS project partner Game-AudioFactory4
They are carefully selected to cover a wide range of sound tex-tures generated by human, transportation, mechanical gears, ani-mals and natural elements (air, water and fire). Some of the sounds contain explicitly non-uniform environmental sound textures, i.e. containing some variation in texture and timbre, but not clearly
3http://ismm.ircam.fr/sound-texture-synthesis-evaluation 4http://gameaudiofactory.com
perceived as outlier events. They are meant to test an algorithm’s capability to re-synthesize slow evolution such as wind blowing. There are also periodic sounds that serve to test the algorithms’ capability to preserve the periodic structure without introducing jitter and phase discontinuities.
In the listening test, for each of the 27 sound examples in ran-domized order, the original is presented to the subject, and then 6 stimuli in randomized order: the resyntheses generated by the five algorithms (CSDC, MS, AT, RND and SDIS) and the original (ORIG) as hidden anchor. Subjects are asked to use a numerical slider between 0 and 100 to rate the stimuli according to the two criteria:
Quality: Presence of artefacts, such as abrupt loudness or timbral changes, cuts, repetitions, loops, distortions, etc. The scale is further divided into 5 levels: bad, poor, fair, good and excel-lent.
Similarity: Does the resynthsis sounds sufficiently credible like the variation of the original sounds ? The scale is further divided into 5 levels: very dissimilar, somewhat dissimilar, somewhat similar, quite similar and very similar.
3.2. Results
At the time of writing, 17 responders took the test (with 2 only providing partial data). All but 2 reported being familiar with per-ceptive listening tests, none reported hearing impairment. Age and gender information were not gathered. Figure 2 shows the ratings of quality and similarity (without any scaling). For each algorithm, the rating statistics are calculated over all responses and sounds. We also analyze ratings with respect to different sound classes ac-cording to local structure (stable, varying, periodic) in Figure 4 and sound content characteristics (noisy, pitched) in Figure 3: stable: local structure does not vary along time such as heavy rain
sounds (13 sounds)
varying: local structure slightly varies along time such as wind whistling sounds (11 sounds)
periodic: global structure is a repetition of local structure such as helicopter sounds (3 sounds)
noisy: sound does not contain pitched or harmonic components such as gas stove sounds (22 sounds)
pitched: sound contains pitched components such as crowd cheer-ing sounds (5 sounds)
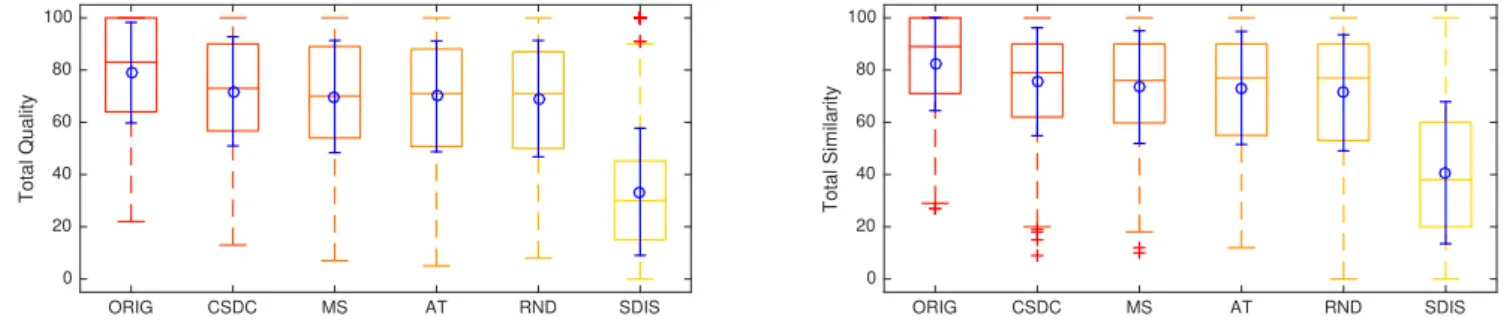
In general, ORIG ranks the best, which validates that the testers are doing a proper job. All the three concatenative synthesis meth-ods are rated in a close range around 80 (between quite similar to very similar). Surprisingly, RND is rated quite well and appears very competitive by the mean similarity measure. All concate-native methods are rated much better than SDIS, which confirms the expected advantages in sound texture synthesis. This seems to
Figure 1: An example of listening test web interface. ORIG CSDC MS AT RND SDIS Total Quality 0 20 40 60 80 100 ORIG CSDC MS AT RND SDIS Total Similarity 0 20 40 60 80 100
Figure 2: Box plots of the quality and similarity ratings per type of stimulus, showing the mean and standard deviation (blue circle and error bar), median (middle line), quartile range (box), min/max (whiskers), and outliers (crosses).
align with the result obtained in [4] where a concatenative synthe-sis method seems to be generally rated better than the signal-model based method based on wavelet trees [2].
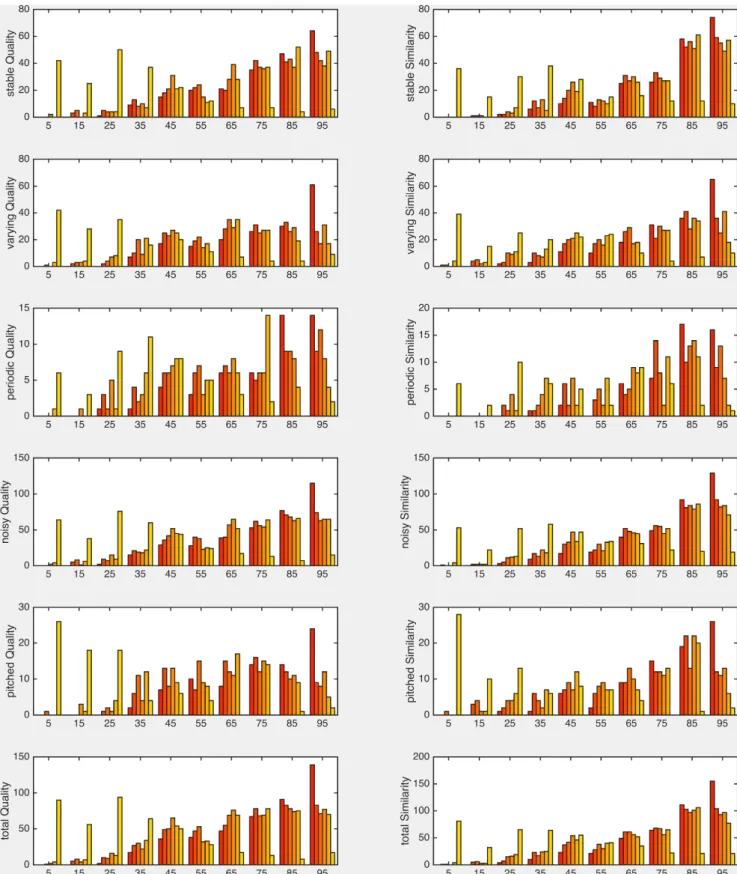
To test if the observed differences of ratings are significant or simply due to chance, further statistical analysis has been carried out. As Figure 5 shows, the ratings are not normally distributed, so that the Kruskal-Wallis non-parametric method [9] has been ap-plied instead of ANOVA (analysis of variance).5 Here the null
5However, McDonald [9] argues that one-way ANOVA is not very
sen-sitive to non-normal distributions, and indeed, ANOVA with Bonferroni correction gives very similar results in terms of significance of differences of pairs of means: The p-values are generally lower with ANOVA, but only very few passed under the significance threshold of 5%. We report here the more conservative Kruskal-Wallis results.
total ORIG CSDC MS AT RND SDIS ORIG — **** **** **** **** **** CSDC **** — **** MS **** — **** AT **** — **** RND **** — **** SDIS **** **** **** **** **** —
Table 2: Significance level for each pair of differences of means on quality (upper triangle) and similarity (lower triangle) ratings for total results.
hypothesis H0is that the ratings come from the same distribution
(and differences in means are thus due to chance), and the alter-native hypothesis HAis that the data comes from different
distri-butions. The significance levels of the p-values for each pair of comparisons are given in Tables 2–7 for the quality and similarity ratings. The significance level depending on the p-value is habitu-ally represented by a number of stars as follows:
Level * ** *** **** p ≤ 0.05 0.01 0.001 0.0001
stable ORIG CSDC MS AT RND SDIS
ORIG — * **** CSDC — **** MS — **** AT ** — **** RND — **** SDIS **** **** **** **** **** —
Table 3: Significance level for each pair of differences of means on quality (upper triangle) and similarity (lower triangle) ratings for stable sounds.
ORIG CSDC MS AT RND SDIS
Quality for noisy sounds
0 20 40 60 80 100 ORIG CSDC MS AT RND SDIS
Similarity for noisy sounds
0 20 40 60 80 100 ORIG CSDC MS AT RND SDIS
Quality for pitched sounds
0 20 40 60 80 100 ORIG CSDC MS AT RND SDIS
Similarity for pitched sounds
0 20 40 60 80 100
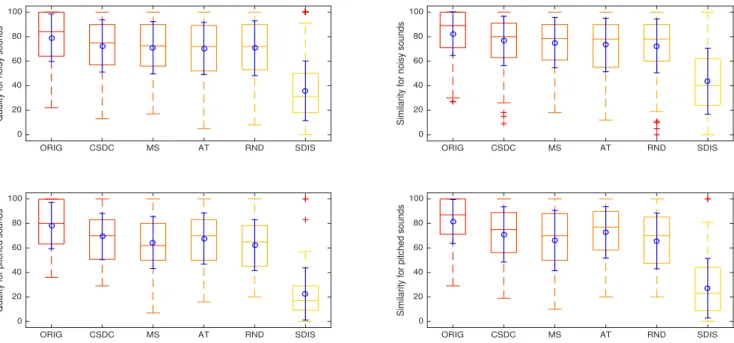
Figure 3: Box plots of the quality and similarity ratings for each sound character (noisy, pitched) per type of stimulus, showing the mean and standard deviation (blue circle and error bar), median (middle line), quartile range (box), min/max (whiskers), and outliers (crosses).
3.3. Discussion
The global results given in Table 2 show that, in general, all resyn-theses can be distinguished from the original. However, none of the concatenative synthesis based algorithms can be distinguished amongst each other (the null hypothesis that the differences in rat-ings are due to randomness can not be rejected). Yet, all concate-native synthesis algorithms can be reliably distinguished from the SDIS algorithm with p < 0.0001. The two latter points hold for all subsets of sounds in Tables 3–7.
varying ORIG CSDC MS AT RND SDIS ORIG — * **** ** **** **** CSDC ** — * **** MS **** — **** AT ** — **** RND **** * * — **** SDIS **** **** **** **** **** —
Table 4: Significance level for each pair of differences of means on quality (upper triangle) and similarity (lower triangle) ratings for varying sounds.
periodic ORIG CSDC MS AT RND SDIS
ORIG — ** **** CSDC — **** MS — **** AT ** — **** RND *** — *** SDIS **** **** **** *** ** —
Table 5: Significance level for each pair of differences of means on quality (upper triangle) and similarity (lower triangle) ratings for periodic sounds.
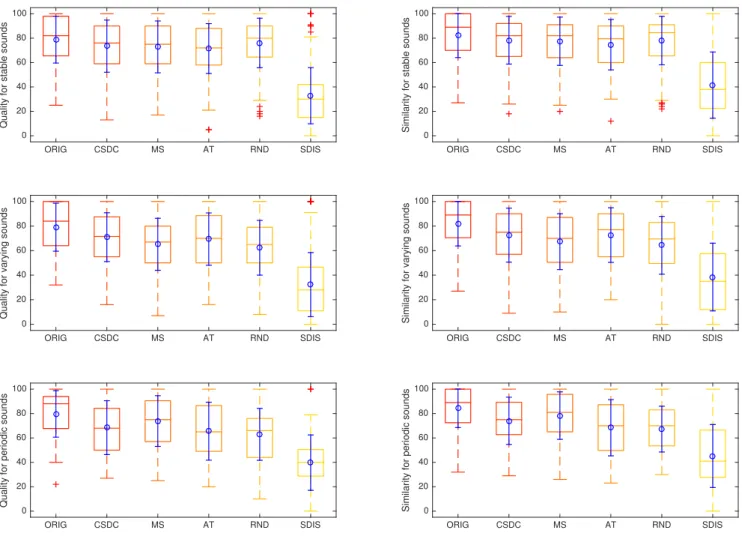
For stable sounds (Table 3, Figure 4 top), the granular resyn-theses (with the exception of AT but including RND) can not be distinguished from the original. For varying sounds (Table 4, Fig-ure 4 middle), CSDC is significantly better than RND, as well as AT for the similarity rating. For periodic sounds (Table 5, Figure 4 bottom), only RND can be distinguished from the original, as well as AT for the similarity rating. However, there are only 3 sounds in this class, so the results should be taken with care.
Noisysounds (Table 6, Figure 3 top) share the interpretation
noisy ORIG CSDC MS AT RND SDIS ORIG — ** **** **** **** **** CSDC ** — **** MS **** — **** AT **** — **** RND **** — **** SDIS **** **** **** **** **** —
Table 6: Significance level for each pair of differences of means on quality (upper triangle) and similarity (lower triangle) ratings for noisy sounds.
pitched ORIG CSDC MS AT RND SDIS
ORIG — ** *** **** CSDC — **** MS ** — **** AT — **** RND *** — **** SDIS **** **** **** **** **** —
Table 7: Significance level for each pair of differences of means on quality (upper triangle) and similarity (lower triangle) ratings for pitched sounds.
ORIG CSDC MS AT RND SDIS
Quality for stable sounds
0 20 40 60 80 100 ORIG CSDC MS AT RND SDIS
Similarity for stable sounds
0 20 40 60 80 100 ORIG CSDC MS AT RND SDIS
Quality for varying sounds
0 20 40 60 80 100 ORIG CSDC MS AT RND SDIS
Similarity for varying sounds 0 20 40 60 80 100 ORIG CSDC MS AT RND SDIS
Quality for periodic sounds
0 20 40 60 80 100 ORIG CSDC MS AT RND SDIS
Similarity for periodic sounds 0 20 40 60 80 100
Figure 4: Box plots of the quality and similarity ratings for each sound class (stable, varying, periodic) per type of stimulus, showing the mean and standard deviation (blue circle and error bar), median (middle line), quartile range (box), min/max (whiskers), and outliers (crosses).
for global results: all resyntheses can be distinguished from the original and from SDIS. For pitched sounds (Table 7, Figure 3 bottom), CSDC and AT can not be significantly distinguished from the original.
In general, the proposed concatenative synthesis methods ob-tain slightly better ratings than RND, although the differences are not significant, except for the sound classes of varying sounds, where CSDC and AT (for similarity only) have significantly (with p < 0.05) better ratings. We may summarize the advantages of the concatenative algorithms as follows:
CSDC: Unit selection based on descriptor similarity is very effec-tive provided that the unit size is fixed. That is, the descriptors characterize well the units such that the selected units follow a credible sequence even for time-varying sound textures: it shows its strength for stable, periodic, and pitched sounds, where it can not be distinguised significantly from the origi-nal, and for varying sounds, where the distinction is less sig-nificant than for the other methods. For varying sounds, it is significantly better than RND.
MS: The statistical sequence modeling is very effective for stable and periodic (almost identical to ORIG) sounds with a fixed
atom size and varying segment length. However, it tends to have less favorable rating for varying sounds. This could pos-sibly be improved by parameter refinement to allow longer evolution of macro events (segments).
AT: The unit analysis is quite promising provided its simplicity. Since there is no treatment to handle unit selection, it may result in less satisfying quality for varying sounds such as lap-ping waves and crowd cheering sounds, and its statistically significant difference to the original for stable sounds shows that there is room for improvement.
4. CONCLUSION
We have evaluated the proposed concatenative methods for sound texture synthesis, each of different degrees of complexity (RND: simple random choice, AT: random choice with simple unit iden-tification, CSDC: unit selection by sound descriptors, MS: unit (segment) identification, sequence modeling and matching). Us-ing a database of sound texture examples relevant to gamUs-ing and multimedia applications, the evaluation results had little difference in their mean ratings. The proposed three concatenative synthesis
methods appear to be slightly advantageous to the baseline method RND. A finer analysis of the results sound-by-sound is yet to be carried out, which may reveal edge cases that lead to more in-sights on what treatment is necessary for different types of sound textures and eventually an improvement of the design of the eval-uation database. Since the differences in quality/similarity among proposed methods are generally not statistically significant, one may need to design objective evaluation measures. For example, a good concatenative synthesis should generate high quality sound textures while shuffling a lot the units that do not follow their orig-inal order. That is, the resynthesis shall have as many as possible re-ordered grains compared to the original sounds.
The concatenative methods evaluated in this article do demon-strate their advantages over the signal model based method SDIS. Notice that we do not draw a conclusion here that the concatenative synthesis methods are better than the signal model based methods but we do confirm certain observations like the results obtained in [4]. However, it is true that it is generally more difficult to de-velop a signal-model based method that compete in quality with the concatenative methods for sound texture synthesis.
To further improve the algorithms, the principal ideas of cer-tain algorithms can benefit each other. However, the common chal-lenge to sound texture algorithms are varying sounds as shown in Figure 2. We believe that it is essential to model a long-term evo-lution (one cycle of lapping waves) as well as physically coherent behavior (cycles of lapping waves). Based on the same algorithm, for instance, one may adapt the analysis, control and synthesis pa-rameters to each kind of sound textures. The possible advantages of parametric synthesis methods, such as based on a signal or phys-ical model, or physphys-ically-informed [16], in terms of controllability and adaptability to a given temporal evolution are beginning to be attained by recent interactive concatenative methods, e.g. [17].
5. ACKNOWLEDGMENTS
The research presented here is funded by the French Agence Na-tionale de la Recherche(ANR) within the project PHYSIS, ANR-12-CORD-0006.
REFERENCES
[1] S. Bech and N. Zacharov. Perceptual audio evaluation-Theory, method and application. John Wiley & Sons, 2007. [2] S. Dubnov, Z. Bar-Joseph, R. El-Yaniv, D. Lischinski, and
M. Werman. Synthesis of audio sound textures by learning and resampling of wavelet trees. IEEE Computer Graphics and Applications, 22(4):38–48, 2002.
[3] T. Ewender and B. Pfister. Accurate pitch marking for prosodic modification of speech segment. In Proc. INTER-SPEECH, Makurari, Japan, Sept. 26–30 2010.
[4] M. Fröjd and A. Horner. Sound texture synthesis using an overlap-add/granular synthesis approach. Journal of the Au-dio Engineering Society, 57(1/2):29–37, 2009.
[5] T. Heittola, A. Mesaros, D. Korpi, A. Eronen, and T. Vir-tanen. Method for creating location-specific audio textures. EURASIP Journal on Audio, Speech and Music Processing, 2014.
[6] S. Kersten and H. Purwins. Sound texture synthesis with hidden markov tree models in the wavelet domain. In Proc.
Sound and Music Computing (SMC), Barcelona, Spain, July 2010.
[7] W.-H. Liao, A. Roebel, and W.-Y. Su. On the modeling of sound textures based on the STFT representation. In Proc. Digital Audio Effects (DAFx), Maynooth, Ireland, Sept. 2013. URL http://architexte.ircam.fr/textes/Liao13a/. [8] J. H. McDermott and E. P. Simoncelli. Sound texture
percep-tion via statistics of the auditory periphery: evidence from sound synthesis. Neuron, 71(5):926–40, Sept. 2011. [9] J. H. McDonald. Handbook of Biological Statistics.
Sparky House Publishing, Feb. 2015. URL http://www. biostathandbook.com/.
[10] L. Mengual, D. Moffat, and J. D. Reiss. Modal synthesis of weapon sounds. In Proc. Audio Engineering Society Con-ference: 61st International ConCon-ference: Audio for Games. Audio Engineering Society, 2016.
[11] E. Murphy, M. Lagrange, G. Scavone, P. Depalle, and C. Guastavino. Perceptual evaluation of rolling sound syn-thesis. Acta Acustica united with Acustica, 97(5):840–851, 2011.
[12] R. Nordahl, S. Serafin, and L. Turchet. Sound synthesis and evaluation of interactive footsteps for virtual reality applica-tions. In 2010 IEEE Virtual Reality Conference (VR), pages 147–153, March 2010.
[13] S. O’Leary and A. Roebel. A two level montage approach to sound texture synthesis with treatment of unique events. In Proc. Digital Audio Effects (DAFx), Germany, Sept. 2014. [14] G. Peeters. A large set of audio features for sound description
(similarity and classification) in the Cuidado project. Tech-nical Report version 1.0, Ircam – Centre Pompidou, Paris, France, Apr. 2004.
[15] D. Schwarz. Corpus-based concatenative synthesis. IEEE Signal Processing Magazine, 24(2):92–104, Mar. 2007. Spe-cial Section: Signal Processing for Sound Synthesis. [16] D. Schwarz. State of the art in sound texture synthesis. In
Proc. Digital Audio Effects (DAFx), Paris, France, 2011. [17] D. Schwarz and B. Caramiaux. Proc. Computer Music
Mul-tidisciplinary Research (CMMR) 2013, volume 8905 of Lec-ture Notes in Computer Science (LNCS), chapter Interactive Sound Texture Synthesis through Semi-Automatic User An-notations. Springer International Publishing, 2014.
[18] D. Schwarz and S. O’Leary. Smooth granular sound texture synthesis by control of timbral similarity. In Proc. Sound and Music Computing (SMC), Maynooth, Ireland, July 2015. URL https://hal.archives-ouvertes.fr/hal-01182793. [19] S. Siddiq. Morphing of granular sounds. In Proc. Digital
Audio Effects (DAFx), Norway, Nov. 2015.
[20] G. Tiger. Synthése sonore d’ambiances urbaines pour les applications vidéo-ludiques. PhD thesis, Conservatoire Na-tional des Arts et Metiers (CNAM), 2014.
[21] W. Verhelst and M. Roelands. An overlap–add technique based on waveform similarity (WSOLA) for high quality time-scale modification of speech. In Proc. of Intl. Conf. on Acoustics, Speech, and Signal Processing, ICASSP-93., pages 554–557 vol.2, April 1993.