HAL Id: hal-00925911
https://hal.archives-ouvertes.fr/hal-00925911v3
Submitted on 20 Apr 2018
HAL is a multi-disciplinary open access archive for the deposit and dissemination of sci-entific research documents, whether they are pub-lished or not. The documents may come from teaching and research institutions in France or abroad, or from public or private research centers.
L’archive ouverte pluridisciplinaire HAL, est destinée au dépôt et à la diffusion de documents scientifiques de niveau recherche, publiés ou non, émanant des établissements d’enseignement et de recherche français ou étrangers, des laboratoires publics ou privés.
Variations on Memetic Algorithms for Graph Coloring
Problems
Laurent Moalic, Alexandre Gondran
To cite this version:
Laurent Moalic, Alexandre Gondran. Variations on Memetic Algorithms for Graph Coloring Problems. Journal of Heuristics, Springer Verlag, 2018, 24 (1), pp.1–24. �hal-00925911v3�
Variations on Memetic Algorithms
for Graph Coloring Problems
Laurent Moalic∗1 and Alexandre Gondran†2 1Université de Haute-Alsace, LMIA, Mulhouse, France 2MAIAA, ENAC, French Civil Aviation University, Toulouse, France
Abstract
Graph vertex coloring with a given number of colors is a well-known and much-studied NP-complete problem. The most effective methods to solve this problem are proved to be hybrid algorithms such as memetic algorithms or quantum annealing. Those hybrid algorithms use a powerful local search inside a population-based algorithm. This paper presents a new memetic algorithm based on one of the most effective algorithms: the Hybrid Evolutionary Algorithm (HEA) from Galinier and Hao (1999). The proposed algorithm, denoted HEAD - for HEA in Duet - works with a population of only two indi-viduals. Moreover, a new way of managing diversity is brought by HEAD. These two main differences greatly improve the results, both in terms of solution quality and computa-tional time. HEAD has produced several good results for the popular DIMACS benchmark graphs, such as 222-colorings for <dsjc1000.9>, 81-colorings for <flat1000_76_0> and even 47-colorings for <dsjc500.5> and 82-colorings for <dsjc1000.5>.
1
Introduction
Given an undirected graph G = (V, E) with V a set of vertices and E a set of edges, graph vertex coloring involves assigning each vertex with a color so that two adjacent vertices (linked by an edge) feature different colors. The Graph Vertex Coloring Problem (GVCP) consists in finding the minimum number of colors, called chromatic number χ(G), required to color the graph G while respecting these binary constraints. The GVCP is a well-documented and much-studied problem because this simple formalization can be applied to various issues such as frequency assignment problems [1, 2], scheduling problems [3, 4, 5] and flight level allocation problems [6, 7]. Most problems that involve sharing a rare resource (colors) between different operators (vertices) can be modeled as a GVCP. The GVCP is NP-hard [8].
Given k a positive integer corresponding to the number of colors, a k-coloring of a given graph G is a function c that assigns to each vertex an integer between 1 and k as follows :
c : V → {1, 2..., k} v 7→ c(v)
The value c(v) is called the color of vertex v. The vertices assigned to the same color i ∈ {1, 2..., k} define a color class, denoted Vi. An equivalent view is to consider a k-coloring as a partition of G into k subsets of vertices: c ≡ {V1, ..., Vk}.
∗
†
We recall some definitions :
• a k-coloring is called legal or proper k-coloring if it respects the following binary con-straints : ∀(u, v) ∈ E, c(u) 6= c(v). Otherwise the k-coloring is called non legal or non proper ; and edges (u, v) ∈ E such as c(u) = c(v) are called conflicting edges, and u and v conflicting vertices.
• A k-coloring is a complete coloring because a color is assigned to all vertices; if some vertices can remain uncolored, the coloring is said to be partial.
• An independent set or a stable set is a set of vertices, no two of which are adjacent. It is possible to assign the same color to all the vertices of an independent set without producing any conflicting edge. The problem of finding a minimal graph partition of independent sets is then equivalent to the GVCP.
The k-coloring problem - finding a proper k-coloring of a given graph G - is NP-complete [9] for k > 2. The best performing exact algorithms are generally not able to find a proper k-coloring in reasonable time when the number of vertices is greater than 100 for random graphs [10, 11, 12]. Only for few bigger graphs, exact approaches can be applied success-fully [13]. In the general case, for large graphs, one uses heuristics that partially explore the search-space to occasionally find a proper k-coloring in a reasonable time frame. However, this partial search does not guarantee that a better solution does not exist. Heuristics find only an upper bound of χ(G) by successively solving the k-coloring problem with decreasing values of k.
This paper proposes two versions of a hybrid metaheuristic algorithm, denoted HEAD’ and HEAD, integrating a tabu search procedure with an evolutionary algorithm for the k-coloring problem. This algorithm is built on the well-known Hybrid Evolutionary Algorithm (HEA) of Galinier and Hao [14]. However, HEAD is characterized by two original aspects: the use of a population of only two individuals and an innovative way to manage the diversity. This new simple approach of memetic algorithms provides excellent results on DIMACS benchmark graphs.
The organization of this paper is as follows. First, Section 2 reviews related works and methods of the literature proposed for graph coloring and focuses on some heuristics reused in HEAD. Section 3 describes our memetic algorithm, HEAD solving the graph k-coloring problem. The experimental results are presented in Section 4. Section 5 analyzes why HEAD obtains significantly better results than HEA and investigates some of the impacts of diversifi-cation. Finally, we consider the conclusions of this study and discuss possible future researches in Section 6.
2
Related works
Comprehensive surveys on the GVCP can be found in [15, 16, 17]. These first two studies classify heuristics according to the chosen search-space. The Variable Space Search of [18] is innovative and didactic because it works with three different search-spaces. Another more classical mean of classifying the different methods is to consider how these methods explore the search-space; three types of heuristics are defined: constructive methods, local searches and population-based approaches.
We recall some important mechanisms of TabuCol and HEA algorithms because our algo-rithm HEAD shares common features with these algoalgo-rithms. Moreover, we briefly present
some aspects of the new Quantum Annealing algorithm for graph coloring denoted QA-col [19, 20, 21] which has produced, since 2012, most of the best known QA-colorings on DIMACS benchmark.
2.1 TabuCol
In 1987, Hertz and de Werra [22] presented the TabuCol algorithm, one year after Fred Glover introduced the tabu search. This algorithm, which solves k-coloring problems, was enhanced in 1999 by [14] and in 2008 by [18, 23]. The three basic features of this local search algorithm are as follows:
• Search-Space and Objective Function: the algorithm is a k-fixed penalty strategy. This means that the number of colors is fixed and non-proper colorings are taken into account. The aim is to find a coloring that minimizes the number of conflicting edges under the constraints of the number of given colors and of completed coloring (see [16] for more details on the different strategies used in graph coloring).
• Neighborhood: a k-coloring solution is a neighbor of another k-coloring solution if the color of only one conflicting vertex is different. This move is called a critic 1-move. A 1-move is characterized by an integer couple (v, c) where v ∈ {1, ..., |V |} is the vertex number and c ∈ {1, ..., k} the new color of v. Therefore the neighborhood size depends on the number of conflicting vertices.
• Move Strategy: the move strategy is the standard tabu search strategy. Even if the objective function is worse, at each iteration, one of the best neighbors which are not inside the tabu list is chosen. Note that all the neighborhood is explored. If there are several best moves, one chooses one of them at random. The tabu list is not the list of each already-visited solution because this is computationally expensive. It is more efficient to place only the reverse moves inside the tabu list. Indeed, the aim is to prevent returning to previous solutions, and it is possible to reach this goal by forbidding the reverse moves during a given number of iterations (i.e. the tabu tenure). The tabu tenure is dynamic: it depends on the neighborhood size. A basic aspiration criterion is also implemented: it accepts a tabu move to a k-coloring, which has a better objective function than the best k-coloring encountered so far.
Data structures have a major impact on algorithm efficiency, constituting one of the main differences between the Hertz and de Werra version of TabuCol [22] and the Galinier and Hao version [14]. Checking that a 1-move is tabu or not and updating the tabu list are operations performed in constant time. TabuCol also uses an incremental evaluation [24]: the objective function of the neighbors is not computed from scratch, but only the difference between the two solutions is computed. This is a very important feature for local search efficiency. Finding the best 1-move corresponds to find the maximum value of a |V | × k integer matrix. An efficient implementation of incremental data structures is well explained in [15].
Another benefit of this version of TabuCol is that it has only two parameters, L and λ to adjust in order to control the tabu tenure, d, by:
d = L + λF (s)
where F (s) is the number of conflicting vertices in the curent solution s. Moreover, [14] has demonstrated on a very large number of instances that with the same setting (L a random
integer inside [0; 9] and λ = 0.6), TabuCol obtained very good k-colorings. Indeed, one of the main disadvantages of heuristics is that the number of parameters to set is high and difficult to adjust. This version of TabuCol is very robust. Thus we retained the setting of [14] in all our tests.
2.2 Memetic Algorithms for graph coloring and HEA
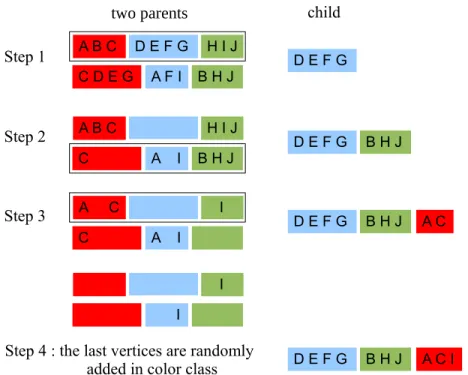
Memetic Algorithms [25] (MA) are hybrid metaheuristics using a local search algorithm inside a population-based algorithm. They can also be viewed as specific Evolutionary Algorithms (EAs) where all individuals of the population are local minimums (of a specific neighborhood). In MA, the mutation of the EA is replaced by a local search algorithm. It is very important to note that most of the running time of a MA is spent in the local search. These hybridizations combine the benefits of population-based methods, which are better for diversification by means of a crossover operator, and local search methods, which are better for intensification. In graph coloring, the Hybrid Evolutionary Algorithm (HEA) of Galinier and Hao [14] is a MA; the mutation of the EA is replaced by the tabu search TabuCol. HEA is one of the best algorithms for solving the GVCP; From 1999 until 2012, it provided most of the best results for DIMACS benchmark graphs [26], particularly for difficult graphs such as <dsjc500.5> and <dsjc1000.5> (see table 1). These results were obtained with a population of 10 individuals. The crossover used in HEA is called the Greedy Partition Crossover (GPX ). The two main principles of GPX are: 1) a coloring is a partition of vertices into color classes and not an assignment of colors to vertices, and 2) large color classes should be transmitted to the child. Figure 1 gives an example of GPX for a problem with three colors (red, blue and green) and 10 vertices (A, B, C, D, E, F, G, H, I and J). The first step is to transmit to the child the largest color class of the first parent. If there are several largest color classes, one of them is chosen at random. After having withdrawn those vertices in the second parent, one proceeds to step 2 where one transmits to the child the largest color class of the second parent. This process is repeated until all the colors are used. There are most probably still some uncolored vertices in the child solution. The final step (step k + 1) is to randomly add those vertices to the color classes. Notice that GPX is asymmetrical: the order of the parents is important; starting the crossover with parent 1 or parent 2 can produce very different offsprings. Notice also that GPX is a random crossover: applying GPX twice with the same parents does not produce the same offspring. The final step is very important because it produces many conflicts. Indeed if the two parents have very different structures (in terms of color classes), then a large number of vertices remain uncolored at step k + 1, and there are many conflicting edges in the offspring (cf. figure 4). We investigate some modifications of GPX in section 5.
2.3 QA-col: Quantum Annealing for graph coloring
In 2012 Olawale Titiloye and Alan Crispin [19, 20, 21] proposed a Quantum Annealing algo-rithm for graph coloring, denoted QA-col. QA-col produces most of the best-known colorings for the DIMACS benchmark. In order to achieve this level of performance, QA-col is based on parallel computing. We briefly present some aspects of this new type of algorithm.
In a standard Simulating Annealing algorithm (SA), the probability of accepting a can-didate solution is managed through a temperature criterion. The value of the temperature decreases during the SA iterations. As MA, a Quantum Annealing (QA) is a population-based algorithm, but it does not perform crossovers and the local search is an SA. The only interaction between the individuals of the population occurs through a specific local attraction-repulsion
Figure 1: An example of GPX crossover for a graph of 10 vertices (A, B, C, D, E, F, G, H, I and J) and three colors (red, blue and green). This example comes from [14].
process. The SA used in QA-col algorithm is a k-fixed penalty strategy like TabuCol : the individuals are non-proper k-colorings. The objective function of each SA minimizes a linear combination of the number of conflicting edges and a given population diversity criterion as detailed later. The neighborhood used is defined by critic 1-moves like TabuCol. More pre-cisely, in QA-col, the k-colorings of the population are arbitrarily ordered in a ring topology: each k-coloring has two neighbors associated with it. The second term of the objective func-tion (called Hamiltonian cf. equafunc-tion (1) of [19]) can be seen as a diversity criterion based on a specific distance applicable to partitions. Given two k-colorings (i.e. partitions) ci and cj, the distance, which we called pairwise partition distance, between ci and cj is the following :
dP(ci, cj) =
X
(u,v)∈V2, u6=v
[ci(u) = ci(v)] ⊕ [cj(u) = cj(v)]
where ⊕ is the XOR operation and [ ] is Iverson bracket: [ci(u) = ci(v)] = 1 if ci(u) = ci(v)
is true and equals 0 otherwise. Then, given one k-coloring ci of the population, the diversity
criterion D(ci) is defined as the sum of the pairwise partition distances between ci and its two
neighbors ci+1and ci−1in the ring topology : D(ci) = dP(ci, ci−1) + dP(ci, ci+1) which ranges
from 0 to 2n(n − 1); The value of this diversity is integrated into the objective function of each SA. As with the temperature, if the distance increases, there will be a higher probability that the solution will be accepted (attractive process). If the distance decreases, then there will be a lower probability that the solution will be accepted (repulsive process). Therefore in QA-col the only interaction between the k-colorings of the population is realized through this distance process.
They use many parameters and several intensification and diversification operators and thus the benefit of each item is not easily evaluated. Our approach has been to identify which elements of HEA are the most significant in order to define a more efficient algorithm.
3
HEAD
: Hybrid Evolutionary Algorithm in Duet
The basic components of HEA are the TabuCol algorithm, which is a very powerful local search for intensification, and the GPX crossover, which adds some diversity. The intensifica-tion/diversification balance is difficult to achieve. In order to simplify the numerous parame-ters involved in EAs, we have chosen to consider a population with only two individuals. We present two versions of our algorithm denoted HEAD’ and HEAD for HEA in Duet.
3.1 First hybrid algorithm: HEAD’
Algorithm 1 describes the pseudo code of the first version of the proposed algorithm, denoted HEAD’.
Algorithm 1: - HEAD’ - first version of HEAD : HEA in Duet for k-coloring problem
Input: k, the number of colors; IterT C, the number of TabuCol iterations.
Output: the best k-coloring found: best
1 p1, p2, best ← init() /* initialize with random k-colorings */ 2 generation ← 0 3 do 4 c1← GPX (p1, p2) 5 c2← GPX (p2, p1) 6 p1← TabuCol (c1,IterT C) 7 p2← TabuCol (c2,IterT C) 8 best ← saveBest(p1, p2, best) 9 generation + +
10 while nbConf licts(best) > 0 and p16= p2
This algorithm can be seen as two parallel TabuCol algorithms which periodically interact by crossover. After randomly initializing the two solutions (with init() function), the algo-rithm repeats an instructions loop until a stop criterion occurs. First, we introduce some diversity with the crossover operator, then the two offspring c1 and c2 are improved by means of the TabuCol algorithm. Next, we register the best solution and we systematically replace the parents by the two children. An iteration of this algorithm is called a generation. The main parameter of TabuCol is IterT C, the number of iterations performed by the algorithm, the other TabuCol parameters L and λ are used to define the tabu tenure and are consid-ered fixed in our algorithm. Algorithm 1 stops either because a legal k-coloring is found (nbConf licts(best) = 0) or because the two k-colorings are equal in terms of the set-theoretic partition distance ( cf. Section 5).
A major risk is a premature convergence of HEAD’. Algorithm 1 stops sometimes too quickly: the two individuals are equal before finding a legal coloring. It is then necessary to reintroduce diversity into the population. In conventional EAs, the search space exploration is largely brought by the size of the population: the greater the size, the greater the search diversity. In the next section we propose an alternative to the population size in order to reinforce diversification.
3.2 Improved hybrid algorithm: HEAD
Algorithm 2: HEAD - second version of HEAD with two extra elite solutions
Input: k, the number of colors; IterT C, the number of TabuCol iterations; Itercycle= 10, the number
of generations into one cycle. Output: the best k-coloring found: best
1 p1, p2, elite1, elite2, best ← init() /* initialize with random k-colorings */ 2 generation, cycle ← 0 3 do 4 c1← GPX (p1, p2) 5 c2← GPX (p2, p1) 6 p1← TabuCol (c1,IterT C) 7 p2← TabuCol (c2,IterT C)
8 elite1← saveBest(p1, p2, elite1) /* best k-coloring of the current cycle */ 9 best ← saveBest(elite1, best)
10 if generation%Itercycle= 0 then
11 p1← elite2 /* best k-coloring of the previous cycle */ 12 elite2← elite1
13 elite1← init() 14 cycle + + 15 generation + +
16 while nbConf licts(best) > 0 and p16= p2
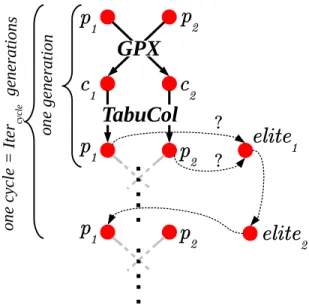
Algorithm 2 summarizes the second version of our algorithm, simply denoted HEAD. We add two other candidate solutions (similar to elite solutions), elite1 and elite2, in order to reintroduce some diversity to the duet. Indeed, after a given number of generations, the two individuals of the population become increasingly similar within the search-space. To maintain the population diversity, the idea is to replace one of the two candidates solutions by a solution previously encountered by the algorithm. We define one cycle as a number of Itercycle generations. Solution elite1 is the best solution found during the current cycle and
solution elite2the best solution found during the previous cycle. At the end of each cycle, the elite2 solution replaces one of the population individuals. Figure 2 presents the graphic view
of algorithm 2.
This elitist mechanism provides relevant behaviors to the algorithm as it can be observed in the computational results of section 4.2. Indeed, elite solutions have the best fitness value of each cycle. It is clearly interesting in terms of intensification. Moreover, when the elite solution is reintroduced, it is generally different enough from the other individuals to be relevant in terms of diversification. In the next section, we show how the use of this elitist mechanism can enhance the results.
4
Experimental Results
In this section we present the results obtained with the two versions of the proposed memetic algorithm. To validate the proposed approach, the results of HEAD are compared with the results obtained by the best methods currently known.
GPX
p
1p
2c
2c
1p
2p
1 on e ge nera ti onTabuCol
on e cy cle = I te r cycl e g en erat io ns?
?
elite
1elite
2p
2p
1Figure 2: Diagram of HEAD
4.1 Instances and Benchmarks
In 1992-93, the second DIMACS challenge on maximum clique and graph coloring [26]1 defined
the first library of graph coloring instances that became the benchmark in this area. This library was extended in 2002 with the Graph Coloring and its Generalizations symposium series. Various classes of graphs are represented: some come from real-world, others are randomly generated, others are translations from other problems... Our tests are performed on 34 random graphs with various number of vertices (from one hundred to several thousand) and density ranging from 0.1 to 0.9. Theses instances are selected among the most studied graphs and the most difficult2.
We briefly recall the main features of studied graphs: <dsjc>, <dsjr>, <flat>, <r>, <le> and <C> which are randomly or quasi-randomly generated graphs. <dsjcn.d> graphs and <Cn.d> graphs are random graphs with n vertices, with each vertex connected to an average of n × 0.d vertices; 0.d is the graph density. The chromatic number of these graphs is unknown. Likewise for <rn.d[c]> and <dsjrn.d> graphs which are geometric random graphs with n vertices and a density equal to 0.d. [c] denotes the complement of such a graph. <flat> and <le> graphs have another structure: they are built for a known chromatic number. The <flatn_χ> graph or <len_χ[abcd]> graph has n vertices and χ is the chromatic number.
4.2 Computational Results
HEAD and HEAD’ were coded in C++. The results were obtained with an Intel Core i5 3.30GHz processor - 4 cores and 16GB of RAM. Note that the RAM size has no impact on the calculations: even for large graphs such as <dsjc1000.9> (with 1000 vertices and a high density of 0.9), the use of memory does not exceed 125 MB. The main characteristic is the processor speed.
1
ftp://dimacs.rutgers.edu/pub/challenge/graph/benchmarks/color/
As shown in Section 3, the proposed algorithms have two successive calls to local search (lines 6 and 7 of the algorithms 1 and 2), one for each child of the current generation. Almost all of the time is spent on performing the local search. Both local searches can be parallelized when using a multi-core processor architecture. This is what we have done using the OpenMP API (Open Multi-Processing), which has the advantage of being a cross-platform (Linux, Windows, MacOS, etc.) and simple to use. Thus, when an execution of 15 minutes is given, the required CPU time is actually close to 30 minutes if using only one processing core.
LS Hybrid algorithm
1987/2008 1999 2008 2010 2011 2012 2012 Instances HEAD TabuCol HEA AmaCol MaCol ExtraCol IE2COL QA-col
[22, 18, 23] [14] [23] [27] [28] [29] [19, 20, 21] dsjc125.1 5 5 - 5 5 - - -dsjc125.5 17 17 - 17 17 - - -dsjc125.9 44 44 - 44 44 - - -dsjc250.1 8 8 - 8 8 - - -dsjc250.5 28 28 28 28 28 - - 28 dsjc250.9 72 72 - 72 72 - - -dsjc500.1 12 13 - 12 12 - - -dsjc500.5 47 49 48 48 48 - - 47 dsjc500.9 126 127 - 126 126 - - 126 dsjc1000.1 20 - 20 20 20 20 20 20 dsjc1000.5 82 89 83 84 83 83 83 82 dsjc1000.9 222 227 224 224 223 222 222 222 dsjr500.1c 85 85 - 86 85 - - 85 le450_5a 5 5 - 5 - - - -le450_5b 5 5 - 5 - - - -le450_5c 5 5 - 5 - - - -le450_5d 5 5 - 5 - - - -le450_15a 15 15 - 15 15 - - -le450_15b 15 15 - 15 15 - - -le450_15c 15 16 15 15 15 - - 15 le450_15d 15 15 - 15 15 - - 15 le450_25a 25 25 - 25 25 - - -le450_25b 25 25 - 25 25 - - -le450_25c 25 26 26 26 25 - - 25 le450_25d 25 26 - 26 25 - - 25 flat300_28_0 31 31 31 31 29 - - 31 flat1000_50_0 50 50 - 50 50 50 50 -flat1000_60_0 60 60 - 60 60 60 60 -flat1000_76_0 81 88 83 84 82 82 81 81 r250.5 65 - - - 65 - - 65 r1000.1c 98 - - - 98 101 98 98 r1000.5 245 - - - 245 249 245 234 C2000.5 146 - - - 148 146 145 145 C4000.5 266 - - - 272 260 259 259
Table 1: Best coloring found by the principal methods known to date for 34 graphs. Table 1 presents results of the principal methods known to date for 34 graphs. For each graph, the lowest number of colors found by each algorithm is indicated (upper bound of χ). For TabuCol [22] the reported results are from [18, 23] (2008) which are better than those of 1987. The most recent algorithms, QA-col (Quantum Annealing for graph color-ing [19, 20, 21]) and IE2COL (Improving the Extraction and Expansion method for large graph COLoring [29]), provide the best results. More precisely, QA-col dominates HEAD for three graphs (<r1000.5>, <C2000.5> and <C4000.5>). However to reach this result, QA-col takes a very large amount of time and is based on a cluster of PC using 10 processing cores simultaneously. HEAD is also dominated by IE2COL for the two largest graphs (<C2000.5>
and <C4000.5>), but this latter algorithm is specifically designed for very large graphs (> 900 vertices). Note that HEA [14], AmaCol [23], MaCol [27], ExtraCol [28] and IE2COL are also population-based algorithms using TabuCol and GPX crossover or an improvement of GPX (GPX with n> 2 parents for MaCol and ExtraCol and the GPX process is replaced in Ama-Col by a selection of k color classes among a very large pool of color classes). Only QA-col has another approach based on several parallel simulated annealing algorithms interacting together with an attractive/repulsive process (cf. section 2.3). It is therefore meaningful to compare HEAD to MaCol, which is currently one of the very best EAs graph coloring heuris-tics. Compared to MaCol, HEAD is able to reach better results for six graphs: <dsjc500.5>, <dsjc1000.5>, <dsjc1000.9>, <flat1000_76_0>, <C2000.5> and <C4000.5>. On the other hand, MaCol dominates HEAD for only one graph <flat300_28_0>.
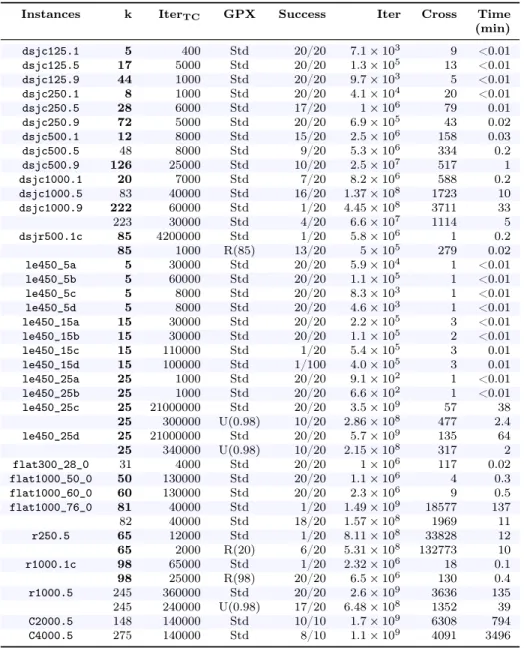
Instances k IterTC GPX Success Iter Cross Time
(min) dsjc125.1 5 400 Std 20/20 7.1 × 10³ 9 <0.01 dsjc125.5 17 5000 Std 20/20 1.3 × 10⁵ 13 <0.01 dsjc125.9 44 1000 Std 20/20 9.7 × 10³ 5 <0.01 dsjc250.1 8 1000 Std 20/20 4.1 × 10⁴ 20 <0.01 dsjc250.5 28 6000 Std 17/20 1 × 10⁶ 79 0.01 dsjc250.9 72 5000 Std 20/20 6.9 × 10⁵ 43 0.02 dsjc500.1 12 8000 Std 15/20 2.5 × 10⁶ 158 0.03 dsjc500.5 48 8000 Std 9/20 5.3 × 10⁶ 334 0.2 dsjc500.9 126 25000 Std 10/20 2.5 × 10⁷ 517 1 dsjc1000.1 20 7000 Std 7/20 8.2 × 10⁶ 588 0.2 dsjc1000.5 83 40000 Std 16/20 1.37 × 10⁸ 1723 10 dsjc1000.9 222 60000 Std 1/20 4.45 × 10⁸ 3711 33 223 30000 Std 4/20 6.6 × 10⁷ 1114 5 dsjr500.1c 85 4200000 Std 1/20 5.8 × 10⁶ 1 0.2 85 1000 R(85) 13/20 5 × 10⁵ 279 0.02 le450_5a 5 30000 Std 20/20 5.9 × 10⁴ 1 <0.01 le450_5b 5 60000 Std 20/20 1.1 × 10⁵ 1 <0.01 le450_5c 5 8000 Std 20/20 8.3 × 10³ 1 <0.01 le450_5d 5 8000 Std 20/20 4.6 × 10³ 1 <0.01 le450_15a 15 30000 Std 20/20 2.2 × 10⁵ 3 <0.01 le450_15b 15 30000 Std 20/20 1.1 × 10⁵ 2 <0.01 le450_15c 15 110000 Std 1/20 5.4 × 10⁵ 3 0.01 le450_15d 15 100000 Std 1/100 4.0 × 10⁵ 3 0.01 le450_25a 25 1000 Std 20/20 9.1 × 10² 1 <0.01 le450_25b 25 1000 Std 20/20 6.6 × 10² 1 <0.01 le450_25c 25 21000000 Std 20/20 3.5 × 10⁹ 57 38 25 300000 U(0.98) 10/20 2.86 × 10⁸ 477 2.4 le450_25d 25 21000000 Std 20/20 5.7 × 10⁹ 135 64 25 340000 U(0.98) 10/20 2.15 × 10⁸ 317 2 flat300_28_0 31 4000 Std 20/20 1 × 10⁶ 117 0.02 flat1000_50_0 50 130000 Std 20/20 1.1 × 10⁶ 4 0.3 flat1000_60_0 60 130000 Std 20/20 2.3 × 10⁶ 9 0.5 flat1000_76_0 81 40000 Std 1/20 1.49 × 10⁹ 18577 137 82 40000 Std 18/20 1.57 × 10⁸ 1969 11 r250.5 65 12000 Std 1/20 8.11 × 10⁸ 33828 12 65 2000 R(20) 6/20 5.31 × 10⁸ 132773 10 r1000.1c 98 65000 Std 1/20 2.32 × 10⁶ 18 0.1 98 25000 R(98) 20/20 6.5 × 10⁶ 130 0.4 r1000.5 245 360000 Std 20/20 2.6 × 10⁹ 3636 135 245 240000 U(0.98) 17/20 6.48 × 10⁸ 1352 39 C2000.5 148 140000 Std 10/10 1.7 × 10⁹ 6308 794 C4000.5 275 140000 Std 8/10 1.1 × 10⁹ 4091 3496
Table 2 presents the results obtained with HEAD’, the first version of HEAD (without elite). This simplest version finds the best known results for most of the studied graphs (28/34); Only QA-col (and IE2COL for <C> graphs) occasionally finds a solution with less color. The column IterTC indicates the number of iterations of the TabuCol algorithm (this is the stop criterion of TabuCol ). This parameter has been determined for each graph after an empirical analysis for finding the most suitable value. The column GPX refers to the GPX used inside HEAD’. Indeed, in section 5, we define two modifications of the standard GPX (Std): the unbalanced GPX (U([0 ; 1])) and the random GPX (R(J0 ; kK)). One can notice that the choice of the unbalanced or the random crossover is based on the study of the algorithm in the standard mode (standard GPX ). If the algorithm needs too many generations for con-verging we introduce the unbalanced GPX. At the opposite, if the algorithm converges quickly without finding any legal k-coloring we introduce the random crossover. Section 5 details the modifications of the GPX crossover (section 5.2.1 for the random GPX and section 5.2.2 for the unbalanced GPX ).
The column Success evaluates the robustness of this method, providing the success rate: success_runs/total_runs. A success run is one which finds a legal k-coloring. The average number of generations or crossovers performed during one success run is given by the Cross value. The total average number of iterations of TabuCol preformed during HEAD’ is
Iter = IterTC× Cross × 2.
The column Time indicates the average CPU time in minutes of success runs.
HEAD’ success rate is rarely 100%, but in case of success, the running time is generally very short. The main drawback of HEAD’ is that it sometimes converges too quickly. In such instances it cannot find a legal solution before the two individuals in a generation become identical. The first option to correct this rapid convergence, is to increase the number of iterations IterT C of each TabuCol. The second option is to use the random GPX instead of
the standard one (section 5.2.1). However, these options are not considered sufficient. The second version, HEAD, adds more diversity while performing an intensifying role.
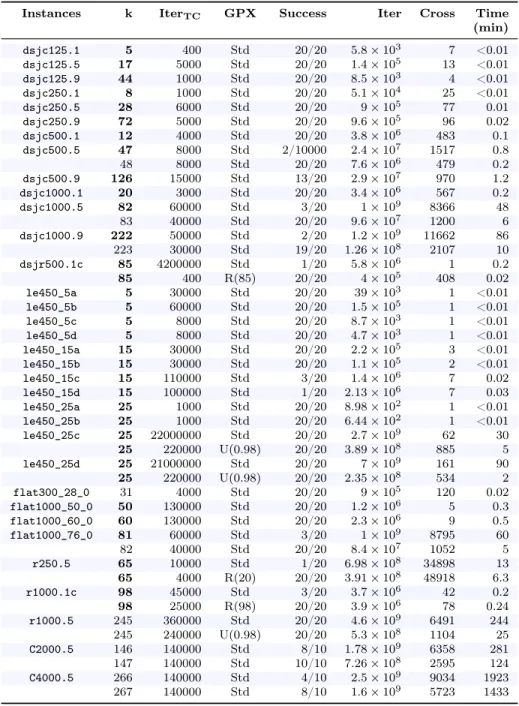
Table 3 shows the results obtained with HEAD. For all the studied graphs except four (<flat300_28_0>, <r1000.5>, <C2000.5> and <C4000.5>), HEAD finds the best known results. Only the QA-col, using ten CPU cores simultaneously, and IE2COL for large graphs, achieve this level of performance. In particular, <dsjc500.5> is solved with only 47 colors and <flat1000_76_0> with 81 colors.
The computation time of HEAD is generally close to that of HEAD’ but the former algorithm is more robust with a success rate of almost 100%. In particular, the two graphs <dsjc500.5> and <dsjc1000.1> with 48 and 20 colors respectively are resolved each time, and in less than one CPU minute on average (CPU 3.3GHz). Using a multicore CPU, these instances are solved in less than 30 seconds on average, often in less than 10 seconds. As a comparison, the shortest time reported in the literature for <dsjc1000.1> is 32 minutes for QA-col [20] (2011) with a 3GHz processor, 65 minutes for IE2COL (2012) with a 2.8GHz processor, 93 minutes for ExtraCol [28] (2011) with a 2.8GHz processor and 108 minutes for MaCol [27] (2010) with a 3.4GHz processor.
5
Analysis of diversification
HEAD shares common features with HEA, but it obtains significantly better results with respect to solution quality and computing time. It is beneficial to analyze why the new mechanisms introduced with HEAD gives rise to such a large change.
Instances k IterTC GPX Success Iter Cross Time (min) dsjc125.1 5 400 Std 20/20 5.8 × 10³ 7 <0.01 dsjc125.5 17 5000 Std 20/20 1.4 × 10⁵ 13 <0.01 dsjc125.9 44 1000 Std 20/20 8.5 × 10³ 4 <0.01 dsjc250.1 8 1000 Std 20/20 5.1 × 10⁴ 25 <0.01 dsjc250.5 28 6000 Std 20/20 9 × 10⁵ 77 0.01 dsjc250.9 72 5000 Std 20/20 9.6 × 10⁵ 96 0.02 dsjc500.1 12 4000 Std 20/20 3.8 × 10⁶ 483 0.1 dsjc500.5 47 8000 Std 2/10000 2.4 × 10⁷ 1517 0.8 48 8000 Std 20/20 7.6 × 10⁶ 479 0.2 dsjc500.9 126 15000 Std 13/20 2.9 × 10⁷ 970 1.2 dsjc1000.1 20 3000 Std 20/20 3.4 × 10⁶ 567 0.2 dsjc1000.5 82 60000 Std 3/20 1 × 10⁹ 8366 48 83 40000 Std 20/20 9.6 × 10⁷ 1200 6 dsjc1000.9 222 50000 Std 2/20 1.2 × 10⁹ 11662 86 223 30000 Std 19/20 1.26 × 10⁸ 2107 10 dsjr500.1c 85 4200000 Std 1/20 5.8 × 10⁶ 1 0.2 85 400 R(85) 20/20 4 × 10⁵ 408 0.02 le450_5a 5 30000 Std 20/20 39 × 103 1 <0.01 le450_5b 5 60000 Std 20/20 1.5 × 10⁵ 1 <0.01 le450_5c 5 8000 Std 20/20 8.7 × 10³ 1 <0.01 le450_5d 5 8000 Std 20/20 4.7 × 10³ 1 <0.01 le450_15a 15 30000 Std 20/20 2.2 × 10⁵ 3 <0.01 le450_15b 15 30000 Std 20/20 1.1 × 10⁵ 2 <0.01 le450_15c 15 110000 Std 3/20 1.4 × 10⁶ 7 0.02 le450_15d 15 100000 Std 1/20 2.13 × 10⁶ 7 0.03 le450_25a 25 1000 Std 20/20 8.98 × 10² 1 <0.01 le450_25b 25 1000 Std 20/20 6.44 × 10² 1 <0.01 le450_25c 25 22000000 Std 20/20 2.7 × 10⁹ 62 30 25 220000 U(0.98) 20/20 3.89 × 10⁸ 885 5 le450_25d 25 21000000 Std 20/20 7 × 10⁹ 161 90 25 220000 U(0.98) 20/20 2.35 × 10⁸ 534 2 flat300_28_0 31 4000 Std 20/20 9 × 10⁵ 120 0.02 flat1000_50_0 50 130000 Std 20/20 1.2 × 10⁶ 5 0.3 flat1000_60_0 60 130000 Std 20/20 2.3 × 10⁶ 9 0.5 flat1000_76_0 81 60000 Std 3/20 1 × 10⁹ 8795 60 82 40000 Std 20/20 8.4 × 10⁷ 1052 5 r250.5 65 10000 Std 1/20 6.98 × 10⁸ 34898 13 65 4000 R(20) 20/20 3.91 × 10⁸ 48918 6.3 r1000.1c 98 45000 Std 3/20 3.7 × 10⁶ 42 0.2 98 25000 R(98) 20/20 3.9 × 10⁶ 78 0.24 r1000.5 245 360000 Std 20/20 4.6 × 10⁹ 6491 244 245 240000 U(0.98) 20/20 5.3 × 10⁸ 1104 25 C2000.5 146 140000 Std 8/10 1.78 × 10⁹ 6358 281 147 140000 Std 10/10 7.26 × 10⁸ 2595 124 C4000.5 266 140000 Std 4/10 2.5 × 10⁹ 9034 1923 267 140000 Std 8/10 1.6 × 10⁹ 5723 1433
Table 3: Results of the second version of HEAD algorithm (with elites) including the indication of CPU time
A first answer can be formulated with regard to computing time. It can be observed that 99% of the running time of HEA, Amacol, MaCol and HEAD is spent during calculating TabuCol algorithms. Considering a population of 10 k-colorings in the case of HEA and Amacol (20 in case of MaCol ) requires more time than only two such individuals for HEAD.
In our study HEAD is not considered as a standard MA, but rather as two separated TabuCol algorithms. After a given number of iterations, instead of stopping the two TabuCol, we reintroduce diversity with the crossover operator GPX. The difficulty is to reintroduce the correct dose of diversity. Indeed the danger of the crossover is that of completely destroying
the solution structure. GPX is a powerful crossover operator compared to others [24] because it transmits the biggest color classes of the two parents, thus keeping a large part of the parents’ structures. Very interesting and relevant studies about how to manage diversity for graph coloring heuristics can be found in [30, 31].
We present in this section an analysis of GPX crossover indicating that it is more accurate to have parents that are not too far away in the search-space - according to the distance presented below (section 5.1).
Several tests are also performed in this section in order to analyze the role of diversification in the HEAD algorithm. The two main mechanisms leading to diversification in HEAD are the GPX crossover and the population update process. In a first set of tests (section 5.2), we slightly modify the dose of diversification in the GPX crossover and analyze the results. In a second set of tests (section 5.3), we focus on the population update process: in HEAD, the two produced children systematically replace both parents, even if they have worse fitness values than their parents. If the replacement is not systematic, the diversification decreases.
5.1 Distance between parents and GPX crossover
GPX crossover is a diversification operator: it generates solutions in numerous uncharted regions of the search-space. However, there is a risk of providing too much diversity, and thus breaking the structure of the current solution. This is the principal failing of basic crossovers used before GPX [24].
An interesting feature of GPX is its ability to explore new areas of the search-space without breaking the structures of current k-colorings. There are many parameters that affect the dose of diversity of GPX. One of the easily identifiable parameters is the distance between the two parents.
The set-theoretic partition distance [14, 32] between two k-colorings c1 and c2 is defined
as the least number of 1-move steps (i.e. a color change of one vertex) for transforming c1 to c2. This distance has to be independent of the permutation of the color classes, then before
counting the number of 1-moves, we have to match each color class of c1with the nearest color
class of c2. This problem is a maximum weighted bipartite matching if we consider each color class of c1and c2as the vertices of a bipartite graph; an edge links a color class of c1with a color
class of c2 with an associated value corresponding to the number of vertices shared by those
classes. The set-theoretic partition distance is then calculated as follows: dH(c1, c2) = n − q
where n is the number of vertices of the initial graph and q the result of the matching; i.e. the maximal total number of sharing vertices in the same class for c1 and c2. Figure 3 gives
an example of the computation of this distance between two 3-colorings. The possible values range from 0 to less than n. Indeed it is not possible to have totally different k-coloring.
If we highlight two k-colorings that have very low objective functions but that are very different (in terms of the dH distance), then they would have a high probability of producing children with very high objective functions following crossover. The danger of the crossover is of completely destroying the k-coloring structure. On the other hand, two very close k-colorings (in terms of the dH distance) produce a child with an almost identical objective function. Chart 4 shows the correlation between the distance separating two k-colorings having the same number of conflicting edges (objective functions equal to 40) and the number of conflicting edges of the child produced after GPX crossover. This chart is obtained considering k = 48 colors into the <dsjc500.5> graph. More precisely, this chart results of the following steps: 1) First, 100 non legal 48-colorings, called parents, are randomly generated with a fitness (that is a number of conflicting edges) equal to 40. Tabucol algorithm is used to generate
1 1 1
A B C
C D E G
color class blue
D E F G
color class green
H I J
A F I
B H J
color class red 1 1 2
3
color class red
coloring 1 coloring 2
Figure 3: A graph with 10 vertices (A, B, C, D, E, F, G, H, I and J), three colors (red, blue and green) and two 3-colorings: coloring 1 and coloring 2. We defined the weighted bipartite graph corresponding to the number of vertices shared by color classes of coloring 1 and coloring 2. The bold lines correspond to the maximum weighted bipartite matching. The maximal total number of sharing vertices in the same class is equal to q = 3 + 2 + 1 = 6. Then the set-theoretic partition distance between those two 3-colorings is equal to: dH(coloring 1, coloring 2) = n − q = 10 − 6 = 4. This distance is independent of the permutation of the color classes.
these 100 parents (Tabucol is stopped when exactly 40 conflicted edges are found). 2) A GPX crossover is performed on all possible pairs of parents, generating for each pair two new non legal 48-colorings, called children. Indeed, GPX is asymmetrical, then the order of the parents is important. By this way, 9900 (= 100 × 99) children are generated. 3) We perform twice the steps 1) and 2), therefore the total number of generated children is equal to 19800. Each point of the chart corresponds to one child. The y-axis indicates the fitness of the child. The x-axis indicates the distance dH in the search-space between the two parents of the child. There is a quasi-linear correlation between these two parameters (Pearson correlation coefficient equals to 0.973).
Moreover, chart 4 shows that a crossover never improves a k-coloring. As stated in sec-tion 2.2, the last step of GPX produces many conflicts. Indeed, if the two parents are very far in terms of dH, then a large number of vertices remain uncolored at the final step of GPX.
Those vertices are then randomly added to the color classes, producing many conflicting edges in the offspring. This explains why in MA, a local search always follows a crossover operator. Figure 5 presents the evolution of the objective function (i.e. the number of conflicting edges) of the two k-colorings of the population at each generation of HEAD. It also indicates the dH distance between the two k-colorings. This figure is obtained by considering one typical
run to find one 48-coloring of <dsjc500.5> graph. The objective function of the two k-colorings (f (p1) and f (p2)) are very close during the whole run: the average of the difference
f (p1) − f (p2) on the 779 generations is equal to −0.11 with a variance of 2.44. Figure 5
shows that there is a significant correlation between the quality of the two k-colorings (in terms of fitness values) and the distance dH between them before the GPX crossover: the Pearson correlation coefficient is equal to 0.927 (respectively equal to 0.930) between f (p1)
and dH(p1, p2) (resp. between f (p2) and dH(p1, p2)). Those plots give the main key for
understanding why HEAD is more effective than HEA: the linear anti-correlation between the two k-colorings with approximately same objective function values f (p1) ' f (p2) is around
equal to 500−10×dH(p1, p2). The same level of correlation with a population of 10 individuals
using HEA cannot be obtained except with sophisticated sharing process.
0 50 100 150 200 250 300 350 400 dH distance between parents with same fitness f1 = f2 = 40
0 50 100 150 200 250 300 350 400 child fitness (n um b er of conflicting edges)
Figure 4: Each point of the chart, called child-solution, corresponds to one non-legal 48-coloring of the <dsjc500.5> graph; It has been produced by the GPX crossover of two other non-legal 48-colorings, called parents-solutions. Both parents are randomly generated with the same fitness value (the same number of conflicting edges). Their distance dH in the search-space is indicated on the abscissa axis. The number of conflicting edges of the child is indicated on the ordinate axis.
should be avoided in other case. The next subsections analyze several levers which may able to increase or decrease the diversity in HEAD.
5.2 Dose of diversification in the GPX crossover
Some modifications are performed on the GPX crossover in order to increase (as for the first test) or decrease (as for the second test) the dose of diversification within this operator. 5.2.1 Test on GPX with increased randomness: random draw of a number of
color classes
In order to increase the level of randomness within the GPX crossover, we randomize the GPX. It should be remembered (cf. section 2.2) that at each step of the GPX, the selected parent transmits the largest color class to the child. In this test, we begin by randomly transmitting x ∈ J0 ; kK color classes chosen from the parents to the child; after those x steps, we start again by alternately transmitting the largest color class from each parent (x is the random level). If x = 0, then the crossover is the same as the initial GPX. If x increases, then the randomness and the diversity also increase. To evaluate this modification of the crossover, we count the cumulative iterations number of TabuCol that one HEAD run requires in order to find a legal k-coloring. For each x value, the algorithm is run ten times in order to produce more robust results. For the test, we consider the 48-coloring problem for graph <dsjc500.5> of the DIMACS benchmark. Figure 6 shows in abscissa the random level x and in ordinate
Figure 5: Red and green lines indicate the number of conflicting edges of the two 48-colorings of the population: f (p1) and f (p2) (left ordinate axis) at each generation of one run of HEAD
applied on <dsjc500.5> graph (abscissa axis). The blue line indicates the distance between the two k-colorings during the run: dH(p1, p2) (right ordinate axis).
the average number of iterations required to find a legal 48-coloring.
First, 0 ≤ x ≤ k, where k is the number of colors, but we stop the computation for x ≥ 15, because from x = 15, the algorithm does not find a 48-coloring within an acceptable computing time limit. This means that when we introduce too much diversification, the algorithm cannot find a legal solution. Indeed, for a high x value, the crossover does not transmit the good features of the parents, therefore the child appears to be a random initial solution. When 0 ≤ x ≤ 8, the algorithm finds a legal coloring in more or less 10 million iterations. It is not easy to decide which x-value obtains the quickest result. However this parameter enables an increase of diversity in HEAD. This version of GPX is called random GPX and noted R(x) with x ∈ J0 ; kK in tables 2 and 3. It is used for three graphs <r250.5>, <r1000.1c> and <dsjr500.1c> because the standard GPX does not operate effectively. The fact that these three graphs are more structured that the others may explain why the random GPX works better.
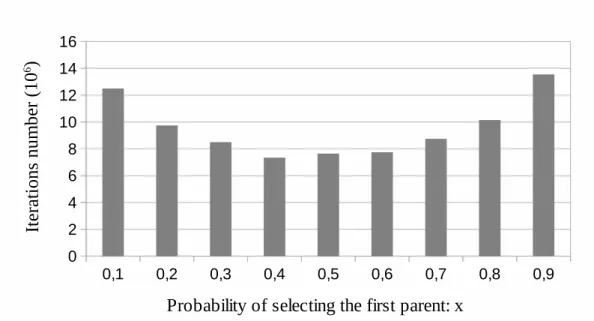
5.2.2 Test on GPX with decreased randomness: imbalanced crossover
In the standard GPX, the role of each parent is balanced: they alternatively transmit their largest color class to the child. Of course, the parent which first transmits its largest class, has more importance than the other; this is why it is an asymmetric crossover. In this test, we give a higher importance to one of the parents. At each step of the crossover, we randomly draw the parent that transmits its largest color class with a different probability for each parent. We introduce x ∈ [0 ; 1], the probability of selecting the first parent; 1 − x is the probability of selecting the second parent. For example, if x = 0.75, then, at each step of GPX, parent 1 has a 3 in 4 chance of being selected to transmit its largest color class (parent 2 has a 1 in 4
Figure 6: Average iteration number required to find a legal 48-coloring for the <dsjc500.5> graph in function of the randomness level; abscissa: x, the randomness level; ordinate: the average iteration number
chance). If x = 0.5, it means that both parents have an equal probability (a fifty-fifty chance to be chosen); this almost corresponds to the standard GPX. If x = 1, it means that the child is a copy of parent 1; there are no more crossovers and therefore HEAD is a TabuCol with two initial solutions. When x becomes further from the value 0.5, the chance and diversity brought by the crossover decrease. Figure 7 shows in abscissa the probability x and in ordinate the average number of necessary iterations required to find a legal 48-coloring (as in the previous test).
It can be remarked initially that the results are clearly symmetrical with respect to x. The best results are obtained for 0.4 ≤ x ≤ 0.6. The impact of this parameter is weaker than that of the previous one: the control of the reduction in diversification is finer. This version of GPX is called unbalanced GPX and noted U(x) with x ∈ [0 ; 1] in tables 2 and 3. It is used for three graphs <le450_25c>, <le450_25d> and <r1000.5> since the standard GPX does not operate effectively.
5.3 Test on parent replacement: systematic or not
In HEAD, the two children systematically replace both parents, even if they have worse fitness values than their parents. This replacement rule is modified in this test. If the fitness value of the child is lower than that of its parents, the child automatically replaces one of the parents. Otherwise, we introduce a probability x corresponding to the probability of the parent replacement, even if the child is worse than his parents. If x = 1, the replacement is systematic as in standard HEAD and if x = 0, the replacement is performed only if the children are better (lower fitness value). When the x-value decreases, the diversity also decreases. Figure 8 shows in abscissa the parent replacement probability x and in ordinate the average number of iterations required to find a legal 48-coloring (as in the previous test).
If the parent replacement probability x = 0 or a very low 0.1, then more time is required to produce the results. The absence or the lack of diversification is shown to penalize the search.
Figure 7: Average number of iterations required to find a legal 48-coloring for <dsjc500.5> graph according to the imbalanced crossover; abscissa: x, probability to select the first parent at each step of GPX ; ordinate: average iteration number
However, for a large range of values: 0.3 ≤ x ≤ 1, it is not possible to define the best policy for x criterion. The dramatic change in behavior of HEAD occurs very quickly around 0.2.
These studies enable a clearer understanding of the role of the diversification operators (crossover and parent updating).
The criteria presented here, such as the random level of the crossover or the imbalanced level of the crossover, have shown their efficiency on some graphs. These GP X modifica-tions could successfully be applied into future algorithms in order to manage the diversity dynamically.
6
Conclusion
We proposed a new algorithm for the graph coloring problem, called HEAD. This memetic algorithm combines the local search algorithm TabuCol as an intensification operator with the crossover operator GPX as a way to escape from local minima. Its originality is that it works with a simple population of only two individuals. In order to prevent premature convergence, the proposed approach introduces an innovative way for managing the diversification based on elite solutions.
The computational experiments, carried out on a set of challenging DIMACS graphs, show that HEAD produces accurate results, such as 222-colorings for <dsjc1000.9>, 81-colorings for <flat1000_76_0> and even 47-81-colorings for <dsjc500.5> and 82-81-colorings for <dsjc1000.5>, which have up to this point only been found by quantum annealing [21] with a massive multi-CPU. The results achieved by HEAD let us think that this scheme could be successfully applied to other problems, where a stochastic or asymmetric crossover can be defined.
Figure 8: Average number of iterations required to find a legal 48-coloring for <dsjc500.5> graph in function of the parents’ replacement policy; abscissa: parent replacement probability; ordinate: average number of iterations
its role in the diversification process. Some interesting criteria have been identified, such as the crossover’s levels of randomness and imbalance. Those criteria pave the way for further researches.
Acknowledgement
Authors gratefully acknowledge Jéremy Omer (INSA, Rennes, France) and the anonymous reviewers for their useful comments and constructive suggestions which helped to improve the paper.
References
[1] K. Aardal, S. Hoesel, A. Koster, C. Mannino, A. Sassano, Models and solution techniques for frequency assignment problems, Quarterly Journal of the Belgian, French and Italian Operations Research Societies 1 (4) (2003) 261–317.
[2] M. Dib, A. Caminada, H. Mabed, Frequency management in Radio military Networks, in: INFORMS Telecom 2010, 10th INFORMS Telecommunications Conference, Montreal, Canada, 2010.
[3] F. T. Leighton, A Graph Coloring Algorithm for Large Scheduling Problems, Journal of Research of the National Bureau of Standards 84 (6) (1979) 489–506.
[4] N. Zufferey, P. Amstutz, P. Giaccari, Graph Colouring Approaches for a Satellite Range Scheduling Problem, Journal of Scheduling 11 (4) (2008) 263 – 277.
[5] D. C. Wood, A Technique for Coloring a Graph Applicable to Large-Scale Timetabling Problems, Computer Journal 12 (1969) 317–322.
[6] N. Barnier, P. Brisset, Graph Coloring for Air Traffic Flow Management, Annals of Op-erations Research 130 (1-4) (2004) 163–178.
[7] C. Allignol, N. Barnier, A. Gondran, Optimized Flight Level Allocation at the Continental Scale, in: International Conference on Research in Air Transportation (ICRAT 2012), Berkeley, California, USA, 22-25/05/2012, 2012.
[8] M. R. Garey, D. S. Johnson, Computers and Intractability: A Guide to the Theory of N P-Completeness, Freeman, San Francisco, CA, USA, 1979.
[9] R. Karp, Reducibility among combinatorial problems, in: R. E. Miller, J. W. Thatcher (Eds.), Complexity of Computer Computations, Plenum Press, New York, USA, 1972, pp. 85–103.
[10] D. S. Johnson, C. R. Aragon, L. A. McGeoch, C. Schevon, Optimization by Simulated An-nealing: An Experimental Evaluation; Part II, Graph Coloring and Number Partitioning, Operations Research 39 (3) (1991) 378–406.
[11] N. Dubois, D. de Werra, Epcot: An efficient procedure for coloring optimally with Tabu Search, Computers & Mathematics with Applications 25 (10–11) (1993) 35–45.
[12] E. Malaguti, M. Monaci, P. Toth, An Exact Approach for the Vertex Coloring Problem, Discrete Optimization 8 (2) (2011) 174–190.
[13] S. Held, W. Cook, E. Sewell, Safe lower bounds for graph coloring, Integer Programming and Combinatoral Optimization (2011) 261–273.
[14] P. Galinier, J.-K. Hao, Hybrid evolutionary algorithms for graph coloring, Journal of Combinatorial Optimization 3 (4) (1999) 379–397.
[15] P. Galinier, A. Hertz, A survey of local search methods for graph coloring, Computers & Operations Research 33 (2006) 2547–2562.
[16] P. Galinier, J.-P. Hamiez, J.-K. Hao, D. C. Porumbel, Recent Advances in Graph Vertex Coloring, in: I. Zelinka, V. Snásel, A. Abraham (Eds.), Handbook of Optimization, Vol. 38 of Intelligent Systems Reference Library, Springer, 2013, pp. 505–528.
[17] E. Malaguti, P. Toth, A survey on vertex coloring problems, International Transactions in Operational Research 17 (1) (2010) 1–34.
[18] A. Hertz, M. Plumettaz, N. Zufferey, Variable Space Search for Graph Coloring, Discrete Applied Mathematics 156 (13) (2008) 2551 – 2560.
[19] O. Titiloye, A. Crispin, Graph Coloring with a Distributed Hybrid Quantum Annealing Algorithm, in: J. O’Shea, N. Nguyen, K. Crockett, R. Howlett, L. Jain (Eds.), Agent and Multi-Agent Systems: Technologies and Applications, Vol. 6682 of Lecture Notes in Computer Science, Springer Berlin / Heidelberg, 2011, pp. 553–562.
[20] O. Titiloye, A. Crispin, Quantum annealing of the graph coloring problem, Discrete Op-timization 8 (2) (2011) 376–384.
[21] O. Titiloye, A. Crispin, Parameter Tuning Patterns for Random Graph Coloring with Quantum Annealing, PLoS ONE 7 (11) (2012) e50060.
[22] A. Hertz, D. de Werra, Using Tabu Search Techniques for Graph Coloring, Computing 39 (4) (1987) 345–351.
[23] P. Galinier, A. Hertz, N. Zufferey, An adaptive memory algorithm for the k-coloring problem, Discrete Applied Mathematics 156 (2) (2008) 267–279.
[24] C. Fleurent, J. Ferland, Genetic and Hybrid Algorithms for Graph Coloring, Annals of Operations Research 63 (1996) 437–464.
[25] J.-K. Hao, Memetic Algorithms in Discrete Optimization, in: F. Neri, C. Cotta, P. Moscato (Eds.), Handbook of Memetic Algorithms, Vol. 379 of Studies in Compu-tational Intelligence, Springer, 2012, pp. 73–94.
[26] D. S. Johnson, M. Trick (Eds.), Cliques, Coloring, and Satisfiability: Second DIMACS Implementation Challenge, 1993, Vol. 26 of DIMACS Series in Discrete Mathematics and Theoretical Computer Science, American Mathematical Society, Providence, RI, USA, 1996.
[27] Z. Lü, J.-K. Hao, A memetic algorithm for graph coloring, European Journal of Opera-tional Research 203 (1) (2010) 241–250.
[28] Q. Wu, J.-K. Hao, Coloring large graphs based on independent set extraction, Computers & Operations Research 39 (2) (2012) 283–290.
[29] J.-K. Hao, Q. Wu, Improving the extraction and expansion method for large graph col-oring, Discrete Applied Mathematics 160 (16–17) (2012) 2397–2407.
[30] D. C. Porumbel, J.-K. Hao, P. Kuntz, An evolutionary approach with diversity guarantee and well-informed grouping recombination for graph coloring, Computers & Operations Research 37 (2010) 1822–1832.
[31] R. Lewis, Graph Coloring and Recombination, in: J. Kacprzyk, W. Pedrycz (Eds.), Hand-book of Computational Intelligence, Springer Berlin Heidelberg, Berlin, Heidelberg, 2015, Ch. Graph Coloring and Recombination, pp. 1239–1254.
[32] D. Gusfield, Partition-distance: A problem and class of perfect graphs arising in cluster-ing, Information Processing Letters 82 (3) (2002) 159–164.