COLOR CODING FOR A FACSIMILE SYSTEM
by
ROBERT DAVID SOLOMON
B.S.E.E., Polytechnic Institute of Brooklyn (1967)
S.M., Massachusetts Institute of Technology (1968)
E.E., Massachusetts Institute of Technology (1970)
SUBMITTED IN PARTIAL FULFILLMENT OF THE REQUIREMENTS FOR THE DEGREE OF
DOCTOR OF PHILOSOPHY at the
MASSACHUSETTS INSTITUTE OF TECHNOLOGY
August 1975
1~~
Signature of Author. . . . . . . . . . . . . .
Department of Elect,ical Engineering, August 29, 1975
Certified by .0... .. . . . . .
T is Supervisor
Accepted by. . .
c.
. .Chairman, Departmental Committee on Graduate Students
Erchives
OCT 271975
COLOR CODING FOR A FACSIMILE SYSTEM by
Robert David Solomon
Submitted to the Department of Electrical Engineering and Computer Science on August 29, 1975, in partial fulfillment of the require-ments for the Degree of Doctor of Philosophy.
ABSTRACT
A fundamental color coding system suitable for facsimile trans-mission is initially specified with practical engineering and psycho-physical constraints. This system achieves information compression
by first accurately transforming the measured red, green, and blue reflectances at each picture element (pel) into a luminance and two CIE UCS chromaticity components which are linear in the sensation domain. The chromaticity components are then spatially filtered, coarse sampled, and coarse quantized. The compressed chromaticity components are then transmitted and linearly interpolated at the receiver and combined with the luminance to yield red, green, and blue signals, which are further processed to correct for the non-linear photographic process.
The processing operations of color scanning, chromaticity quantization, spatial filtering and coarse sampling, and pre-repro-duction color correction are examined in detail to optimize their individual and interactive performance characteristics. Four areas of original contribution result from these studies.
Accurate determination of the tristimulus coordinates is achieved by transforming the color head functions in the chromat-icity plane. A Hex-Affine-Triangle (HAT) transform is derived which uses a piecewise linear transform approximation to accurately convert the color scanner outputs to chromaticity values.
The gamut of chromaticity values in a three primary color picture is shown to be a function of the luminance level. A luminance scaled chromaticity (LSC) transform is derived which makes the new chromat-icity values independent of luminance and also permits a much larger number of reproducible chromaticity values for frequently occurring pastels (such as light flesh tones) for a fixed number of chromaticity quantization levels.
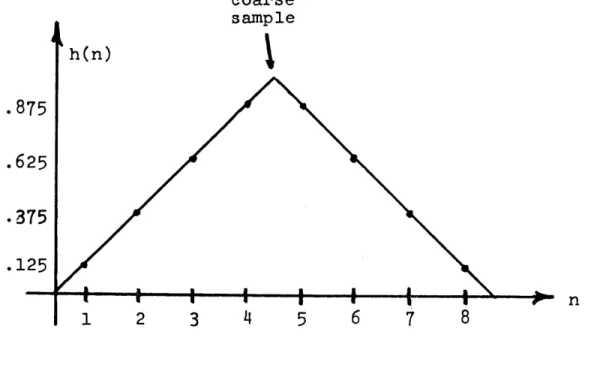
-53-In examining the techniques for spatially compressing the chromaticity components, the operations of filtering and coarse sampling at the transmitter and interpolation at the receiver are shown to yield a number (equal to the spatial compression factor) of different overall filter functions at each pel in the regions between coarse samples. These dissimilar functions can result in significant artifacts, and so the parameters must be carefully chosen to make the filter functions as similar as possible.
Efficient conversion from the CIE transmitted coordinates to red, green, and blue separations for reproduction by a specific subtractive dye process is shown to involve two linear transforma-tions, one in the linear primary domain and the other in the log-arithmic density domain. A piecewise-linear matrix transform is developed to approximate the inverse of the dye process which is not representable in closed form.
Color pictures processed by the system are shown to be of excellent quality compared to the original. However, they contain only 1/16 the chromaticity information and 37 percent of the total information of the original. Thus, the encoded picture can be trans-mitted in one-third the time by multiplexing the chromaticity informa-tion in the unused 11 percent scan blanking region of a conveninforma-tional facsimile signal.
Thesis Supervisor: William F. Schreiber Title: Professor of Electrical Engineering
Acknowledgments
Due to outside professional commitments, the rate of progress of this thesis has varied considerably over the past four years. During this time Professor Schreiber, my thesis and graduate advisor, has been very understanding and has given me realistic encouragement and support
at various critical phases. My choice of readers, Doctors Richards, Tribus, and Troxel , has proven very fortuitous since the readers rep-resented diverse areas of specialization, professional backgrounds, and philosophical outlooks which they enthusiastically applied to provide
a broader insight into my multidisciplinary thesis problem. The late Professor Mason was an original reader and I am greatly indebted to him for his personal interest and encouragement in the early stages of my research.
My thesis research utilized the facilities of the Research Laboratory
of Electronics and I am grateful for the generous support of many competent staff members. The first four years of my research were supported under a grant to MIT from the Associated Press. In addition, the General Radio Company in part supported the early period of my graduate work.
TABLE OF CONTENTS Page Abstract - - - - - - - - - - - - - - - - - - - - - - - - - - - - - - - 2 Acknowledgments - - - - - - - - - - - - - - - - - - - - - - - - - - -
4
Table of Contents - - - - - - - - - - - - - - - - - - - - - - - - - - 5 List of Figures - - - - - - - - - - - - - - - - - - - - - - - - - - - 7 Chapter 1. Introduction - - - - - - --- - - - - - - - - - - - - - - 101.1 - The Basic Problem - - - - - - - - - - - - - - - - - - - - 11
1.2 - Fundamental Constraints on the Color Facsimile System - - 13
1.3 - A Preliminary Model of the Color Facsimile System - - - - 17
1.4 - Summary - - - - - - - - - - - - - - - - - - - - - - - - - 19
Chapter 2. Color Space and Chrominance Quantization - - - - - - - - 21
2.1 - Colorimetry - - - - - - - - - - - - - - - - - - - - - - - 22
2.2 - Color Space Representations and Transformations --- 26
2.3 - Uniform Sensation Color Space - - - - - - - - - - - - - - 30
2.4 - The Luminance Scaled Chromaticity (LSC) Transform - - - - 35
Chapter 3. The Chrominance Spatial Filtering Process - - - - - - - - 49
3.1 - The Pschophysical Basis For Chrominance Spatial Filtering 50 3.2 - The Overall Filter Function - - - - - - - - - - - - - - - 52
3.3 - Luminance Filtering For the LSC Transform - - - - - - - - 67
Chapter 4. Colorimetric Measurement and Photographic Reproduction Approximations - - - - - - - - - - - - - - - - - - - - - 70
4.1 - The Color Photographic Process - - - - - - - - - - - - - - 71
4.2 - Quasi-Tristimulus Color Measurement - - - - - - - - - - - 76
Chapter 5. 5.1 -5.2 -5.3 -5.4 -Chapter 6. 6.1 -6.2 -6.3 -Appendix I. Appendix II Appendix I Appendix I Appendix V Appendix V RD -f "n es Page
Simulation of the Color Facsimile System - - - - - - - - 101
Introduction - - - - - - - - - - - - - - - - - - - - - - 102
The Color Scanner - - - - - - - - - - - - - - - - - - - - 104
The Computer and Software Systems - - - - - - - - - - - - 108
Reconstruction of Color Pictures - - - - - - - - - - - - 112
Color Picture Evaluation and Conclusions - - - - - - - - 114
Subjective Analysis of Compressed Color Pictures - - - - 115
Topics For Further Research - - - - - - - - - - - - - - - 120
Conclusions - - - - - - - - - - - - - - - - - - - - - - - 122
Linear Transformation To A New Set of Color Primaries - 123 Inversion of Bilinear Chromaticity Color Space - - - - 125
[I. Derivation of the LSC Transform - - - - - - - - - - - 126
7. A Mathematical Analysis of Dye Correction - - - - - - - 129
. Color Transform For New Primaries With Specified Chromaticities - - - - - - - - - - - - - - - - - - - - 134
[. Numeric System Parameters and Transforms - - - - - - - 136
- - - - - - - - - - - - - - - - - - - - - - - - - - - - - 140
7
-LIST OF FIGURES
Figure Page
1-1 Basic Model of a Color Facsimile System - - - - - - - - - 18
2-1 CIE R,G,B Matching Functions - - - - - - - - - - - - - -- 23
2-2 Luminous Efficiency Function - - - - - - - - - - - - - - 25
2-3 R,G,B Primary Color Space - - - - - - - - - - - - - - - - 27
2-4 Linearly Transformed L, C1 , C2 Color Space - - - - - - - 29
2-5 UCS Chromaticity Diagram - - - - - - - - - - - - - - - - 33
2-6 Bilinearly Transformed C1, C2 Color Space - - - - - - - - 34
2-7 R,G,B Separations of Group Picture - - - - - - - - - - - 36
2-8 L, C1, C2 Components of Group Picture - - - - - - - - - - 37
2-9 Chromaticity Loci at Constant Luminance - - - - - - - - - 38
2-10 L and LSC Transformed C1 , C2 Components of Group Picture- 42 2-11 R,G,B Separations of Test Picture - - - - - - - - - - - - 43
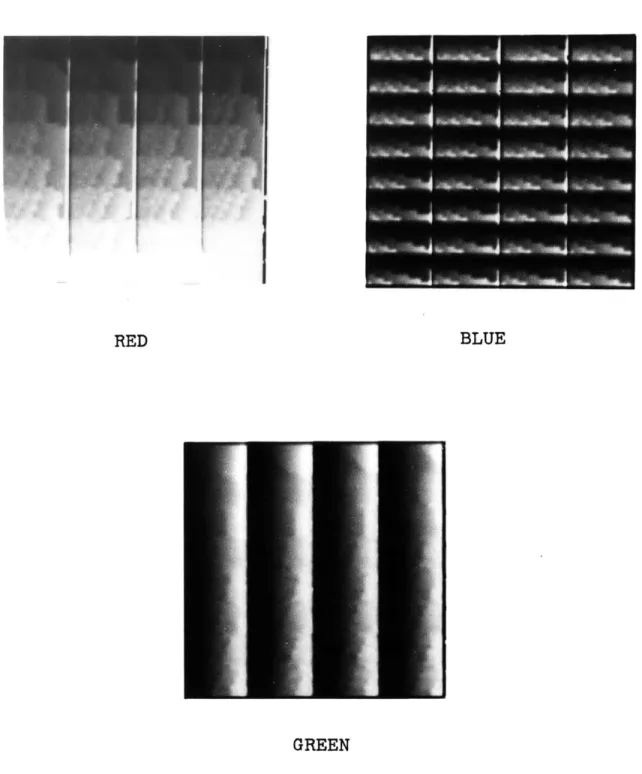
2-12 R,G,B Separations of Compressed Test Picture - - - - - - 44
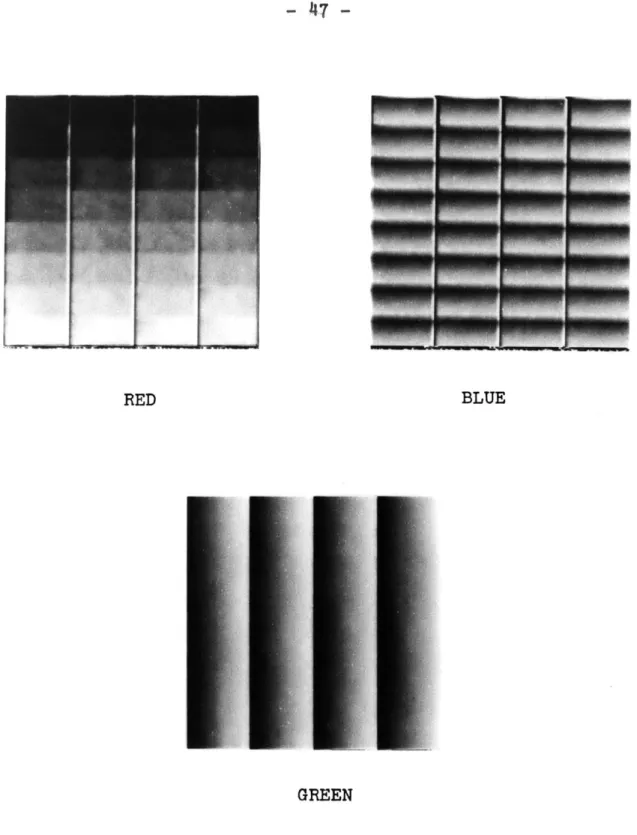
2-13 R,G,B Separations of LSC Transformed Compressed Test Picture - - - - - - - - - - - - - - - - - - - - - - - - - 47
3-1 The Four Stages of the Overall Filter Function - - - - - 53
3-2 Two Dimension Filter Block Diagram - - - - - - - - - - - 55
3-3 The Symmetric Transmitter Filter Function - - - - - - - - 57
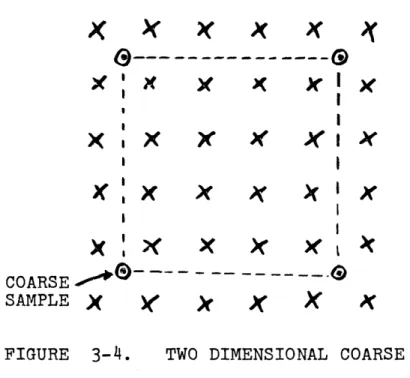
3-4 Two Dimensional Coarse Sampling and Interpolation - - - - 58
3-5 The Continuous Interpolation Filter Function - - - - - - 59
3-6 The Sampled Interpolation Function - - - - - - - - - - - 59
3-7 Triangular Transmitter Filter Function - - - - - - - - - 62
3-8 OFF for the Transmitter Filter of Figure 3-7 - - - - - - 63
3-9 Modified Transmitter Filter Function - - - - - - - - - - 64
3-10 OFF for the Modified Filter of Figure 3-9 - - - - - - - - 65
3-11 R,G,B Separations of Test Picture Processed by the OFF of Figure 3-8 - - - - - - - - - - - - - - - - - - - - - - 66
Block Dye Approximation - - - - - - - - - - - - - - - -Basic Model of the Color Photographic Process -
-Taking Sensitivity of Ektachrome Reversal Film -Dye Transmission Curves for Ektachrome Slides - -Density - Log Exposure Curves for Ektachrome Film Color Head Sensor Response Functions - - - - -
-Color Head Filter Quasi Luminosity Function - - -Dye Gamut for RC Print Paper -Dyes - - - - - - - -Dye Gamut Measured by the Color Head Filters - -U-V Affine Transform - - - - - - - - - - - - - -U-V Transform with Second Order u - - - - - - -
-Hex-Affine-Triangular (HAT) Transform - - - - - -Transmitter Encoder with Color Head Correction Transforms - - - - - - - - - - - - - - - - - -
-Receiver Decoder with Pre-dye Primary and Density 4-1 4-2 4-3 4-4 4-5 4-6 4-7 4-8 4-9 4-10 4-11 4-12 4-13 4-14 4-15 4-16 4-17 4-18 4-19 5-1 5-2 5-3 5-4 5-5 Figure Page 73 - - - 75 - - - 75 - - - 75 - - - 77 - - - 80 82 - - - 83 84 86 - - - 88 - - - 89 - - - 91 Transforms - - - - - - - - - - - - - - - - - - - -
-Dye Gamut of Photograph Made Directly from CIE R,G,B Separations - - - - - - - - - - - - - - - - - - - -
-CIE R,G,B and R',G',B' Primary Triangles - - - - - -Dye Gamut of Photograph with R',G',B' Coordinates - -Dye Gamut of Photograph with Hex -Dye Correction
Transform - - - - - - - - - - - - - - - - - - - - - -Overall Chromatic Reproduction Accuracy of the
Facsimile System - - - - - - - - - - - - - - - - - -PDP-9 Color Image Processing Computer System - - - -Color Facsimile Scanner Optics - - - - - - - - - -
-Schematic Representation of the Color Head Response Functions - - - - - - - - - - - - - - - - - - - - -
-Monochrome Receiver and Color Transmitter Facsimile Interface - - - - - - - - - - - - - - - - - - - - -
-COPS System Block Diagram - - - - - - - - - - - - -
-91 - 93 - 95 - 96 - 98 - 100 - 103 - 105 -
106
- 107 - 110- 9
-Figure Page
6-1 Group Picture - - - - - - - - - - - - - - - - - - - - - - 117
a) Scanned Color Corrected Unprocessed Original b) Scanned Unprocessed Original Without Output Dye
Correction
c) Fully Processed, Compressed with LSC Transform
6-2 Cameraman Picture - - - - - - - - - - - - - - - - - - - - 118 a) Scanned Color Corrected Uncompressed Original
b) Compressed Without LSC Transform c) Compressed with LSC Transform
6-3 Portrait Picture - - - - - - - - - - - - - - - - - - - - 119
a) Scanned Color Corrected Uncompressed Original b) Compressed Without LSC Transform
c) Compressed with LSC Transform
TABLES
Table Page
2-1 Frequency of Occurrence of C -C2 Values for the Group
Picture - - - - - - - - - - - - - - - - - - - - - - - - 41
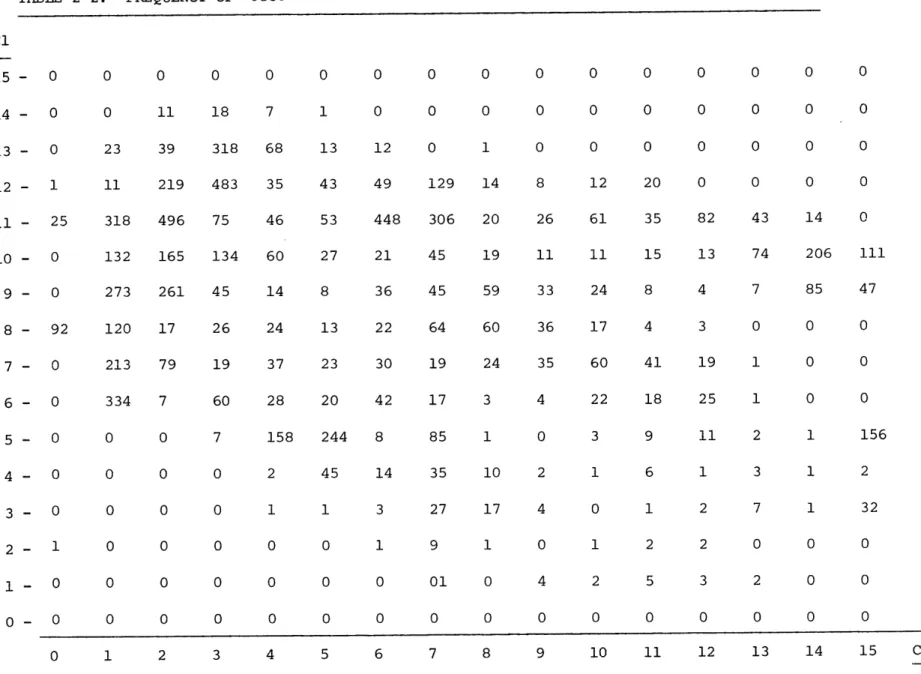
2-2 Frequency of Occurrence of LSC Transformed C
1-C2
Valuesfor the Group Picture - - - - - - - - - - - - - - - - - 48 A-1 Quasi-Luminance Function Accuracy - - - - - - - - - - - 137 A-2 Hexagonal Affine Transform for the Color Head Inputs - 138 A-3 Hexagonal Affine Transform for Pre-Dye Correction - - - 139
I. Introduction
1.1: The Basic Problem
1.2: Fundamental Constraints on the Color Facsimile System 1.3: A Preliminary Model of the Color Facsimile System
- 11
-1.1 The Basic Problem
As color pictures become a more common feature in newspapers, increased demands will be made of the wire services to provide fast, high quality color facsimile transmission. In addition, the advent of color office copying equipment suggests the possibility of transmitting color as well as black and white interoffice pictures via telephone lines. Although this dissertation concentrates on the specific problem of color facsimile, a number of general principles are derived, based on the psychophysics of color vision, subtractive dye reproduction theory, and digital signal processing techniques which may be directly applied to a wide range of
color picture transmission and storage systems.
Since the infancy of facsimile there have been few innovations in the transmission of color pictures. Today, color facsimile transmissions are still accomplished by scanning a color print with a conventional rotating drum monochrome facsimile transmitter. Three successive scans are required, with first a red, then a green, and finally a blue filter placed in front of the photodetector. The three received monochrome pictures correspond to the cyan, magenta, and yellow printers from which the color printing plates are made. The number of color facsimile transmissions relative to black and white is very small due to the threefold increase in transmission time (over 24 minutes) and the poor color quality which results from the crude color scanning techniques.
This dissertation examines and develops solutions for the two major problems of present day color facsimile:
color (chrominance
1)
be compressed and coded to a small fraction of the black and white luminance information so that a color picture may be transmitted in the same time as a monochrome picture (8 minutes) and be subjectively equivalent to theoriginal?
2) What techniques are necessary to scan an original color print and make a photographic reproduction from red, green, and blue separations, so that the color rendition and overall subjective quality of the output print is acceptably similar to the input print?
It might be suggested that the second problem has already been solved since methods for high quality color reproduction using an electronic scanner are well known and commonly used.(1,2) However, in order to solve the first problem, the human eye must be somehow fooled into believing that the
compressed picture contains as much information as the original. Colors should be represented in terms of psychophysical coordinates. These co-ordinates should also be chosen so that information which is visually redundant due to the limited color and spatial acuity of the eye can be
easily removed by coarse linear quantization and spatial filtering. Thus techniques can be developed at the transmitter for making valid colorimetric measurements at each picture element (pel) on the scanned print. In addition,
due to the discrete nature of digital systems, the chrominance and luminance components should be chosen so that linear quantization will yield equal
lIn parallel with the etymological structure of luminosity and luminance, the author is taking the liberty of defining "chrominance" to be the two dimensional component which when added to the one dimensional luminance yields a three dimensional color space. Chapter Two more fully examines the two dimensional nature of chrominance.
- 13
-steps in color sensation. At the receiver, a more difficult problem arises in inverse transforming the processed psychophysical variables
into color separation reflectances which will yield color photographic prints having the specified colorimetric values (figure 1-1).
This dissertation has two overall contributions. First, it develops practically engineered algorithms (which are compatible with existing facsimile specifications) to significantly compress the chrominance
information by coding the psychophysical components. Secondly, efficient transforms are developed for converting back and forth between these components and photographic media with high colorimetric accuracy.
1.2 Fundamental Constraints on the Color Facsimile System
Picture coding operations may be classified according to what portion of the picture is operated on at one time. At one extreme are transform processors (e.g., Fourier and Hadamard) which necessitate storing the
entire picture in a random access memory (RAM). Digitizing each of the red, green, and blue components of a standard 8 by 10 inch color picture to six bits with a facsimile resolution of 100 pels per inch,
results in over ten million bits of storage. Not only are such proc-essors unfeasible from an economic standpoint, but also they incur severe delays between transmission and reception of the picture. A "hot news" picture must first be scanned for eight minutes then processed for at least another eight minutes and finally transmitted, resulting in a three-fold delay in effective transmission time and thereby offsetting the gains of color compression.
The simplest type of processor operates only once on a single pel, which is then immediately transmitted. This limited operation precludes
for effective color compression. An intermediate solution which effectively permits real time transmission (i.e., the picture is reproduced at the
receiver, as it is scanned at the transmitter) is to store and process a small group of lines. The resulting transmission delay of several lines is negligible for a facsimile scan rate of 100 lines per minute. However, the filter and interpolation functions are now restricted to a width of only several sample points and are most easily implemented as superposition functions.
The coding algorithms must be designed to process pels in the 500 1sec intersample periods of the scanner. Since the entire picture is not
stored, the window processor alone cannot use adaptive coding picture processing techniques (e.g., Karhunen-Loeve statistical vector basis) and so the coding algorithms must be designed to reproduce a wide variety of color pictures equally well.
Color television is the only system which makes use of color coding techniques.(4,5) In the early 1950's the color television researchers were unable to make use of modern solid state digital computer technology.
However, the system is very sophisticated for its time and many parallels can be drawn between television and facsimile. Both are electro-optical scanning systems where a one dimensional video signal is transmitted and used to synchronize a similar scanning system at the receiver, provide brightness information at each pel, and set the reference white level.
Television requires constant synchronization of the horizontal and vertical sweep since it transmits 60 fields per second or roughly five million pels per second, whereas facsimile only transmits a single, higher resolution
frame, of 800,000 pels in eight minutes, and therefore only a single synchronization pulse is needed at the start of the picture. Both the
- 15
-facsimile transmitter and receiver have inexpensive crystal clocks with an accuracy of one part per ten million which stay in synchronization within
0.1 pel over the duration of a single picture transmission.
Scanning systems all have blanking periods in the direction of scan to enable an electron or laser beam to retrace or to allow a region of the scanning drum to contain a clip for securing the picture. The
blanking period in television contains an elaborate synchronization signal, so the chromaticity information has to be frequency multiplexed in a
fairly complex way during the active scan region. In facsimile, a regular synchronization signal is not necessary and so the blanking region which is 6 to 12 percent of the scan duration can be used to carry other time multiplexed information. A basic constraint on the color facsimile
system developed in this dissertation specifies that the color information which normally necessitates two additional pictures be compressed by a factor of 16:1 and time division multiplexed into an 11 percent scan blanking period. Thus, the three separations can be transmitted in the same time that it takes to send a single monochrome picture. The signal
is black and white compatible since the active scan video signal still contains the unaltered full resolution luminance information which is combined with the compressed chrominance to yield the red, green, and blue separations. If received by a monochrome receiver, the chromaticity
information in the scan blanking region will be ignored and only the luminance will be reproduced. Thus installation of a color facsimile system will not disrupt, degrade or make obsolete the existing monochrome transmitters and receivers in the network. Chapter Two further discusses psychophysical reasons why the luminance is the best choice for the high
The problem, now, is how to achieve the required compression factor of 16:1 to satisfy the above multiplexing constraint. Fortunately, some research on the spatial acuity for chromaticity(6,7) has shown that the resolution of each chromaticity component can be reduced to approximately 10 to 30 percent of the luminance resolution before noticeable picture
degradation occurs. Color television researchers used this psychophysical property to achieve compression ratios of 8:1 and 8:3 for the Q and I chromaticity signals. (8,9)At the time of color television development the cost of line storage hardware was prohibitive, and so the chromaticity television signals are only filtered in one dimension by simple analog time
(10)
domain filters. Much more recent work has shown that the chromaticity signal can in fact be spatially smeared in each direction to at least 1/4 of the full luminance resolution without objectionable degradation in
subjective picture quality. Thus the chromaticity components in the facsimile system developed in this dissertation are digitally filtered and coarsely sampled at 1/16 of the full two dimensional resolution, yielding the sought after compression factor of 16:1. The exact details of the filtering
operation are examined in Chapter Three.
Another way in which the digitized chrominance information is compressed is by coarsely quantizing it to a small number of discrete levels. Since this thesis deals solely with chrominance compression,
various existing luminance compression algorithms are not being implemented. However, techniques have been developed for transmitting high quality
luminance with only three to four bits resolution (16 levels). (11)
Studies indicate that the chromaticity components can also be restricted to four bits each or 256 chromaticity values.(lO) Some noticeable
- 17
-this constraint, sophisticated methods are developed in Chapter Two to effectively utilize the limited number of discrete levels to significantly reduce quantization artifacts.
1.3 A Preliminary Model of the Color Facsimile System
The previous section constrained the system to utilize stream processing, real time algorithms, with several lines of storage for filtering and interpolating the chromaticity components. A compression factor of 16:1 is achieved by coarse sampling the spatially filtered components. The chrominance information is also coarsely quantized to eight bits (four bits for each component) and the coded chrominance
signal is time multiplexed into the 11 percent scan blanking period. A preliminary model of the color facsimile system is shown in
figure 1. The transmitter consists of a color scanner with red, green, and blue photodetectors and a chrominance luminance conversion transform, followed by the chrominance spatial filter, coarse sampler, coarse
quantizer and encoder. At the receiver, the chromaticity components are interpolated, and then inversely transformed with the luminance to red, green, and blue signals which are pre-corrected for the non-ideal dyes encountered in photographic or printing reproduction processes, and are then simultaneously reproduced as red, green, and blue monochrome
separations.
A channel encoder, channel model, and channel decoder should be
inserted between the transmitter source encoder and receiver source decoder, but this thesis only examines the source coding problem, and so assumes an ideal channel. In television systems, a relatively poor signal to noise ratio can be tolerated because the eye tends to
COLOR COLER G. LUMINANCE C2 SPATIAL FILTER &
PRINT B TRANSFORM L COARSE SAMPLER
COLOR FACSIMILE TRANSMITTER
FROM Ci CHROMINANCE C1 INVERSE R PRE-DYE R COLOR COLOR
CHANNEL u SPATIAL TRANSFORM G CORRECTION G S SEPARATION PRINT
DECODER C2 INTERPOLATOR I 2 L, C1 , C2 B TRANSFORM B REPRODUCTION REPRODUCTION
O LL
COLOR FACSIMILE RECEIVER
BASIC MODEL OF A COLOR FACSIMILE SYSTEM
- 19
-integrate out the uncorrelated frame to frame noise, yielding a much higher perceived signal to noise ratio. In facsimile, a single frame
is transmitted and may be reproduced hundreds of thousands of times in newspapers. Therefore, nearly flawless transmission must be insured by
the channel coder since a strategically located error such as a spot on a prominent politician's nose might necessitate retransmission of
the entire picture.
The interpel sample period for facsimile is 500 y sec or a few thousand times the corresponding period for television. Therefore, in addition to the operations of sampling, filtering, quantizing, and packing there is sufficient time to perform complex chrominance
trans-forms with a high speed digital processor. Color coders for television systems cannot afford this computational luxury, but color television is an additive primary system and so many of the chrominance transforms required to correct for subtractive dye systems encountered in facsimile are unnecessary in television.
1.4 Summary
There has been much prior "knob-twiddling" by earlier researchers of a limited number of color coding parameters so that several of these
(i.e., the chrominance spatial compression factor) can be set to a
reasonable value without further experimentation. Having specified these basic parameters, the author is able to enter into new areas of color coding research by developing algorithms which optimize color picture quality given basic system architecture constraints and certain pre-specified key parameter values.
This thesis takes the approach of attempting to work in the mathemat-ically and physmathemat-ically defined colorimetric system in which the psycho-physical data of most researchers is usually represented. The next chapter examines various transforms of the chromaticity components in the standard colorimetric color space.
II.
Color
2.1: 2.2: 2.3: 2.4: - 21-Space and Chrominance Quantization Colorimetry
Color Space Representations and Transformations Uniform Sensation Color Space
2.1 Colorimetry
The colorimetric design of a system to effectively process color photographs must be based on the psychophysics of color vision and the
limitations of color photography. These disciplines must be inter-related in evolving algorithms which efficiently compress and code color pictures.
At the foundation of the psychophysics of color vision is the
Young-Helmholtz model of the eye which describes the retina as containing three types of cone receptors, each with independent spectral sensation
(12,13)
characteristics. The three cone responses peak in roughly the red, green, and blue regions of the spectrum. The cone model is the basis of colorimetry where any color sensation due to a stimulus with a particular spectrum can be represented by three numbers, namely the neural response of each cone. This gives rise to the phenomenon of metamerism which occurs when two different spectral distributions
equally activate the three cone mechanisms. Thus an infinite number of possible spectra, referred to as metamers, can be mapped by the eye into
the same color sensation.
The three dimensional nature of color vision is the basis for the classic matching experiments where the radiances of three additively projected primary light sources with spectral distribution, p (X), are
adjusted to match an unknown color source. The standard 1931 CIE measurements used three narrowband spectral distributions centered at
700.0 nm, 546.1 nm and 435 nm to match narrowband regions along the
visible spectrum. Three color matching functions, x.(X), result from J
-
23
-o .30 - - -- - -. . . . . .--- --... --- -- - ---. .. .. -.--.-- - --.w
-j .2 0-.-x
.. ... .. . ..- - - -.-.-- -.1. wlsz
466 456 568 W56 m6 56WAVELENGTH
(NM)
matching function indicate that the match required the corresponding primary light source to be added to the light being matched. Further matching experiments show that any color stimulus, s(
x),
may now berepresented by the three chromaticity coordinates, R, G, B, which represent the amount of each primary required to match the stimulus.
x.(X) =
r(X),
g(x), b(X)X. = fx.(X) s(X) dA (2.1-1)
A X.= R, G, B
e J
where A is the range of wavelengths of visual response, namely 380 to
e
770 nanometers (nm).
Many sets of primaries other than the CIE standard primaries may be used as the basis for specifying colors. The conversion to a new primary system is detailed in Appendix I.
The luminance of a color is a measure of the apparent brightness. Its value can be related to the radiant energy of a particular color by
the photopic luminosity curve which is a plot of luminous efficiency as a function of wavelength. The luminosity function peaks in the green,
falls off in the red and decreases more sharply in the blue (figure 2-2). Luminance is a very important parameter since its value must be trans-mitted at full spatial resolution as the monochrome signal for black and white system compatibility. Even in a strictly color system, the
luminance must be transmitted with maximum spatial resolution since the eye has the greatest acuity for this visual component. (14)
From Grassmann's laws of additive color mixture it follows that the luminance of an additive mixture of colors is a sum of the individual
(15)
25
-in
. . .. . . .7 . . . .. . . . . . . . . . . . . . . .. . . . . . .. . . . . . . .. . .. . . . .. . . . . . . .. . . . . . . . . . . . .. . . . . . . . . . . ... 7 . . . . . . . . .. . . . ... ... ... ... . . . . . . . . . . .. . . . ... . . .. . . .... ...WAVELENGTH (NM)
LUMINOUS EFFICIENCY FUNCTION
z
L-0-w
:3 Clw
N 40...
...
...
...
...
...
...
...
...
... ...
...
...
... ... ... 7 .. . ... ... .. ... . . . ... . . . . . . . . . . .. . .. .. .. . . .. .. 7 . .. . .... . .. .... .. .. .. . . . .. ... ... . .... . . .. .. .. 7 .. ... .. . ... . .. . . . . .. . . ... . . .. . . . 7FIGURE 2-2.
primaries, each of the color components contributes to luminance.
L = L R + L G + L B (2.1-2)
r
g
b
Where each luminosity coefficient, L ., is the integral of the product of the photopic luminosity curve and the primary distribution P. (X) over wavelength.
L. = f L (X)P. (X)dl (2.1-3)
2.2 Color Space Representations and Transformations
Three dimensional color space can be described by a variety of triads of parameters. A color can be specified by its red, green, and blue coordinates in an infinite number of primary bases. In the case of
subtractive dyes, a color is completely described by knowing the amount of the cyan, magenta, and yellow dyes, assuming a standard illuminant. A more qualitative description of color results from specifying the
brightness, hue (common color name), and saturation (degree of color purity ranging from white through pastel to a fully saturated mono-chromatic color). The latter representation is noteworthy since now the triad of parameters contains luminance as one term and the hue and
saturation pertain solely to the chrominance.
In any physical set of primaries, the range of synthesizable colors can be represented as being contained in a unit cube (figure 2-3) by normalizing maximum values of the primaries (i.e., to maximum white print reflectance under specified illumination)
R G B =1 (2.2-1)
-
27
-R
(YELLO
(MAGENTA)
(WHITE)
(GREEN)
(BLUE),
1
(CYAN)
R, G, B CUBE COLOR SPACE
W)
If the primaries are each quantized to six bits, then over a quarter of a million discrete possible colors lie within the cube. Perpendicular axes, resulting in a cubic region of permissible colors, are used solely as a convenience in drawing, since the exact angular relationships
between axes or even the shape of the color space is meaningless unless some spatial distance metric can be defined as a function of the plotted parameters.
It is also convenient to normalize the luminance, so that by 2.1-2 maximum luminance is unity.
L + L + L =1 (2.2-2)
r
g
b
The brightest color in a reproduction system is usually the white point and since this occurs when the three primaries are at their maximum unity value, whenever the primaries have the same value, the color specified will be achromatic.
at achromatic points: R = G = B = L (2.2-3)
The primaries can be linearly transformed to a new coordinate system, where one of the new components is luminance. The two remaining
components are measures of chrominance.
L R
Cl
=
G (2.2-4)C ~~ B
This linear transform must be invertible so the C and C2 must be in-dependent of L and have zero luminance. In figure 2-4 the transformed
-
29
-Y
R
L
r
Cl
(WHITE)
C
C2
LINEARLY TRANSFORMED L,C ,C
2COLOR SPACE
FIGURE
2-4.
luminosity of any point in the space is the distance from the point to the plane formed by the C1 and C2 axes along a line parallel to the L axis. Thus the exact location of the C -C2 plane is specified by the L , L , L distances it must be located from the R , G , and B
r g b max max max
vertices of the parallelpiped. The NTSC color television system uses this type of chrominance transformation.
The mapping from R, G, B space to L, C1, C2 space is inefficient
since the parallelpiped volume spanned by the maximum and minimum L, C1, C2 values is larger than the transformed R, G, B parallelpiped volume of
real colors. Thus quantization of the L, C1, C2 axes yields a volume of color code word boxes where a large number of boxes do not represent a valid color. This is a direct consequence of constraining the space by the R,G,B cube and using luminance as one of the coordinates, thereby
placing boundaries on the gamut of realizable chrominance values which vary as a function of luminance.
2.3 Uniform Sensation Color Space
Ignoring statistical weighting, the L, C1, C2 -coding space will be
most efficiently quantized if equal quantum steps along the coordinates produce nearly equal visual sensations. In the case of luminance
quantization, much experimentation(16, 17) has revealed that a modified logarithmic function, L, produces the most uniform quantization since it evenly distributes perceived picture noise and contour artifacts over the entire tone scale.
Log (l + aL)
L
=Log (1 +- 31
-where the companding shape factor a has an optimum value found
experimentally to lie between .01 and .1 depending on the desired shadow detail in the picture.
As a first step in obtaining a uniform chrominance scale (UCS) sensation plane, researchers determined the just noticeable differences
(JND) of chrominance changes for various colors and plotted the loci of
these JND points around the particular color point in a bilinear chromaticity plane. (18)
A general bilinearly transformed chromaticity plane can be set up by first linearly transforming the CIE coordinates.
Cl R
C2 = [T] G (2.3-2)
C3 B
The conical projection of points in the Cl, C2, C3 space onto the Cl + C2 + C3 = 1 plane in that space results in three chromaticity coordinates, cl, c2, c3. cl =
Cl
c2C2
Cl + C2 + C3 Cl + C2 + C3 (2.3-3)C3
c3 = C3 cl + c2 + c3 = 1 C1 + C2 + C3The chromaticity coordinates cl, c2, c3 are relative values and are therefore independent of the absolute value of the color coordinates Cl, C2, C3. Since chrominance has only two degrees of freedom, choosing
cl and c2 as the independent variables projects points on the Cl + C2 + C3 = 1 plane onto the cl, c2 plane.
The CIE-UCS coordinates u and v may be defined in terms of the R,G,B CIE coordinates:
u R+ uG
+ uB
v R+ vG
+vbB
U r g b r b (2.3 -4) s R + s G + s B s R + s G + s Br
g
b
r
g
b
Appendix II shows how 2.3-4 and 2.3-5 may be inverted to yield:
R = L(r u + r v + a)/D(u,v) where a,b,c,r ,r ,g ,g ,b ,b ,d ,d ,d G = L(g u + g v + b)/D(u,v) are constants.
u V
(2.3-5)
B = L(b u + b v + c)/D(u,v) D(u,v) = d u +d v + d
u v u v
For most chrominance coordinates (cl, c2) the JND loci are ellipses which greatly vary in size, degree of elongation, and angle of rotation.
True UCS transformation would map these JND ellipses into equidiameter circles. The 1960 CIE-UCS transform'is a particular bilinear transform of the tristimulus coordinates which creates a chrominance plane that is a reasonably close approximation to the ideal UCS chrominance plane.
The widely accepted 1960 CIE-UCS chromaticity plane is illustrated in figure 2-5, with spectrum locus and white point, as well as the triangle whose vertices are the CIE RGB primaries. A color space con-sisting of the luminance and UCS chromaticity coordinates is sketched in figure 2-6. Compared to the linearly transformed parallelpiped
L, Cl, C2 space, there are much fewer wasted code words at low luminance levels. However, uniform quantization of the Cl and C2 coordinates results in very inefficient use of available chrominance code words at moderate luminance levels.
-
33
-1960 CIE-UCS DIAGRAM
.. . . . .. .... .. . . . .
653 ?UAR
.
P..
/
. . .. . . .. . .
ILI; ... . . 8.3 8.4U
1960
CIE
UCS
CHROMATICITY
.xA
V
3.2 3.. 0. 6.2 . . . . ..... .... ...FIGURE
2-5.0
DIAGRAM
L
MAXIMUM WHITE
LSC TRANSFORMED CHROMATI.CITY PLANES AT CONSTANT LUMINANCE
R
U, Y QUANTIZED TO
.4 BITS
U
FIGURE 2-6. A SKETCH OF THE GAMUT OF REPRODUCIBLE COLORS
FOR THE CIE UCS CHROMATICITY COORDINATES AS A
- 35
-2.4 The Luminance Scaled Chromaticity (LSC) Transform
In all common color reproduction systems, the gamut of chromaticities is constrained to lie inside a region in the UCS plane. In a typical picture the R, G, B primaries are statistically dependent. Most colors
in a typical portrait or natural scene are achromatic or desaturated. Since the primaries must be nearly equal for desaturated colors, it follows that they are highly correlated with each other. This can be intuitively seen by observing the similarity of the red, green, and blue separations of a color picture (figure 2-7).
Transformation of the primary coordinates to a luminance and two independent UCS chrominance components results in a significant reduction of the inter-component correlations (figure 2-8).
When luminance is used as one of the three components, it has been shown that it restricts the values of the chrominance components, u and v (figure 2-6). For very low luminance levels, the R, G, B primaries may take on any ratio of values and u and v may assume any value within the chrominance plane primary triangle. When the luminance is increased above Lb the value of the blue primary luminosity coefficient, u and v are then restricted from taking on values in the saturated blue region of the chrominance plane. As the luminance is further increased, the area of permissible u and v values decreases until the maximum luminance is reached where the only possible chromaticity value is the achromatic point.
A series of constant luminance loci is plotted in figure 2-9. The loci contain the gamut of reproducible colors with the constraints of equations 2.1-3, 2.2-1, 2.2-2, and 2.3-4. Starting at the maximally saturated red value for a particular fixed luminance, the blue component
RED
BLUE
GREEN
R,
G, B SEPARATIONS OF GROUP PICTURE.
-
3'
-L
FIGURE 2-8.
Cl
C2
1. C2 COMPONENTS OF GROUP PICTURE
L,
C
L.
C
1960 CIE-UCS DIAGRAM
seu
. . . .. . .. . . .L=.2
-. - -. - . . . ..
'.4 P.5 9.6U
FIGURE 2-9.
LOCI OF CONSTANT LUMINANCE ON UCS
CHROMATICITY
DIAGRAM
9.4 0.3V
9.2.1 -
-.
.
- - -
..-
-0.. 6.1- 39
-is increased and the red decreased until the most saturated blue-magenta is reached. Then the green is increased and the red further decreased, moving the loci to maximally saturated blue-cyan. By increasing the
green and decreasing the blue, the maximally saturated green point is reached. Finally, the green is decreased as the red increases back to
its maximum possible value. These constant luminance planes are sketched as volume in color space in figure 2-6.
L/L
L L
H = H H for H = R, G, B (2.4-1)
max
1L
1 L LH
H
Another way of viewing the restriction of u and v values as a function of luminance is to realize that in a three primary color space
(such as a subtractive photographic dye process, additive phosphor television system, or even the eye), the luminance component contains much chromaticity information and has been shown to be correlated with
chrominance. (19) Luminance is not highly correlated to low luminosity components such as blue, but is very highly negatively correlated with the relative blue component.
If the u and v coordinates are quantized, then even at very low luminance levels, chromaticity quantization is not too efficient since the right triangle base of figure 2-9 results in an area where only half of the possible number of codewords is utilized. The real colors lie in a horseshoe-shaped spectrum locus contained inside the triangular base and the gamut of reproducible colors lies inside the horseshoe. Thus even at the lowest luminance levels, simple quantization of u and v is less than 50 percent efficient. As the luminance increases the number
of valid chrominance code words is drastically reduced. Similar effects have been noted in the Munsell color system as value is increased. (20)
To facilitate the development of the color coding algorithms, it is useful to monitor the effects of quantization and filtering on the red, green, and blue separations. The test pattern separations of figure 2-11 generate the full gamut of colors in the system by reproducing over
100,000 different triads of red, green, and blue values in the 256 pel by
256 line test pictures. The quantization contour artifacts resulting
from coarse quantization of each chrominance component to four bits are shown in figure 2-12. These artifacts are most severe at high
luminance levels. If u and v are each uniformly quantized to 16 levels, then at luminance levels above L r, only 50 color boxes would be available to represent realizable colors.
In a typical natural scene, most of the chrominance values are clustered near the white point with a few more saturated colors lying along certain dominant hue lines which are different for each particular picture. The frequency of occurrence of Cl and C2 values which have been
coarsely quantized to four bits (16 levels) each are listed in Table 2-1 for the group picture of figure 6-lA. Even for this rather colorful picture the Cl and C2 values are significant only near the white point.
Thus the desaturated colors, many of which often occur at high luminance levels as pastels, constitute the majority of colors in many pictures. Accurate reproduction of pale skin tones is crucial for achieving acceptable subjective color picture quality. As previously discussed, however, the number of available chrominance boxes is
very small for these important pastel colors, resulting in objectionable quantization contours due to roundoff errors.
FREQUENCY OF OCCURRENCE OF Cl-C2 VALUES FOR THE GROUP Cl 15 - 0 0 0 0 29 58 9 0 0 0 0 0 0 0 0 0 14 - 0 0 0 39 201 483 117 458 279 60 5 25 2 0 0 0 13 - 0 0 0 18 442 1106 12 - 0 0 0 826 1169 318 286 135 442 421 23 49 10 0 0 0 40 6 9 2 0 0 0 0 0 0 11 - 0 0 0 211 83 11 0 0 0 0 0 0 0 0 0 0 10 - 0 0 0 69 63 0 0 0 0 0 0 0 0 0 0 0 9 - 0 0 0 402 95 0 0 0 0 0 0 0 0 0 0 0 8 - 0 127 0 0 0 0 0 0 0 0 0 0 0 0 0 0 7 - 0 63 0 0 0 0 0 0 0 0 0 0 0 0 0 0 6 -0 0 0 0 0 0 0 0 0 0 0 0 0 0 0 0 5 -0 0 0 0 0 0 0 0 0 0 0 0 0 0 0 0 4 -1 0 0 0 0 0 0 0 0 0 0 0 0 0 0 0 3 -0 0 0 0 0 0 0 0 0 0 0 0 0 0 0 0 2 -0 0 0 0 0 0 0 0 0 0 0 0 0 0 0 0 1 -0 0 0 0 0 0 0 0 0 0 0 0 0 0 0 0 0 -0 0 0 0 0 0 0 0 0 0 0 0 0 0 0 0 0 1 2 3 4 5 6 7 8 9 10 11 12 13 14 15 C2 TABLE 2-l. PICTURE
L
LSC Cl
LSC C2
-
43
a-RED
BLUE
GREEN
FIGURE 2-11.
R, G, B SEPARATIONS OF TEST PICTURE
...
-
44
-P -P -P
RED
BLUE
GREEN
-45-To effectively quantize and code color pictures it is necessary to consider the psychophysical data of UCS space and the restrictions of the reproducible color gamut. The luminance scaled chrominance (LSC) space proposed and derived in this paper seeks to successfully combine the advantages of the UCS space with the luminance restrictions by scaling
the UCS coordinates as a function of luminance so that the number of legitimate chrominance boxes at all luminance levels (even high luminance pastels) is nearly as large as for the lower luminance levels.
From figure 2-6 it is seen that the LSC transform cannot be continuous since the shape of the chrominance cross section planes varies at a rate which abruptly changes at the points where the luminance equals the primary luminosity coefficients Lr , L , L, and their combined sums L + L , L + Lb, L + Lb. The LSC transform is derived from the UCS
r
g
g
b rtransform by level shifting and scaling the UCS chrominance components as a function of the maximum and minimum values of u or v which are a
function of luminance.
u - u v - (L)
C (L) = N min C(2)(L) = N
[
in (2.4-2)l
L) -u
u
.
L)
v
(L)
v
V
CL)
max min max min
where N is the number of chrominance levels.
To preserve the UCS space, C 1 (L) and C2 (L) should be equally scaled. However, optimum utilization of available codewords necessitates unequal scaling. The resulting departure from a true UCS space at high luminance
levels yields a much finer quantization of the chrominance plane.
The LSC transform (equation 2.4-2) can now be calculated by deter-mining the magnitude range of L by boundary tests. The proper umin (L)
max
1
2
be derived. The minimum and maximum u and v are shown (in Appendix III) to be of the form:
min u
or or = [a + bL]/[c + L] (2.4-3) max v
so only six constants (at most) need be stored for each range of L values. The inverse LSC transform is of the same form and uses the same coef-ficients.
The LSC transform can be simplified by fixing the transform scaling and shifting parameters to their values at L for luminance levels
g
greater than L . With this limitation, the pastel colors will still
have much greater chrominance resolution than with just the UCS transform, and limiting the scaling avoids the problem of scaling up a vanishingly small area of valid chrominance values by very large factors at large luminance values. Figure 2-6 illustrates the substantial increase in reproducible chrominance codeword boxes in the LSC transformed coordinates at high luminance levels.
Comparing the processed separation test pattern of figure 2-12 with that of figure 2-13 dramatically illustrates the effectiveness of the LSC transform. In figure 2-10 it can be seen that the LSC transform
further reduces the spatial correlations between the luminance and the two chrominance components as compared with figure 2-9. When the two
chromaticity components are LSC transformed before four bit quantization, the Cl and C2 values are much more uniformly distributed as shown in Table 2-2. After LSC transformation, no one particular set of values of Cl and C2 corresponds to the white point.
RED
BLUE
GREEN
FIGURE 2-13.
R,
G, B SEPARATIONS OF PROCESSED TEST PICTURE
WITH LSC TRANSFORM
4V I j