Publisher’s version / Version de l'éditeur:
Vous avez des questions? Nous pouvons vous aider. Pour communiquer directement avec un auteur, consultez la première page de la revue dans laquelle son article a été publié afin de trouver ses coordonnées. Si vous n’arrivez pas à les repérer, communiquez avec nous à PublicationsArchive-ArchivesPublications@nrc-cnrc.gc.ca.
Questions? Contact the NRC Publications Archive team at
PublicationsArchive-ArchivesPublications@nrc-cnrc.gc.ca. If you wish to email the authors directly, please see the first page of the publication for their contact information.
https://publications-cnrc.canada.ca/fra/droits
L’accès à ce site Web et l’utilisation de son contenu sont assujettis aux conditions présentées dans le site LISEZ CES CONDITIONS ATTENTIVEMENT AVANT D’UTILISER CE SITE WEB.
Building Research Note, 1979-04
READ THESE TERMS AND CONDITIONS CAREFULLY BEFORE USING THIS WEBSITE. https://nrc-publications.canada.ca/eng/copyright
NRC Publications Archive Record / Notice des Archives des publications du CNRC :
https://nrc-publications.canada.ca/eng/view/object/?id=915d0aa2-febb-47c6-a917-1e0826f9360c https://publications-cnrc.canada.ca/fra/voir/objet/?id=915d0aa2-febb-47c6-a917-1e0826f9360c
NRC Publications Archive
Archives des publications du CNRC
This publication could be one of several versions: author’s original, accepted manuscript or the publisher’s version. / La version de cette publication peut être l’une des suivantes : la version prépublication de l’auteur, la version acceptée du manuscrit ou la version de l’éditeur.
For the publisher’s version, please access the DOI link below./ Pour consulter la version de l’éditeur, utilisez le lien DOI ci-dessous.
https://doi.org/10.4224/40000568
Access and use of this website and the material on it are subject to the Terms and Conditions set forth at
Static and dynamic properties of a reinforced concrete building model
? 2,
3
3
1
,
,
STATIC AND D Y N A M I C P R O P E R T I E S
OF
A REINFORCED C O N C R E T E BUILDING M O D E Lby
G . H a r t l e y ,
J.
H. Rainer andH.
S . WardThe structure investigated w a s one of four r e i d o r c e d c o n c r e t e
models, b u i l t by the Canada Emergency Measures Organization
(EMO)
during the summer of 1969, and w a s made available t o the Division of
Building R e s e a r c h for further studies. The model is a seven-storey,
flat slab structure, a y m e t s i c a l about both axes.
The concrete used in the m o d e l was 4 0 0 0 p s i micro-concrete, r e i d a r c e d with steel w i r e . Details of the construction of the model
a x e described in Reference 1. The over-alldimensions of the s t r u c - tur e ar s shown in Figure 1.
THEORETICAL CONSIDERATIONS
F o r the purpose of a lateral dynamic analysis, the model can b e re- garded a s a system of seven rigid masses (flaox slabs), jnterconnec ted by springs and d a m p e r s (columns), Each mass is c a p a b l e of displacing in the transvers e or longitudinal directions or of executing a rotational motion (Figure 1). W i t h the above simplification, the structure has 2 1
degrees of freedom.
The differential equations of motion far the s y s tern are, in
matrix form:
w h e r e [m] is the mass matrix for the structure, whose elements cor- respond t o the masses of the slabs f o r the translational d e g r e e s of f r e e -
dom, and polar moments of inertia f o r the t o r s i o n a l degrees of freedom;
[ c ] is t h e matrix of damping coefficients; [ k
1
is the matrix of s tiffnes scoefficients; F i s the c o l matrix ~ of generalized forces applied to each degree of f r e e d o m in the ~ y s t e m ; and x is the generalized d i s p l a c e -
ments corresponding to the degrees of freedom.
NOTE: This Note is based on an Internal Report of the Division of Building Research. A s the I n t e r n a l Report was issued in 1972, no
SI
u n i t sare contained in this N o t e . The following conversions a r e applicable: 1 in. = 25.4 mrn
1 psi = 6 . 9 k P a
For an undamped svstem undergoing free vibration, Eq. (1)
reduces to
F o r natural vibrations, the solution of Eq. ( 2 ) is of the f o r m
x 2 =
A2
sin (wt+
m
2 )w h e r e
A
,
A represent the amplitudes of vibration,1 2
W 2 are the natural frequencies (radlsec], and
cPl*lcP~ are phase angles,
Substitutimg Equations ( 3 ) into (2) gives
2
A =
a
c r n ~ ~ k ~ - l A.-
1w h e r e [ f ] =
[k]
iscalledtheflexibilitymatrix. T h e f l e x i b i l i t y f i , , j i sdefined as the displacement corresponding to the location and direction designated by 1, resulting f r o m a unit load corresponding to the location and direction designated by j.
In
the present study, the flexibility coefficients for the buildingmodel a r e determined by static testing. These are then u s e d to compute
the eigenvalues, w . , , and thecsrresponding eigenvectors,A f s o m E q , ( 4 )
11
using the Stodola method. 1'
EXPERIMENTAL PROCEDURE FOR STATIC TESTING
Preparation of the M o d e l
Eleven triaxial strain gauges w e r e a p p l i e d t o slab IV of the n ~ o d c l as shown in F i g u r e 2, and 16 uniaxial strain gauges w e r c a p p l i e d tu both
ends and an the longitudinal and transverse faces of c o l u m n s A3 and I33 above and below slab
IV,
Thin metal plates w e r e £as tened wkth epoxy to
a U
locations in which deflections w e r e t o be measured. A t a r g e t w a s marked on each plate at the centre of the slab thickness a d approximately at t h e c e n t r e -line of the adjacent c o l w n n line. Two "DexionIt frames were b u i l t f o r mounting the deflection gauges.
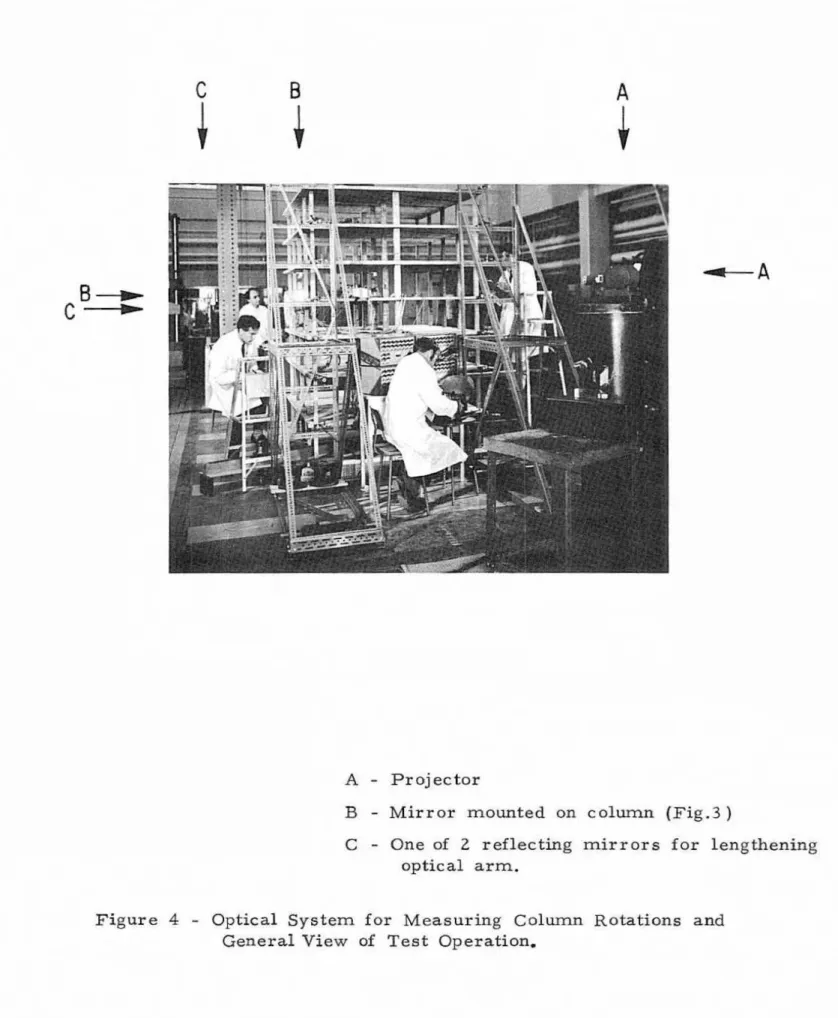
Five small mirrors ( F i g u r e 3 ) were mounted in l o c a t i o n s V, W,
X, Y
andZ
shown in F i g u r e 1. The mirrors w e r e used t o measure ther o t a t i o n s at these points. A 35 =mm slide was pr epased with h o r i z o n t a l and vertical g r i d lines. The h a g e was projected onto the rotation
mirrors and r e f l e c t e d from t w o larger mirrors, located at opposite ends of t h e laboratory, onto a screen, The length of the optical a r m was appsaxbnately 150 ft. B y measuring the displacement an the screen of a s h g l e g r i d line, the rotation at the column could be estimated. F i g u r e 4 shows the location of the s l i d e projector and one of the l a r g e m i r r o r s ,
For each test it was necessary t o reposition the model. The base
slab was clamped f i r m l y t s t h e f l o o r of the l a b o r a t o r y in each case. F o r
the translational tests, l o a d s w e r e applied to the centre of each slab by
means of hydraulic jacks reacting against loading frame columns which w e r e bolted to the floor of the l a b o r a t o r y ( F i g u r e 3 ) . The positions of t h e jacks and "Dexion" frames f o r the rotational static t e s t a r e i l l u s t r a t e d
in Figure 5.
T e s t No, 1
-
Transverse LoadingThe hydraulic jack was applied at the c e n t r e of each s l a b and the two "Dexion" f r a m e s each containing seven dial gauges w e r e p o s i t i o n e d at the extremeties uf t h e model as shown in F i g u r e 4. A load was ap- plied to eachfloor slab in turn in the transverse direceon, and f o r each
load application the deflections w e r e recorded at the 14 dial gauge l o -
cations, The rotations af c o l ~ s and strains w e r e measured only when
slabs
a
IV
and Vll. w e r e loaded. The m i r r o r s w e r e moumted s o t h a t the rotations jn a vertical plane parallel to the transverse direction c o u l d b e d e t e c t e d , SlabsI,
Uaa
/V, and VII w e r e loaded on the f i r s t d a y of t e s t i n g ;slabs
VI
and V on the following day. The sequence of operations is l i s t c d i n detail in TableI.
T e s t No. 2
-
Longitudinal LoadimgThe positions of the m o d e l and the testing e q u i ~ r n c n t arc similar t o those in Test
No.
I . Loads w e r e applied in the longitudinal d i r e c t i o n and corresponding deflections w e r e recorded again at 14 dial gauge le- cations. Only column rotations atV,
W, andZ
w e r e considered. T h ethree rotation mirrors were mounted s o that t h e rotations about a hari- zontal axis parallel to t h e longitudinal direction w e r e measured. The t e s t was performed ina single day. The procedure is summarized in Table 2.
T e s t
No.
3-
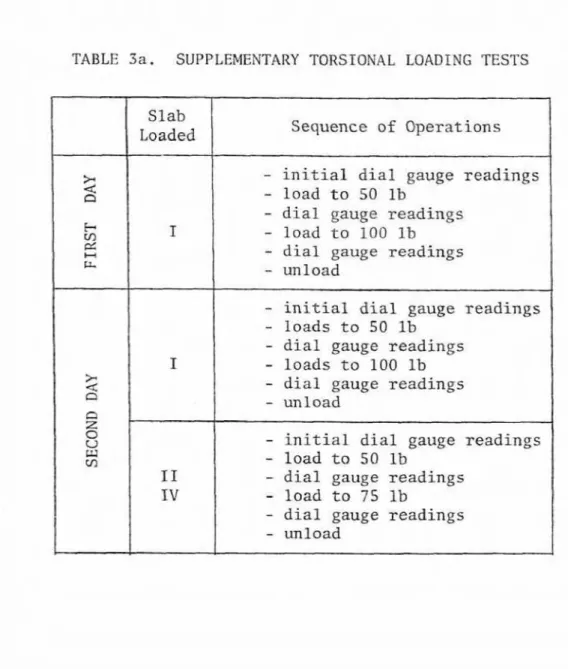
Torsional loadingThe positions of t h e model and t e s t i n g equipment are shown in
Figure 5. Equal and opposite forces to form a couple with a moment
arm af 60 in., w e r e applied in the transverse direction to each f l o o r slab in turn. The distance between the two r o w s of dial gauges w a s 8 3 . 9 in.
The
mirrors were mounted s o that rotations about vertical a x e s were measured at locations X and Y. The experiment was per-
formed in one day; supplernentaxy testing was perfaxmed two days
later. Tables 3 and 3a summarize the testing procedure, RESULTS
Laad-Deflection Properties
Tables 4a, b and c s h o w the mean slab displacements per u n i t
of applied force.
In
the transverse and longitudinal directions (Tables4a and b), these values are computed by averaging the t w o deflections on a slab and dividing the average by the magnitude of the load. Only t h e results far the highest load level are given. F o r the torsion c a s e (Table 4121, the slab rotation has been computed by adding the deflec- tions for the two dial gauges on a slab, and dividing that sum by the
distance between the dial gauge lines, shown in F i g u r e 5, The quantities
shown in Table 4 c are the rotations divided by the couple that produced
the rotation, Only the torsional results f r o m the largest applied forces
(75 lb) are presented in this paper, Column Rotations
The:
coluslln rotations about a horizontal axis p a r a l l e l to thetransverse direction at locations
V,
W, X , Y , and Z, shownin
F i g u r e I, a r e presented in Table 4d, whereas the colurnn r o t a t i o n s about a hori- zontal axis parallel to the longitudinal direction are given in Table 4e. Table 4f shows the rotations about a vertical axis of columns at lo-cations
X
andY
of F i g u r e 4 when the model is subjected to torsional loads. Strain G a u g e R e a d i n g sThe strains observed on s l a b
IV
and adjoining columns were d i f - ficult t o interpret because of their low level. A s it was not desirable to increase the lateral loads any further for fear of damaging the model prematurely, no useful information has yet been gained.It
is expec tea, however, that under higher load levels the recorded strains will providesome insight i n t o the model's structural behavioux at a later date. Some aspects of strain gauge observations a r e discussed, however, in the next
DlSCUSSION
OF
RESULTSA s y m m e t r y in Deflection Readings
For the i d e a l linear s t r u c t u r e , the flexibility matrix is s y m - metrical because of Maxwell's reciprocal relationship. The three flexibility matrices d e t e r m i n e d f o r the model a r e obviously not per - f e c t l y eyrnmetrical (Tables 4a, b, and c). The lack of symmetry in t h e s e results is examined in Tables 5a,b,and c. Each e n t r y is com-
puted by subtracting an element in the f l e x i b i l i t y matrix above the main diagonal from its diagonally apposite counterpart below and dividing the
result by the mean of the two values, The result occupies the same lo- cation as the coefficient below the main diagonal in the flexibility matrix.
There are several possible sources of experimental error which
may contribute to the asymmetry of the matrices of deflection readings.
The smallest deflections measured w e r e of the order of 1 J l O O O in. T h i s is the smallest division on the dial gauge and i t is Believed that
sticky dial gauge fieedlqs could account for close to 1
/
1000 of an inch error, B y far the l a r g e s t deviations from symmetry occur in the f i r s t r o w and column of each flexibility matrix a n d these correspond to t h e smallest dial gauge readings. A s the model is loaded, the dial gauge pin has a tendency to s h i f t off the target point of the bearing plate, thes u r f a c e roughness of which c o u l d account for s o m e portion of the error. Furthermore, the Loads could be measured only to within a f e w pounds.
The
load levels werenot largeenough to reduce this source of error tonegligible limits.
The most s i g n s i c a t source of deviation from s y m m e t r y , however,
can b e explained as f trllows. In each of the three static t e s t s , Loads w e r e
applied to t h e model in sequence, beginning with the bottom f l o o r slab. Because the m o d e l had not previously been tested, this procedure had a
tendency ta produce a systematic progression of cracking. (It should
b e noted that this cracking is at a small and acceptable level and is produced by loads that are w e l l below those t h a t the structure was d c - signed to carry. ) W h e n slab
1
was loaded, new cracks formed in the columns between slabI:
and the base slab. Deflections at slabsII
t h r o u g hV n
have j u s t been measured for a m o d e l in which cracks appear only in the bottom colurrms.As
each successive slab is loaded the d e f l e c t i o n s measured below the loaded slab correspond to the cracked state; t h o s eabove t o the luncracked state, The symrnetr y of the flexibility matrix,
however, arises from an assumption of linearity of the structure, The
Although there a r e same exceptions, there is a tendency for t h e
flexibility below the diagonal coefficients in Tables 4% b and c to b e larger than their supposedly symmetric a1 equivalents above t h e diagonal
that
w e r e measuredin
an earlier s t a g e of the t e s t , Thus f o r the ffexi- bility matrix of the uncracked model, the upper diagonal matrix should be u a e h and for the cracked mode4 the lower diagonal matrix would b e appropriate, This pre-supposes a svccessive loading pattern f r o m the bottom to the top.C
olurnn
RotationsThe
moat striking feature of the columnr crtation
readings (Table 4d) is that when the madel was unloaded, the mirror readings did n o t r e t u r n even closely t o their o r i g i n a l position. The results of the slab deflection measurements, however, showthat
fie structure did r e k r nalmost completely t o its original codigmration after unloading, There-
fore, yielding in the structure could not have produced these residual
column rotations. Either jarring movements in the structure or the
column rotations themselves may
have
caused slight shifting at the mir-ror clamping points. M o s t likely, however, local column cracking prohibited the rotations from returning t o their unloaded position, U n -
loaded conditions were not recorded for mirror readings in Tables 4 e and f,
A comparison of the mirror rotations W and Z for loading in the
transverse direction, given in Table 4d, shows that W is consistently
larger than 2.
As
W and Z are fie rotations of the columns at the upperand lower sides of slab
IV,
t h i s difference h d i c a t e s that substantialrelative deformations must have occurred, Two possible explanations fox
this are cracking near the colurnn-slab interface or elastic deformations within the column- slab joint. Because, upon unloading, the mirror
readings did not return to zero the occurrence of cracking is likely to
be the predominant reason for the difference in the W and Z readings
in Table 4 d ,
The angle readings of mirrors
W
and Z in the longitudinal direction(Table 4e) indicate identical readings for slab IIl loaded and for the 100-lb
l o a d o n s l a b W , T h e 2 0 0 - 1 b l o a d o n s l a b I V s h o w s ~ a t Z i s l a r g e r ~ a n W, which is opposite to t h e general trend of other readings and should t h u s b e viewed with some suspicion, W i t h slab
V U
loaded, Z is consis-tently larger than W, t h u s follovging the s a m e trend as
in
the transverse direction.The mirror readings under torsional loads,
X
andY
in Table 4f, give the rotation at the top and bottom, respectively,of
the center columnB3
between slabsI T
andV
(see Figure 1). F o r SlabIII andIV
loaded, thetop of the colurrln is seen
t o
rotate consistently through a larger angle than the bottom, although the diffexencea are v e x y small. This follows t h e same trend as the slab rotations under torsional leadingin
Table 4c,which shows a elight increase in the rotations of the slabs that are
located immediately above the loaded slab. F o r lab
V U
loaded, Table 4f indicates that the top of the colurnn, locationY,
shows substantiallyg r e a t e r rotations than the bottorrq location
X,
This is again in agreement with the trend exhibited by the corresponding slab rotations r e c o r d e d in Table 4c.A quantitative comparison between slab rotations in Table 4 c
and column rotation
in
Table 4f for slabVU:
loaded gives the following:_/from Table 4c)
Rotation Slab
V
= 6.1178 x 10⁻⁸
Difference = 1.2178 x 1 0
-8
rad/in. lb-2
= 0 . 3 1 4 x 1 0 degrees f o r 7 5 - l b tarsional loads.
(from Table 4f)
Y
=
1 . 9 7 3 x 10 -2 -2Difference = 0 . 3 0 7 x 10 degrees for 75-lb torsional loads.
T h e s e figures a r e seen t o be in good agreement. F o x the 50-lb torsional
load t h e corresponding f i g u r e s ar.. 0 . 2 2 x 1 degrees from the slab
rotations versus 0.123 x degrees from Table 4f f o r the 50-lb loads. The quantitative agreement between these l a t t e r figures is not as s a t i s -
factory.
The results f r o m the optical measurements of column rotations
have demonstrated that i t is possible to obtain useful information about
localized behaviour of constituent elements af a structural model.
In
the present work the results have been l a r g e l y qualitative and preliminary.However, with s o m e improvements in experimental techniques, optical measurements should enable one to obtain reliable quantitative data on the progression of member deformations, including local cracking or
yielding.
Strain G a u g e Readings
All s t r a i n gauges on the model w e r e checked t h o r o u g h l y b e f o r e the static testing to ensure that they were properly applied. None w a s
faulty. It appears, however, that the error in the measuring equipment was
g r e a t e r than the actual strains, which were very low. L o w levels of l o a d - ing w e r e maintained in order to prevent any serious localized cracking of the model. T h e s e comments apply especially t o the s l a b s in which values of only a few micro inches per inch were obtained,
An error of 3r 5 pin. Jin. could be expected from t h e strain indi- cator. All the at-rain gauges were balanced to the same z e r o point through
switching units.
It
was found before testing, that some of the contacts in the potentiometers of the switching units w e r e not clean, This c a u s e d adrift in t h e strain indicator needle. Some of the channels,
in
which thiswas quite noticeable, were not u s e d in the testing.
k
t
others this effect w a s imperceptible, and would only have been noticed after an hour o r soof testing. This is perhaps one r e a s o n why strain readings were n o t close
to zero when the model was unloaded. However, both the strain gauge
and mirror results might better b e taken as evidence of small local crack-
ing
in
the concrete.DYNAMIC
TESTING O FEM0
MODELThe fundamental frequencies of t h e E M 0 b u i l d i n g m o d e l in the three directions of vibration (longitudinal, transverse, and torsional) w e r e obtained b y two methods:
1. The f l e x i b i l i t y coefficients w e r e m e a s u r e d by static t e s t i n g
as described previousky. These coefficients were then u s e d as data
f o r the computation of natural f r e q u e n c i e s and mode shapes, using thc
program of Reference 2 . Each of t h e t h r e e directions were considcrcrl
to be uncoupled and the natural frequencies and correspunding mode
shapes computed separately.
2. Simple impact t e s t s were perf orrned and frequencies obtained
from the recorded vibration traces.
The computer program from Reference 2 computes the n a t u r a l frequencies and the corresponding mode shapes for three modes of vi- bration using the Stodola-Vianello method.
The
data required by theprogram are: the masses of the slabs; t h e p o l a r moments of inertia; and Ule f l e x i b i l i t y coefficients obtained in the static t e s t s . Symmetrical rnartric e s w e r e used, utilizing only the coefficients below t h e main
diagonal in Tables 4a, b, and c. The results of the analysis are given
in Table 5 .
P r oc edur e f o r Dynamic Testing
Two MB velocity transducers w e r e placed on Slab VII, with
both transducers aligned to record vibrations i n the transverse d i r e c t i o n only, The signals from t h e transducers were recorded on a C e n t u r y G P O 4 6 0 Recorder. T h e modal was excited in t h e transverse direction by striking the middle of the t o p slab horizontally with a hard rubber h a m e r .
The transducers were rotated by 9 0 deg. to measure vibrations
in the longitudinal direction that were induced by striking the middle of the top slab.
T o vibrate the m o d e l in the torsional direction, a 1 0 - f t board w a s
placed across the top slab and clamped
with
C-clamps as shown in F i g u r e 6. By hitting the extending arm of the board, t o r s i o n a l as well as longitudinal oscillations w e r e excited. The transducers w e r e placed as s h o w n in F i g u r e6
and w e r e aligned with the transverse direction, so t h e y would not respondto longitudinal vibrations.
In one
t e s t , an operational amplifier was u s e d to subtract the s i g n a l s from the transducers so that the transverse m o t i o n of the m o d e l was essentially cancelled and the torsional motion doubled.It was
found that there w a s n a d i f f e r e n c e in the records, and that t o r s i o n a l vibrations could be measured without the use of t h e operational amplifier.The vibration r e c o r d s obtained in the dynamic testing a r e given in
Figures 7, 8 and 9 f o r the transverse, longitudinal, and t o r s i o n a l motions, respectively.
The
fundamental frequencies d e r i v e d f r o m t h e s e r e c o r d s are given in Table 5.Comparison of Computed and Measured Frequencies
The comparison between t h e measured and computed frequencies of the fundamental modes in each of the t h r e e principal directions i s pro- vided
in
Table 5. It may be observed that the t w o s e t s of figures a r e in c l o s e agreement. T h e most important component of the computational data, the flexibility matrix, w a s determined e x p e r k e n t a l l y by the static t e s t s ; thus the g r e a t e s t potential unc ertaknty has effectively been elirni- nated f r o m the c omputations,The close agreement between computed and measured frequencies, however, confirms the validity of using vibrational data f o r assessing
Damping in the Model
The
degxee of damping in the model was estimated by comparing successive peak amplitudes of the vibration records. Considering twomaxima, x and x
1 n + l separated by n c y c l e s of oscillation, t h e logarithmic decrement,
'
A,may be computed as:The fraction of critical damping,
5
,
can be found from the relation:These r e s u l t s are presented in Table 5 .
CONCLUSIONS
The model t e s t s have demonstrated close agreement between ob-
served dynamic behaviour and dynamic properties computed f r o m measured
flexibility matr ic es,
The
static flexibility matrices were not found to be completelysymmetrical. This w a s ascribed m a i n l y to progressive cracking of the
m o d e l as the various f l o o r s were loaded.
The optical rotation measurements demonstrated that it is p o s s i b l e
to obtain qualitative as well as quantitative information on localized c om- ponent rotations atvarious load levels by this technique. F o r greater
reliability, however, improvements in the experimental techniques are
necessary.
A s the asymmetry of both flexibility matrices and r o t a t i o n readings has indicated, the loading sequence for a concrete model t e s t may r e q u i r e careful consideration, The results obtained may depend on t h e particular loading sequence adopted.
Results from the strain gauges produced limited information d u e
to the small load levels applied.
ACKNOWLEDGEMENT
The model tested was one of four models b u i l t by the Canada
ErnergencyMeasures Organization ( E . M . O . ) in 1969. It was made available b y E.M.O. to the Division of Building R e s e a r c h for further testing. The work wag carried out by G. Hartley while employed as a summer student at the Division of Building Research under the supervision of 3. H. Rainer
.
Ref. 1-
Model c o n s t r u c t i o nREFERENCES
1 . Zelrnan, M. I. , e t al. Practical Problems and C o s t s of Fabricating Multi-Storey Models, Models far Concrete Structures, Publication S P - 2 4 , A m e r i c a n C o n c r e t e I n s t i t u t e , D e t r o i t , Michigan,
197Q,
p. 159-185.
2. W a r d , 33. S . Calculation of the M o d e s and Frequencies of V i b r a t i o n f o r Multi-Degree-of -Freedam Systems. National Research Council
of Canada, Division of B u i l d i n g Research, DBR Computer P r o g r a m
TABLE
1. TEST SEQUENCE FOR TRANSVERSE DIRECTIONTABLE
2 -TEST
SEQUENCE FOR LONGITUDINAL DIRECTIONSlab Loaded I I I 111 IV
VL
I VVI
Sequence of Operations-
initial d i a l gauge r e a d i n g s - load increased to 100 lb-
d i a l gauge readings-
load i n c r e a s e d to 200 l b I I I I I I I Vv
V I VI I I , - i n i t i a l d i a l gauge r e a d i n g s - Isad to 100 lb-
d i a l gauge readings-
load to 200 Pb - d i a l gauge readings - unload-
-- i n i t i a l d i a l gauge r e a d i n g s - load to 100 1 b-
d i a l gauge readings, column r o t a t i o n s , strain gauges - load to 200 1b- dial gauge readings, c o l u m rotations, s t r a i n gauges - unload
-
{
as f o r I and IT above - initial d i a l gauge readings - load to 100 Ib- dial gauge r e a d i n g s , column r o t a t i o n s , strain gauges
- laad to 150 l b
-
dial gauge r e a d i n g s , column rotations, strain gauges- u n l o a d - unload
-
i n i t i a l d i a l gauge readings- load increased to 100
Xb
- d i a l gauge r e a d i n g s , column r o t a t i o n s , strain - l o a d increased to 200 l b
- dial gauge readings, column rotations, s t r a i n
-
unload-
i n i t i a l d i a l gauge readings-
load increased to 100 I b - d i a l gauge readings-
load increased to 200 1b - d i a l gauge readings I-
unloadTABLE 3 . TEST SEQUENCE FOR
TORSIONAL
LOADING Sl abLoaded Sequence of Operations
- i n i t i a l d i a l gauge readings - load (on both jacks) to 50 I b - dial gauge readings
I
-
load t o 7 5 l b - d i a l gauge readings - load to 100 1b - i n i t i a l d i a l gauge readings - load to 50lb
-
dial gauge r e a d i n g s - load t o 75 l b- dial gauge readings
-
initial d i a l gauge r e a d i n g s > - l o a d t o 50 I bd 111 - dial gauge r e a d i n g s , column rotations, strain gauges
o IV - load t o 75 I b
- dial gauge readings, column rotations, s t r a i n gauges
- unload
+
V) * c i , u LL V-
initial d i a l gauge r e a d i n g s - l o a d t o 31 l b - d i a l gauge r e a d i n g s - l o a d t o 50 I b - d i a l gauge readings - unload VI VI I - i n i t i a l d i a l gauge readings-
load t o 50 lb-
dial gauge readings - load t o 75 l b- dial gauge r e a d i n g s
-
unload- initial dial gauge r e a d i n g s - l o a d t o 50 1 b
-
d i a l gauge r e a d i n g s , column r o t a t i o n s , strain gauges- load t o 75 1 b
-
d i a l gauge r e a d i n g s , column rotations, strain gauges - unloadTABLE 3a. SUPPLEMENTARY TORSIONAL LOADING TESTS
- i n i t i a l dial gauge r e a d i n g s
-
load t o 50 l b- d i a l gauge readings
-
load t o 100 Xb-
initial dial gauge readings - l o a d s to 50 Ib - d i a l gauge readings-
l o a d s to 100 l b Z 0 u Lrl vl 11 I V- initial dial gauge readings
-
load to 50 l b- d i a l gauge readings
-
load to 75 l b- dial gauge r e a d i n g s - unload
TABLE 4a
MEAN SLAB DEFLECTIONS PER UNIT WAD IN THE TRANSVERSE
DIRECTION
Deflection of Slab No. ( i n . x
S l a b Loaded
1 I I I L L
IV
v
1; I VITTABLE 4b
MEAN
SLABDEFLECTIONS
PER UNIT LOAD I N THE LONGITUDINAL DIRECTIOND e f l e c t i o n 05 Slab No. (in, x Slab
Loaded
TABLE
4cSLAB ROTATIONS PER UNIT TORQUE, OBTAINED FROM THE 7 5- LB
.
LOADING CASESlab R o t a t i o n o f Slab No. ( r a d x 10'~) Loaded
I I T TI1 I V V VI V I I
V I I 0.9267 2.5156 3 . 6 8 2 2 4.9000 6.1178 7.4689 8.5022
TABLE 4d
COLUMN ROTATIONS UNDER LOADING IN TRANSVERSE DIRECTION
S
X
ab Rotation a t Mirror (degrees xLoaded Load, l b .
v
1v XY
Z
I11 200 4 . 2 9 1 3.281 1.735 1 -487 1.893 un l o aded 4.039 3 . 0 2 9 1.487 1 . 2 4 0 1.514 1 0 0 0.884 1.010 1 . 3 6 4-
2.524 IV 200 2.019 2.524 2.107 2 . 2 2 3 3 . 9 1 3 unloaded 2 .a19 1.514 1.735 2.355 2 . 5 2 4 100 0-63 1 1.010 0.867 0.867 1.010 VL I 200 1 . 8 9 3 2 . 2 7 2 2.603 2.355 2 -524 unloaded 0.253 0 -504 0.372 0.372 0.631TABLE 4e
COLUMN ROTATION UNDER LOADING 1K
LONGITUDINAL DIRECTION
Slab R o t a t i o n at Mirror [degrees x 10'~)
Loaded Load, Ib.
v
I'm' X Y
z
TABLE
4ECOLUMN
ROTATION
UNDER LOADING IN TORSIONSlab R o t a t i o n a t Mirror [degrees x 1 0 - ~ )
Loaded Load, I b .
v
TABLE 5
CALCULATED AND MEASURED
FREQUENCIES
OF
VIBRATION
F~equencies from Frequencie
s
from >lea suredDamning Dynamic T e s t , Hz Computer Analysis, H z Ratio, % of
c r i t i c a l o f D i r e c t ion 1 st Mode 1st Mode 2nd Mode 3rd Mode 1 s t Mode
Transverse 5.77 5 . 7 4 17.14 3 2 . 3 0 1.3
Longitudinal 5 . 8 1 5 . 8 8 17.40 26.16 1 . 4
T o r s i o n 6 . 4 0 6 . 7 3 21.45 44 .69 2.3
TABLE 5a
TABLE 5b
DEFLECTION ASYMMETRICS I N THE LONGITTJDINAL DIRECTION
TABLE 5 c
Figure 3 - M i r r o r s for Measuring Column Rotation and Mounted Strain Gauge.
A
-
ProjectorB - M i r r o r mounted on c olumn ( F i g - 3 )
C
-
O n e of 2 reflecting mirrors f o r lengtheningoptical arm.
Figure 4
-
O p t i c a l System f o r Measuring C o l m Rotations and G e n e r a l View of Test Operation,2 x 4 PINE I M P A C T H A M M E R " M 0 " V E L O C I T Y T R A N S D U C E R S W I T H O R I E N T A T I O N I N D I C A T E D BY A R R O W FfGURE 6 D X N A M l C T E S T I N G - T O R S I O N A L D I R E C T I O N
FIGURE 7 V E L O C I T Y T R A C E IF1 T R A N S V E R S E D I R E C t I O N t C - u