HAL Id: hal-02337175
https://hal.archives-ouvertes.fr/hal-02337175
Submitted on 29 Oct 2019
HAL is a multi-disciplinary open access
archive for the deposit and dissemination of
sci-entific research documents, whether they are
pub-lished or not. The documents may come from
teaching and research institutions in France or
abroad, or from public or private research centers.
L’archive ouverte pluridisciplinaire HAL, est
destinée au dépôt et à la diffusion de documents
scientifiques de niveau recherche, publiés ou non,
émanant des établissements d’enseignement et de
recherche français ou étrangers, des laboratoires
publics ou privés.
Computational and robotic modeling reveal
parsimonious combinations of interactions between
individuals in schooling fish
Liu Lei, Ramon Escobedo, Clément Sire, Guy Theraulaz
To cite this version:
Liu Lei, Ramon Escobedo, Clément Sire, Guy Theraulaz. Computational and robotic modeling reveal
parsimonious combinations of interactions between individuals in schooling fish. PLoS Computational
Biology, Public Library of Science, 2020, 16 (3), pp.e1007194. �10.1371/journal.pcbi.1007194�.
�hal-02337175�
Computational and robotic modeling reveal
parsimonious combinations of interactions
between individuals in schooling fish
Liu Lei1,2, Ram´on Escobedo2, Cl´ement Sire3, Guy Theraulaz2,* 1 University of Shanghai for Science and Technology, Shanghai, China
2 Centre de Recherches sur la Cognition Animale, Centre de Biologie Int´egrative, Centre National de la Recherche Scientifique (CNRS), Universit´e de Toulouse – Paul Sabatier (UPS), Toulouse, France
3 Laboratoire de Physique Th´eorique, CNRS and Universit´e de Toulouse – Paul Sabatier, Toulouse, France
* guy.theraulaz@univ-tlse3.fr
Abstract
1
Coordinated motion and collective decision-making in fish schools result from complex
2
interactions by which individuals integrate information about the behavior of their
3
neighbors. However, little is known about how individuals integrate this information
4
to take decisions and control their movements. Here, we combine experiments with
5
computational and robotic approaches to investigate the impact of different strategies for
6
a fish to interact with its neighbors on collective swimming in groups of rummy-nose tetra
7
(Hemigrammus rhodostomus). By means of a data-based agent model describing the
inter-8
actions between pairs of H. rhodostomus (Calovi et al., 2018), we show that the simple
9
addition of the pairwise interactions with two neighbors quantitatively reproduces the
10
collective behavior observed in groups of five fish. Increasing the number of interacting
11
neighbors does not significantly improve the simulation results. Remarkably, we find
12
that groups remain cohesive and polarized even when each agent only interacts with
13
only one of its neighbors: the one that has the strongest contribution to the heading
14
variation of the focal agent. However, group cohesion is lost when each agent only
15
interacts with its nearest neighbor. We then investigate by means of a swarm robotic
16
platform the collective motion in groups of five robots. Our platform combines the
17
implementation of the fish behavioral model and an engineering-minded control system
18
to deal with real-world physical constraints. We find that swarms of robots are able
19
to reproduce the behavioral patterns observed in groups of five fish when each robot
20
only interacts with its neighbor having the strongest effect on its heading variation,
21
whereas increasing the number of interacting neighbors does not significantly improve
22
the group coordination. Overall, our results suggest that fish have to acquire only a
23
minimal amount of information about their environment to coordinate their movements
24
when swimming in groups.
25
Keywords: collective behavior; flocking; fish school; interaction networks;
computa-26
tional modeling; swarm robotics.
Author Summary
28
How do fish combine and integrate information from multiple neighbors when swimming
29
in a school? What is the minimum amount of information about their environment
30
needed to coordinate their motion? To answer these questions, we combine experiments
31
with computational and robotic modeling to test several hypotheses about how individual
32
fish could combine and integrate the information on the behavior of their neighbors
33
when swimming in groups. Our research shows that, for both simulated agents and
34
robots, using the information of two neighbors is sufficient to qualitatively reproduce the
35
collective motion patterns observed in groups of fish. Remarkably, our results also show
36
that it is possible to obtain group cohesion and coherent collective motion over long
37
periods of time even when individuals only interact with their most influential neighbor,
38
that is, the one that exerts the most important effect on their heading variation.
39
Introduction
40
One of the most remarkable characteristics of group-living animals is their ability to
41
display a wide range of complex collective behaviors and to collectively solve problems
42
through the coordination of actions performed by the group members [1–3]. It is now well
43
established that these collective behaviors are self-organized and mainly result from local
44
interactions between individuals [4, 5]. Thus, to understand the mechanisms that govern
45
collective animal behaviors, we need to decipher the interactions between individuals, to
46
identify the information exchanged during these interactions and, finally, to characterize
47
and quantify the effects of these interactions on the behavior of individuals [6, 7]. There
48
exists today a growing body of work that brought detailed information about the direct
49
and indirect interactions involved in the collective behaviors of many animal groups,
50
especially in social insects such as ants [8–11] and bees [12, 13].
51
Recently, we introduced a new method to disentangle and reconstruct the pairwise
52
interactions involved in the coordinated motion of animal groups such as fish schools,
53
flocks of birds, and human crowds [14, 15]. This method leads to explicit and concise
54
models which are straightforward to implement numerically. It still remains an open
55
and challenging problem to understand how individuals traveling in groups combine the
56
information coming from their neighbors to coordinate their own motion.
57
To answer this question, one first needs to identify which of its neighbors an individual
58
interacts with in a group, i.e., which are its influential neighbors. For instance, does an
59
individual always interact with its nearest neighbors, and how many? Most models of
60
collective motion in animal groups generally consider that each individual is influenced by
61
all the neighbors located within some spatial domain centered around this individual [16,
62
17]. This is the case in particular of the Aoki-Couzin model [18, 19] and the Vicsek
63
model [20]. In the latter, each individual aligns its direction of motion with the average
64
direction of all individuals that are located within a fixed distance in its neighborhood.
65
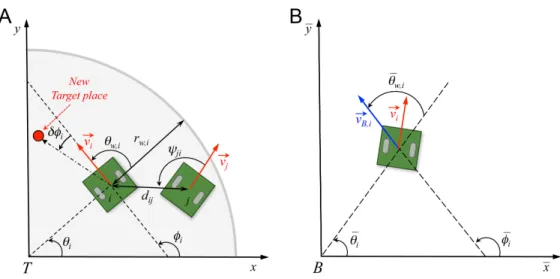
Other models, more directly connected to biological data, consider that the interactions
66
between individuals are topological and that the movement of each individual in the
67
group only relies on a finite number of neighbors. This is in particular the case for the
68
work on starling flocks [21, 22] and on barred flagtails (Kuhlia mugil) [23]. In golden
69
shiners (Notemigonus crysoleucas), another work has sought to reconstruct the visual
70
information available to each individual [24]. In this species, it has been shown that a
71
model was best explaining the experimental data when all the neighboring individuals
72
that occupy an angular area on the retina of a focal fish that is greater than a given
73
threshold are taken into account. However, because of the cognitive load that is required
74
for an individual to constantly monitor the movements of a large number of neighbors,
75
it has been suggested that animals may focus their attention on a small subset of their
neighbors [25–27]. In a previous work, we found experimental evidences that support this
77
assumption. In groups of rummy nose tetras (Hemigrammus rhodostomus) performing
78
collective U-turns, we found that, at any time, each fish pays attention to only a small
79
subset of its neighbors, typically one or two, whose identity regularly changes [28].
80
However, we still ignore if the same pattern of interaction holds true when fish are
81
schooling, i.e., when individuals are moving together in a highly polarized manner and
82
not performing some collective maneuver.
83
Then, one needs to determine how a fish integrates the information from its influential
84
neighbors. The most common assumption is that animals respond by averaging pairwise
85
responses to their neighbors (with added noise) [16–18]. However, existing work shows
86
that the integration of information might be much more complex. In golden shiners,
87
Katz et al. [29] have shown that the combined effect of two neighbors on a fish response
88
is close to averaging for turning, but somewhere between averaging and adding for speed
89
adjustments. This observation brings us back to an often neglected factor which is the
90
impact of the physical constraints imposed on a fish movement by their body. Fish
91
mainly achieve collision avoidance through the control of their speed and orientation
92
at the individual level. However, existing models seldom treat collision avoidance in a
93
physical way and most models assume that individuals move at a constant speed [6].
94
This is the main reason why these models cannot be directly implemented in real physical
95
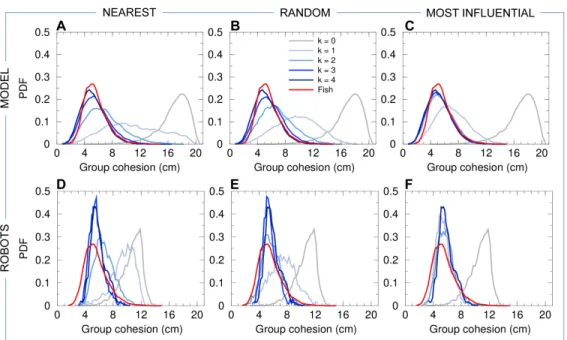
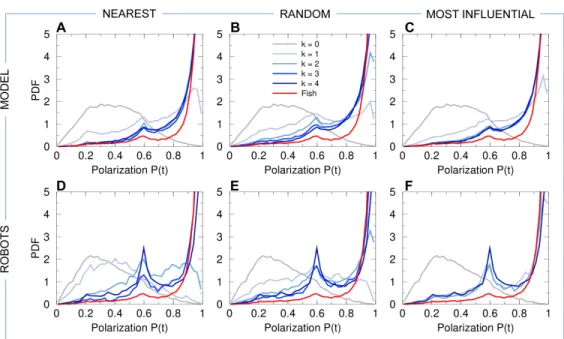
robotic systems [30].
96
To better understand how individuals combine and integrate interactions with their
97
neighbors in a group of moving animals, we first analyze the dynamics of collective
98
movements in groups of five H. rhodostomus moving freely in a circular tank. Then,
99
we investigate different strategies for combining pairwise interactions between fish
100
and analyze their impact on collective motion. To do that, we use the data-driven
101
computational model developed by Calovi et al. [14] that describes the interactions
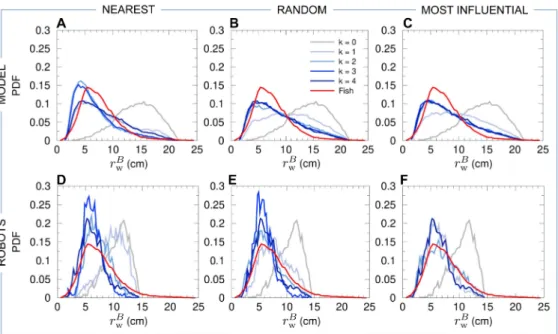
102
involved in the coordination of burst-and-coast swimming in pairs of H. rhodostomus,
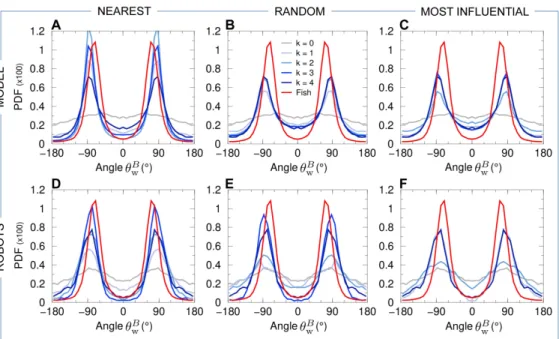
103
and a swarm robotic platform that also allows us to investigate the impact of both
104
direction and speed regulation. Finally, we compare the predictions of the computational
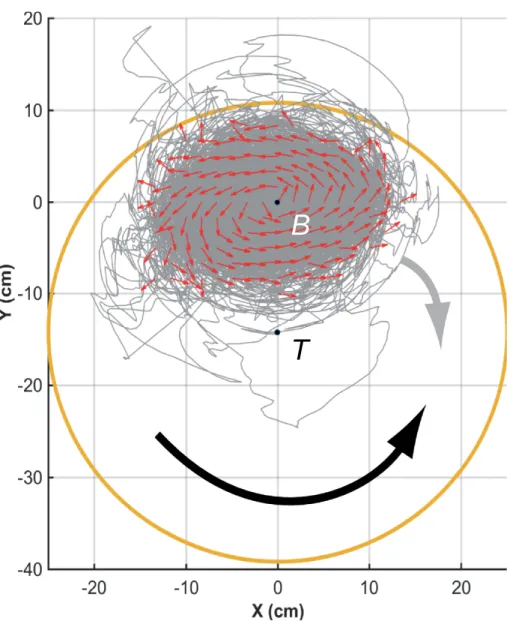
105
and swarm robotics models with the experiments conducted under the same conditions
106
with groups of fish. Our results show that individuals do not need to integrate the
107
information about all their neighbors for coordination to emerge at the group level.
108
Indeed, if each fish interacts only with a single neighbor, the one having the strongest
109
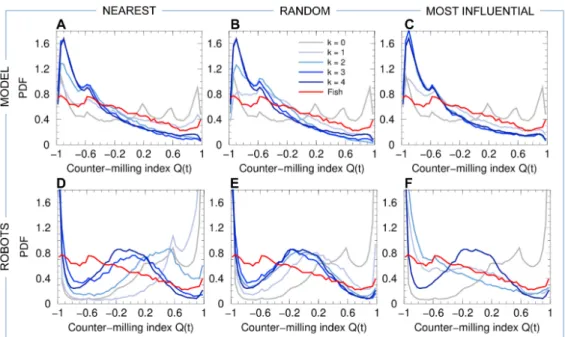
effect on the heading variation of the focal fish, the group maintains its cohesion. Thus,
110
each individual must interact with a very small number of neighbors (i.e., one or two),
111
provided they are those who exert the stronger influence on its own movement.
112
Results
113
We collect three sets of data corresponding to i) our experiments with N = 5 fish
114
(H. rhodostomus), ii) our numerical simulations of the model derived in [14], and iii) our
115
experiments using the robotic platform with N = 5 robots (see Fig. 1, S1 Video and
116
S2 Video), from which we extract the trajectories of each individual (S3 Video). We
117
characterize the collective behavior of fish, agents, and robots by means of five main
118
quantities:
119
• the group cohesion C(t) at time t, which characterizes the effective radius of the
120
group, and hence its compactness;
121
• the group polarization P (t), which quantifies the coordination of the headings of
122
the individuals (P (t) = 1, if all individuals are perfectly aligned; P ∼ 1/√N , if
123
the N individuals have uncorrelated headings, P becoming small only for large
124
group size N , but being markedly lower than 1 for any N ≥ 5);
• the distance rB
w(t) of the barycenter B of the group from the wall of the tank,
126
which is only small compared to the radius of the tank if individuals move together
127
and along the wall of the tank;
128
• the relative orientation θB
w(t) of the barycenter of the group with respect to the
129
wall of the tank, which in particular characterizes whether the group is collectively
130
swimming parallel to the wall of the tank (then, |θB
w| ≈ 90◦);
131
• the counter-milling index Q(t), which measures the relative direction of rotation of
132
individuals inside the group (around the barycenter) with respect to the direction
133
of rotation of the group around the center of the tank (see S4 Video).
134
The Materials and Methods section and Figs. 2 and 3 provide the precise mathematical
135
definition of these quantities. Moreover, we used the Hellinger distance (see Materials
136
and Methods) between two probability distribution functions (PDF) in order to quantify
137
the (dis)similarity between PDF obtained in fish experiments and the corresponding
138
PDF obtained in the fish model (see Table 1) and in robot experiments (see Table 2)
139
H. rhodostomus presents a burst-and-coast swimming mode, where a fish suddenly
140
accelerates along a new direction (“kick”; see Fig. 1B, and S1 Video and S3 Video)
141
and then glides passively until the next kick, along an almost straight line, a gliding
142
phase during which the speed approximately decays exponentially [14]. The fish model
143
derived in [14] explicitly implements this swimming mode and returns as the main
144
information the new heading direction of the focal fish after each kick, which is controlled
145
by its environment (wall of the tank, another fish). The interaction between a fish
146
and the wall, and the interaction between two fish have been precisely extracted from
147
actual experiments with H. rhodostomus [14]. The original procedure for extracting the
148
interactions introduced in [14] exploited a large data set of ∼300000 kicks for one-fish
149
trajectories (in tanks of 3 different radius) and ∼200000 kicks for two-fish trajectories,
150
amounting effectively to a total of 70 hours of exploitable data. The measured interactions
151
were then directly implemented in the model, which is hence not just a phenomenological
152
model with mere guessed, albeit reasonable, interactions. Note however that the analysis
153
in [14] does not provide any insight about how these interactions are combined in groups
154
of more than two fish.
155
The interaction between two fish was shown to be a combination of a repulsive (at
156
short distance of order 1 BL – body length) and a long-range (in particular, compared to
157
zebrafish [15]) attractive interaction at larger distance, and of an alignment interaction
158
which tends to make the two fish align their heading direction. The attraction and
159
alignment interaction functions determine the new heading angle of the focal fish in
160
terms of the instantaneous relative state of the two fish, characterized by the distance
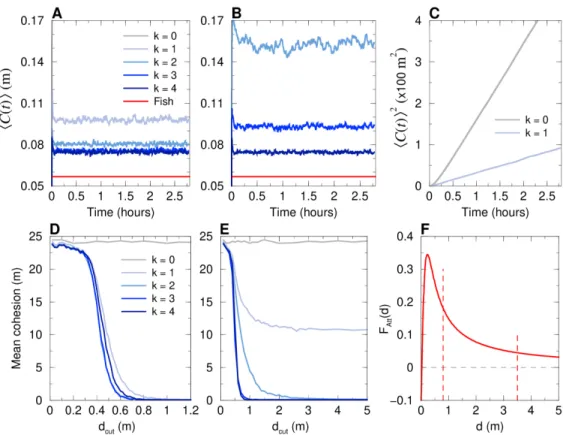
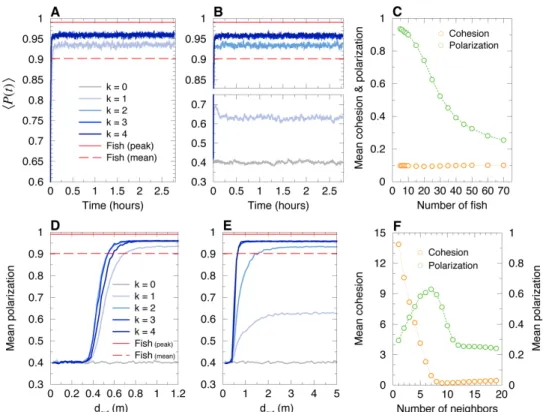
161
between them, the viewing angle with which the neighbor is perceived by the focal fish,
162
and their relative orientation (see Fig. 2). The additional change in heading angle due
163
to the repulsive interaction between a fish and the wall of a circular tank is expressed in
164
terms of the distance and relative angle of the fish to the wall (see Fig. 2). Finally, in
165
addition to the fish-wall and fish-fish interactions, the change in heading angle includes
166
a stochastic contribution describing the spontaneous fluctuations in the motion of the
167
fish. In [14], the model was shown to quantitatively reproduce many fine measurable
168
quantities in one-fish and two-fish experiments, ultimately producing a very precise
169
description of the motion of one or two fish. For the sake of completeness, the model
170
and its fish-wall and fish-fish interaction functions are summarized in the Materials and
171
Methods section (Eqs. (4–15); see [14] for a more detailed description and justification
172
of the model; see [14, 15] for the extraction procedure of the interactions).
173
When more than two fish are swimming in the tank (N > 2), the social pairwise
174
interactions must be combined. In the framework of the fish model, it is natural to assume
175
that the heading angle change of a focal fish is the sum of the pairwise contributions of
some of its N − 1 neighbors. The resulting interaction thus depend on two factors: the
177
number k of considered neighbors and the strategy to select them.
178
We explore three different strategies of interaction between individuals and their
179
neighbors in groups of size N = 5, comparing actual fish experiments with the resulting
180
fish model and the swarm robotic platform (robots programmed with the fish model
181
and a control procedure to resolve collisions). The first strategy is based on the distance,
182
so that individuals interact with their k nearest neighbors, with k = 1, 2, 3. The second
183
strategy is a random strategy, where the k neighbors are randomly sampled among the
184
other N − 1 individuals. Finally, the third strategy is based on the influence, defined
185
below, where the k selected neighbors are those having the largest influence on the focal
186
individual (as determined by the precise two-fish model of [14]). We also study the cases
187
where there is no interaction between individuals (k = 0), and where each individual
188
interacts with all its neighbors (k = 4).
189
The influence Iij(t) of a neighbor j on a focal individual i at time t is defined as the
190
intensity of the contribution of this neighbor j to the instantaneous heading variation
191
of the focal individual i, as given by the firmly tested two-fish model of [14]. The
192
influence Iij(t) depends on the relative state of the neighbor j with respect to the focal
193
individual i, determined by the triplet (dij, ψij, φij), where dij is the distance between
194
individuals i and j, ψij is the viewing angle with which i perceives j (i.e., the angle
195
between the velocity of i and the vector ~ij), and φij is the difference of their heading
196
angles, a measure of the alignment between i and j (see Fig. 2). The influence Iij(t) is
197
calculated by means of the analytical expressions of the pairwise interaction functions
198
derived in [14] for fish swimming in pairs, according to Eq. (9) in the Materials and
199
Methods section.
200
To prevent cognitive overload, a reasonable assumption is that individual fish filter
201
the information from their environment and thus limit their attention to a small set of
202
their most salient neighbors [25–27] (to be followed; or to be avoided, by moving away
203
or by aligning their headings), making the notion of most influential neighbors quite
204
natural.
205
The model for N > 2 fish thus proceeds as follows: at the time t when the agent i
206
(i = 1, . . . , N ) performs a new kick, its change in heading angle is calculated by adding
207
the effects of the wall and the spontaneous noise to the effects of the k neighbors selected
208
among the other N − 1 individuals according to one of the three strategies presented
209
above:
210
• by calculating the instantaneous distance between the focal individual i and each
211
of its N − 1 neighbors and selecting the k nearest neighbors (strategy 1; nearest);
212
• by randomly sampling k individuals among the N − 1 neighbors of i (strategy 2;
213
random);
214
• by calculating the instantaneous influence Iij(t) for each neighbor j of i and
215
selecting the k neighbors with the largest influence (strategy 3; most influential).
216
These interaction strategies explore different ways for an individual to focus its attention
217
on the most relevant stimuli (i.e., neighbors).
218
Collective behavior in fish experiments
219
Fish form cohesive groups with an average cohesion C ≈ 5 cm (Fig. 4). They are highly
220
polarized, with the 5 fish swimming almost in the same direction (large peak at P ≈ 1
221
in the distribution of P ; Fig. 5). In some instances, groups are observed in which
222
one fish swims in the opposite direction to that of the other four, as shown by the
223
small bump at P ≈ 0.6 in Fig. 5. Indeed, in this situation, the polarization is close
to P ≈ |1 + 1 + 1 + 1 − 1|/5 = 0.6. Even less frequent are situations where two fish
225
swim in the opposite direction to that of the other three, as shown by the very small
226
bump near P ≈ |1 + 1 + 1 − 1 − 1|/5 = 0.2. The density maps of polarization P with
227
respect to cohesion C (panels labeled “fish” in S1 Fig–S4 Fig) allow to visualize the
228
correlations between both quantities, and will permit a comparison with the predictions
229
of the fish model and the results of the robot experiments for the three interaction
230
strategies considered here.
231
Groups of 5 fish rotate clockwise (CW) or counter-clockwise (CCW) along the tank
232
wall for long periods and remain close to the border of the tank, the group barycenter
233
being at a typical distance rB
w ≈ 7 cm from the wall (Fig. 6). Therefore, the group swims
234
almost always parallel to the nearest wall, with a relative angle to the wall of the heading
235
of the barycenter close to |θB
w| ≈ 90◦ (Fig. 7). In fact, the peak in the PDF of |θBw| is
236
slightly below 90◦, since the fish are more often going toward the wall than away from
237
it [14].
238
We also find a collective pattern where individual fish rotate around the barycenter B
239
of the group in a direction which is opposite to the direction of rotation of the group around
240
the center T of the tank (see Fig. 3 and S4 Video). We call this collective movement a
241
counter-milling behavior, and define the instantaneous degree of counter-milling Q(t) as
242
a measure in [−1, 1] of the intensity with which both rotation movements are in opposed
243
directions (see the Materials and Methods section for the precise mathematical definition
244
of Q(t) and its general interpretation). When Q(t) < 0, the fish rotate around their
245
barycenter B in the opposite direction to that of the group around T (counter-milling),
246
while when Q(t) > 0, the fish rotate in the same direction around B as the group rotates
247
around T (super-milling). Fig. 8 shows that the fish exhibit a counter-milling behavior
248
much more frequently than a super-milling behavior. Counter-milling behaviors result
249
from the fact that fish located at the front of the group have to reduce their speed as
250
they get closer to the wall of the tank. Fish located at the back of the group (that
251
are generally farther from the wall [14]) move faster and outrun the slowing down fish,
252
ultimately relegating them to the back of the group. This process gives rise to the
253
rotation of individual fish around the group center, in the opposite direction to the one
254
that the group displays around the tank (Fig. 3). This collective behavior resembles a
255
coordinated swimming by relays which is nevertheless due to simple physical constraints,
256
as already reported on wolf-packs hunting preys moving in circles [31].
257
Simulation results of the computational model
258
Collective motion in a circular tank
259
Panels (ABC) of Figs. 4–8 show the probability distribution functions for our 5 quantifiers
260
as obtained in numerical simulations of the fish model. The panels correspond respectively
261
to the strategy in which agents interact with their k nearest neighbors (A), with
262
k neighbors chosen randomly (B), and with k neighbors selected according to their
263
influence on the focal agent (C). For these three strategies (nearest; random; most
264
influential), we have considered all the possible values of the number of interacting
265
neighbors, k = 1, 2, 3, together with the case where there is no interaction between
266
agents (k = 0) and the case where each agent interacts with every other agent (k = 4).
267
For comparison purposes, we have rescaled the distance corresponding to the model
268
by a factor λM = 0.87. This value is the minimizer of the l1-norm of the difference
269
between the PDF of group cohesion for fish data, and the PDF of group cohesion for the
270
simulation data produced by the model when using the strategy involving the k = 2 most
271
influential neighbors. Noticeably, the fact that the value of λM is close to 1 indicates
272
that the model produces a quite satisfactory quantitative approximation to the data of
273
real fish. This rescaling procedure only affects the PDF of C and rBw, and not the PDF
of P , θB
w, and Q (3 quantities invariant by a change of distance scale).
275
When k = 0, there is no interaction between agents and, as expected, one does not
276
observe any compact group: individuals turn independently around the tank remaining
277
close and parallel to the wall (as expected for fish swimming alone [14]). Their position
278
and rotation direction along the walls are uncorrelated, and the individuals are scattered
279
along the border (cohesion peaked around C ≈ 18 cm; rB
w≈ 15 cm), with an almost flat
280
PDF for θB
w (random orientation of the barycenter with respect to the wall). This results
281
in a bell-shaped probability distribution function PDF for the polarization P , vanishing
282
at P = 1 (Figs. 4–7).
283
For k = 1, whatever the strategy used to select the interacting neighbor (the nearest
284
one; a randomly selected one; the most influential one), the dynamics immediately
285
reveals that interactions are at play, with groups becoming more cohesive (Fig. 4) and
286
more polarized (Fig. 5) than for k = 0. Yet, the nearest strategy still leads to a very
287
broad PDF of the group cohesion C, with a substantial weight near the maximal value
288
of C ∼ 20 cm obtained for k = 0, indicating that the group often breaks into parts. For
289
the random and most influential strategies, the weight at large distance in the PDF
290
of C is absent, but the PDF are still broader than in fish experiments. As confirmed by
291
the Hellinger distance quantifier (see Table 1 and Materials and Methods), the most
292
influential strategy clearly leads to the sharper distribution of C (peaked around
293
C ≈ 6.5 cm, compared to C ≈ 10 cm for the random strategy). The next section will
294
show that, contrary to the nearest strategy, the most influential strategy with
295
k = 1 can lead to compactness of the group even for larger groups (N = 6–70) moving
296
in an unbounded domain. As for the group polarization P (Fig. 5), the three strategies
297
lead to a PDF clearly peaked near P ≈ 0.9 (and a smaller peak near P ≈ 0.6; see above),
298
yet certainly not as peaked near P = 1 as the PDF for fish experiments. Again, the
299
most influential strategy leads to the best agreement with fish experiments (see
300
Table 1), although the difference between strategies is not as marked as for the group
301
cohesion. For the three strategies, the barycenter of the group is closer to the border
302
and moves more parallel to the wall (Figs. 6 and 7). Counter-milling is obtained for
303
the three strategies with comparable PDF (Fig. 8; see also S5 Fig), quite similar to the
304
one obtained in fish experiments (we will see that the agreement unfortunately worsens
305
when increasing k; see Table 1). Polarization vs cohesion density maps confirm that the
306
nearest and random strategies are insufficient to convey the necessary information to
307
reach the degree of cohesion and polarization (and their correlation) observed in groups
308
of fish (S1 Fig, S2 Fig). The most influential strategy density maps for k = 1 already
309
present the main features of the fish experiments, despite a still too broad spreading
310
in the (C, P ) plane. Overall, for k = 1, the most influential strategy gives rise to
311
significantly better results than the nearest and random strategies (see Table 1).
312
For k = 2, the three strategies lead to a collective behavior in much better agreement
313
with the fish experiments (see Table 1). In particular, the nearest strategy now
system-314
atically leads to compact groups, with a PDF of the group cohesion C (Fig. 4) similar
315
to the one obtained for the random strategy (both peaked around C ≈ 6.5 cm). The
316
most influential strategy produces a PDF in good agreement with fish experiments
317
(both sharply peaked around C ≈ 5 cm). The PDF of the polarization is now sharply
318
peaked at P = 1 for the three strategies, with a slightly lower level of polarization for
319
the random strategy compared to the two others (see Fig. 5 and Table 1). Like in the
320
case k = 1, the distance and alignment of the group with respect to the wall are better
321
recovered for the nearest strategy (Figs. 6 and 7; Table 1), the two other strategies
322
leading to slightly broader PDF but much narrower compared to the case k = 1. The
323
counter-milling Q is enhanced for the three strategies compared to the case k = 1 and
324
appears stronger than for fish experiments (Fig. 8). The deterioration of the model
325
results for the counter-milling compared to k = 1 and experiments suggests that the
internal structure of a fish group is more rigid than predicted by the model, actual fish
327
behaving closer to particles rotating on a vinyl record (see the interpretation of Q in
328
Materials and Methods). Compared to the case k = 1, where they were particularly far
329
from the experimental maps, polarization vs cohesion density maps for the nearest
330
and random strategies and k = 2 show a correlation between P and C in much better
331
agreement with experiments (S1 Fig, S2 Fig). The most influential strategy results,
332
already fair for k = 1, also improve. The nearest strategy leads to the best agreement
333
with experiments in the representation of S1 Fig, while the most influential strategy
334
leads to the best results in the representation of S2 Fig.
335
When interacting with k = 3 neighbors, the results are almost identical for the
336
three strategies because neighbors are the same a high percentage of the time. For two
337
(respectively, three) given strategies, the selected neighbors are exactly the same 25% of
338
the time (respectively, 6.25%); they have at least 2 neighbors in common 75% of the
339
time (respectively, 93.75%); there is always at least one neighbor in common. Interacting
340
with the 3 nearest neighbors instead of 2 only improves the group cohesion (see Table 1
341
and Fig. 4), while using the 3 most influential ones, instead of 2, does not improve
342
significantly any of the measures, including density maps (S1 Fig, S2 Fig). As already
343
noted for k = 2, the counter-milling remains too pronounced compared to experiments
344
for the three strategies and k = 3 (see Fig. 8 and S5 Fig).
345
Finally, interacting with k = 4 neighbors does not significantly change the results
346
obtained for k = 3 (see Figs. 4–8 and Table 1).
347
Collective motion of 5 agents in an unbounded domain
348
The model allows us to simulate the condition where agents are swimming in an
un-349
bounded domain by removing the interaction with the wall. This condition is particularly
350
interesting to assess the impact of the confinement of the agents due to the arena on
351
group cohesion and polarization.
352
Figs. 9 and 10 show respectively the time evolution of group cohesion and polarization
353
for the most influential strategy (Panels AD) and the nearest strategy (Panels BE),
354
and for k = 1 to 4. Despite the absence of confinement due to the wall, all the strategies
355
except the one that consists in interacting only with the nearest neighbor (k = 1) allow
356
the group to remain cohesive and polarized for more than 2.5 hours (≈ 104 kicks) in
357
numerical simulations (see Figs. 9ABC and 10AB). When agents only interact with their
358
most influential neighbor, the group is highly cohesive (C ≈ 0.1 m, Fig. 9A), but less
359
than in the arena (C ≈ 0.07 m, Fig. 4C). However, the polarization is higher when the
360
group swim in an unbounded domain (mean of P ≈ 0.93, Fig. 10A) in comparison to
361
the arena (mean of P ≈ 0.78, Fig. 5C). Therefore, the confinement due to the arena
362
reinforces the group cohesion and weakens the group polarization, which still remains at
363
a high level for the most influential strategy.
364
However, when agents only interact with their first nearest neighbor, the group
365
disintegrates very quickly and then diffuses, with C2(t) growing linearly with the time t
366
(Fig. 9C), and P (t) oscillating around 0.6 (Fig. 10B). Compact groups are recovered for
367
the nearest strategy with k = 2, 3, but the most influential strategy systematically
368
leads to more cohesive and more polarized groups (Fig. 9AB).
369
In order to better understand to what extent the group cohesion depends on the
370
interaction strategy and/or on the long-range nature of the attraction [14], we have
371
also simulated the model by truncating the attraction interaction between two agents i
372
and j when their distance dij is greater than a cut-off distance dcut: FAtt(dij) = 0, if
373
dij> dcut, where FAttis defined in Eq. (10) of the Materials and Methods section. When
374
dcutdecreases below some critical value d∗cut, we expect that the group will break and
375
that the agents will ultimately freely diffuse, illustrating the importance of the range
of the attraction interaction to ensure the cohesion of the group (see Fig. 9DE) and
377
Fig. 10DE).
378
For the most influential strategy with k = 1, the group remains highly cohesive
379
(Fig. 9D) and highly polarized (Fig. 10D) for dcut > d∗cut ≈ 0.9 m. For k = 2, 3,
380
and 4, d∗cutis found to be slightly smaller than for k = 1 (d∗cut≈ 0.8 m; Fig. 9D). For
381
the nearest strategy with k = 2 (the group is never cohesive for k = 1, even for
382
dcut= ∞; see above), we find d∗cut≈ 3.5 m (Fig. 9E), much higher than for k = 1 in the
383
most influential strategy. Here, we clearly see that even at a smaller k, the most
384
influential strategy is much more effective than the nearest strategy in ensuring
385
the cohesion of the group, for finite-range attraction cut-off at dcut. For k = 3, the
386
nearest strategy leads to a critical cut-off d∗cut≈ 0.9, of the same order as for the most
387
influential strategy (for k = 3, the involved neighbors are often the same for both
388
strategies; see above).
389
In conclusion, for groups of 5 agents in an unbounded domain, we have shown that
390
the most influential strategy leads to a highly cohesive and polarized group for all
391
k = 1, 2, 3, provided the range of the attraction is not too small (dcut> 0.8 m). For the
392
nearest strategy, the group is never cohesive for k = 1, and a much larger range of the
393
attraction (dcut> 3.5 m) is required to ensure the cohesion of the group for k = 2.
394
Collective motion of larger groups in an unbounded domain
395
For agents moving in an unbounded domain, we have simulated the model with the most
396
influential strategy with k = 1, for groups of N = 6 to 70 individuals starting initially
397
in a compact configuration (see Fig. 10C). The group remains highly cohesive for all sizes
398
(up to N = 70), with a group cohesion of order C ∼ 0.1 m. The polarization remains
399
high (P > 0.7) in groups of size N ≤ 20, and decreases as the group size increases. This
400
suggests a smooth cross-over between a schooling phase up to moderate group sizes
401
N ∼ 20, and a more disordered swarming phase for larger N . In fact, for the largest
402
values of N investigated, schooling periods are also observed, alternating with periods
403
of collective milling, resulting de facto in a reduced polarization of the group. The
404
occurrence of the swarming, schooling, and milling phases as a function of the model
405
parameters (group size N , strategy to select the interacting neighbors, intensity and
406
range of the attraction/alignment interactions...) will be studied in a future work, as it
407
has been previously done for the species Kuhlia mugil [32] (a species displaying a smooth
408
swimming mode, instead of a burst-and-coast swimming mode).
409
When agents only interact with their nearest neighbor, groups larger than N = 5
410
disperse immediately and a larger number of neighbors k must be taken into account to
411
preserve some degree of cohesion. We have also simulated larger groups (N = 6, . . . , 26;
412
N even) with k = 1 to N − 1 for the nearest strategy. The results of S7 Fig (and
413
Fig. 10F, in the particular case N = 20) show that each agent must interact at least
414
with k ∼ N/2 nearest neighbors in order to obtain a degree of cohesion similar to the
415
one observed for the most influential strategy with k = 1. Moreover, once k > N/2,
416
groups become less cohesive as the number of nearest neighbors taken into account by
417
agents increases. In fact, for N > 6 and whatever the value of k, the nearest strategy
418
always leads to less cohesive groups (S7 FigA) than for the most influential strategy
419
with k = 1, for which C ∼ 0.1 m.
420
The simulation results also show that for the nearest strategy with k < 7, the
421
degree of polarization decreases with the group size. Moreover, the polarization reaches
422
a maximum for k ∼ N/2 until N ≤ 14. For larger groups, interacting with more than
423
k = 7 nearest neighbors reduces the degree of polarization, which becomes smaller as k
424
increases (see S7 FigB and the particular case of N = 20 in Fig. 10F).
Collective behavior in swarm robotics experiments
426
We now present the results of a series of experiments with N = 5 robots exploiting the
427
three interaction strategies considered in the fish model. The robots are programmed
428
to reproduce the model behavior (Eqs. (4–15) in Materials and Methods), with model
429
parameters adapted to the different spatial and temporal scales of the robotic
experi-430
mental setup (see S1 Table). In addition, robots operate a control procedure designed to
431
resolve collisions with the wall, and most importantly, with other robots (see Materials
432
and Methods). Indeed, contrary to point particle agents in the fish model or to real fish
433
swimming in shallow water (a truly 3D environment), robots moving on a strictly 2D
434
setup cannot physically cross each other. The robots hence combine a behavioral model
435
and an engineering-minded control system to deal with real-world physical constraints.
436
Our swarm robotic platform provides a concrete implementation of these two elements
437
and understanding their interplay and their combined impact on the collective behavior
438
of robots is certainly one of the main motivation of the experiments presented here.
439
Panels (DEF) of Figs. 4–8 show the results of the robotic experiments performed in
440
the same conditions as those studied with the model, including the case where robots do
441
not interact with each other (k = 0) and the case where each robot interacts with all its
442
neighbors (k = 4). Counter-milling in robots is illustrated in S6 Fig, and the density
443
maps of cohesion and polarization are shown in S3 Fig and S4 Fig. The robotic platform
444
and the monitoring of a swarm of 5 robots in motion are shown in S2 Video.
445
Despite the fact that the spatial and temporal scales of the robotic platform have
446
been scaled at best to correspond to that of the fish experiments (in particular, 4 × 4 cm
447
square robots in an arena of radius R = 42 cm vs elongated fish of typical length 3 cm
448
swimming in a tank of radius R = 25 cm), the border and other robots have a stronger
449
effect on a focal robot at short distance. Indeed, as explained above, the collision
450
avoidance protocol (see Materials and Methods) induces effective interactions between
451
the robots that have a longer range than the interactions between fish. In addition, the
452
square shape of the robot also makes them effectively bigger than if they were elongated
453
like fish. Hence, the rescaling of distances as measured in robot experiments is necessary
454
to be able to compare the different spatial distributions in fish and robot experiments,
455
although it does not affect polarization, counter-milling, or angular distributions. As a
456
result, we found a much smaller scaling factor than in model simulations: λR= 0.35.
457
Note that once the optimal scaling factor is determined, it is kept fixed in all considered
458
situations (strategy to select the interacting neighbors and their number k). From now,
459
all distances in the robot experiments mentioned in this section are hence expressed
460
after rescaling to be comparable to corresponding distances in the fish experiments.
461
When k = 0, robots move independently from each other when they are sufficiently
462
far from each other, and tend to remain dispersed along the border of the arena (S5
463
Video). The group cohesion is weak (cohesion peaked at C ∼ 12 cm; Fig. 4DEF), and
464
the distance of the barycenter to the wall is large (rB
w ∼ 12 cm; Fig. 6DEF). Robots are
465
relatively more cohesive and closer to the wall compared to the fish model for k = 0 due
466
to volume exclusion effects (two colliding robots can end up going in the same direction
467
as a result of the control procedure) and because the confining effects of the border of
468
the arena are stronger in robots than in agents (see also S3 Fig and S6 Fig). Robots are
469
not polarized, as already observed in the fish model simulations for the same condition
470
k = 0 (Panels DEF in Figs. 5).
471
Interacting only with k = 1 nearest neighbor does not allow robots to coordinate their
472
motion and move as a coherent group (see S6 Video). Panel (D) of Figs. 4–8 (cohesion;
473
polarization; distance to the wall; angle with respect to the wall; counter-milling) show
474
that the results for k = 1 are similar to those obtained for k = 0, with a marginal
475
improvement of the group cohesion and polarization. On the other hand, when the
476
robots interact with their most influential neighbor (S7 Video), the group is highly
cohesive (C ∼ 6.5 cm; Fig. 4F) and highly polarized (large peak at P = 1 in Fig. 5F).
478
The robots collectively move close to the border (rwB∼ 7 cm; Fig. 6F). Counter-milling is
479
also clearly visible (Fig. 8F, S7 Video and S6 Fig). Moreover, for the random strategy
480
with k = 1, the results are somewhat intermediate between those for the nearest and
481
most influential strategies, in terms of cohesiveness, polarization, and counter-milling
482
(see Panel E in Figs. 4, 5, 8 respectively, and S8 Video). The similarity of the density
483
maps of cohesion and polarization with those found in fish experiment is the highest for
484
the most influential strategy compared to the other two strategies (S3 Fig and S4
485
Fig). Overall, and as confirmed by the Hellinger distances listed in Table 2, the most
486
influential strategy with k = 1 produces highly cohesive and polarized robot groups
487
leading to a qualitative agreement with fish experiments, whereas the nearest strategy
488
does not even lead to any significant group coordination.
489
Extending the interaction to the k = 2 nearest neighbors reinforces group coordination
490
(S9 Video): groups are more cohesive (the peak in the PDF of C decreases from around
491
10 cm for k = 1, to 7 cm), and simultaneously more polarized (S3 Fig). However, the
492
polarization remains weak compared to fish experiments, and even compared to the
493
most influential strategy for k = 1: the PDF of P has a wide region of high values
494
centered in P ≈ 0.85 and is not peaked at P = 1 (Fig. 5D). The high peak at P = 0.6
495
reveals that situations in which groups of 4 robots move in the same direction while the
496
fifth robot moves in the opposite direction are quite frequent. Wide groups (C > 8 cm,
497
Fig. 4D) moving far from the border (rB
w > 9 cm, Fig. 6D) are still frequent, and
498
counter-milling is still barely visible (S6 Fig). On the other hand, interacting with the
499
two most influential neighbors definitively produces patterns that are similar to those
500
observed in fish experiments, especially if we consider the polarization, where the peak
501
at P = 1 clearly narrows and doubles its height (Fig. 5F and S10 Video), although the
502
improvement with respect to the most influential strategy with k = 1 is small, or
503
even negligible, if we consider the counter-milling index (Fig. 8F). Again, the random
504
strategy with k = 2 leads to an overall much better agreement with fish experiments
505
than the nearest strategy with k = 2 (see Hellinger distances between PDF in Table 2).
506
Except for the weaker polarization, the results for the random strategy are similar to
507
the ones obtained for the most influential strategy with k = 2 (see Table 2 and S11
508
Video).
509
For k = 3, the results for the nearest strategy (see S12 Video) improve drastically
510
and are in comparable agreement with fish experiments as the results for the random
511
strategy (S13 Video), and on par with those for the most influential strategy for
512
k = 1, 2 (see Table 2). For the nearest and random strategies (sharing 2, and often
513
3, common neighbors for k = 3), groups are highly cohesive (Fig. 4DE) and polarized
514
(Fig. 5DE), with a narrower PDF of C than in fish experiments, pointing to the robot
515
groups having less internal fluctuations than fish groups. Accordingly, the PDF of rB w
516
(Fig. 6DE) is peaked at the same value as in fish experiments, rB
w ≈ 5.5 cm, but is again
517
narrower, with much less weight at distances rB
w > 8 cm. The PDF of θBw (Fig. 6DE) is in
518
good agreement with fish experiments, and counter-milling is clearly obtained (S6 Fig).
519
When robots interact with k = 4 neighbors (S14 Video), the results are very similar to
520
the case k = 3 within the non negligible statistical fluctuations due to our shorter robot
521
experiments compared to the fish experiments and fish model simulations.
522
In conclusion, many of the results of the robotic experiments are qualitatively similar
523
to those found in the simulations of the model, despite the robots being submitted
524
to real-world physical constraints. Yet, for robots, the most influential strategy
525
with k = 1 is found to lead to cohesive and polarized groups (like in the model), while
526
the nearest strategy with k = 1 does not lead to any significant group coordination
527
(weaker coordination for the model in a confining domain, but no cohesive groups in an
528
unbounded domain).
Discussion
530
Collective motion involving the coherent movements of groups of individuals is primarily
531
a coordination problem. Each individual within a group must precisely adjust its
532
behavior to that of its neighbors in order to produce coordinated motion. Determining
533
how these relevant neighbors are selected at the individual scale is therefore a key
534
element to understand the coordination mechanisms in moving animal groups. Previous
535
experimental works on fish and birds have identified interacting neighbors using
short-536
term directional correlations [17,34] or anisotropy of the position of the nearest neighbors
537
[21]. In a starling flocks (Sturnus vulgaris), each bird coordinates its motion with a finite
538
number of closest neighbors (typically seven), irrespective of their distance [21]. However,
539
in fish schools, experimental studies suggest that each individual only interacts with a
540
smaller number of influential neighbors. For instance, in the mosquitofish (Gambusia
541
holbrooki ), each fish mostly interacts with a single nearest neighbor [35]. In the rummy
542
nose tetra (Hemigrammus rhodostomus) during collective U-turns [28, 36], the analysis
543
of directional correlations between fish suggests that each fish mainly reacts to one or
544
two neighbors at a time [28]. These results are in line with theoretical works that have
545
suggested that, instead of averaging the contributions of a large number of neighbors,
546
as suggested by many models [18–20, 23, 37, 38], individuals could pay attention to only
547
a small number of neighbors [25–28, 39]. This mechanism would overcome the natural
548
cognitive limitation of the amount of information that each individual can handle [33].
549
Here, we addressed this question in groups of five H. rhodostomus swimming in a
550
circular tank. This species of fish is of particular interest because of its tendency to form
551
highly polarized groups and its burst-and-coast swimming mode [14], which allows us to
552
consider that each fish adjusts its heading direction at the onset of each bursting phase,
553
that is labeled as a “kick”. Just before these brief accelerations, a fish integrates and
554
filters the information coming from its environment and picks its resulting new heading.
555
In our experiments, groups of five fish remain highly cohesive, almost perfectly
556
polarized, and swim along and close to the wall of the tank, keeping the same direction of
557
rotation for very long periods [36]. Fish groups also display a remarkable counter-milling
558
collective behavior where individual fish rotate around the group barycenter in the
559
opposite direction to that of the group in the tank, so that individuals alternate their
560
positions at the front of the group.
561
Based on a previous work in which we have reconstructed and modeled the form of the
562
interactions of H. rhodostomus fish swimming in pairs [14], we analyzed three strategies
563
for combining the pairwise interactions between a focal fish and a number k = 1 to 3 of
564
its neighbors by means of a computational model and a robotic platform. In the nearest
565
strategy, neighbors are selected according to their distance to the focal individual. In
566
the random strategy, neighbors are randomly chosen, and in the most influential
567
strategy, neighbors are selected according to the intensity of their contribution to the
568
heading variation of the focal individual. The impact of these strategies on the resulting
569
collective behavior was then measured and analyzed by means of five quantities: group
570
cohesion, group polarization, distance and relative orientation of the barycenter with
571
respect to the border of the tank, and counter-milling index.
572
Our results suggest that when individuals (agents or robots) interact with a minimal
573
number of neighbors, namely two, a group of individuals is able to reproduce the main
574
characteristics of the collective movements observed in the fish experiments.
575
In the simulations of the model for N = 5, when the agents are interacting with
576
a single neighbor, this immediately leads to the formation of groups. Whatever the
577
strategy used to select a neighbor, the quantities used to quantify group behavior show
578
that the exchange of information with a single neighbor leads agents to get closer to each
579
other, at least temporarily for the nearest strategy. However, whatever the strategy
580
considered, cohesion, polarization, and counter-milling are still weak compared to fish
experiments, although the most influential strategy convincingly leads to the best
582
group coordination for k = 1.
583
The simulations of the model in an unbounded domain show that group cohesion is
584
maintained over long periods of time when agents only interact with their most influential
585
neighbor, provided the attraction range is above a critical threshold distance. However,
586
when agents only interact with their nearest neighbor, this systematically leads to the
587
diffusive dispersion of the group. For groups of size up to N = 70, interacting with the
588
most influential neighbor leads to compact groups, while one needs to consider typically
589
at least ∼ N/2 nearest neighbors to achieve the same result for the nearest strategy.
590
Therefore, the cohesion of the group observed in the arena is not a merely consequence
591
of the confinement of the agents, but mainly results from the higher quality of the
592
information provided by the influential neighbors in comparison to the one provided by
593
the nearest neighbors.
594
Then, when agents acquire more information about their environment (k = 2), all
595
the interaction strategies implemented in the model give rise to collective behaviors that
596
are in qualitative agreement with those observed in the experiments with fish, and a
597
quantitative agreement is even reached for some quantities characterizing group behavior
598
(see Table 1). When agents collect even more information about their environment
599
(i.e., when they pay attention to k = 3 neighbors), the agreement with fish experiments
600
is not improved if the neighbors are chosen according to their influence. However,
601
groups become more cohesive and polarized when the agents interact with their nearest
602
neighbors. Yet, for k = 3, the three strategies lead to comparable results, which is
603
consistent with the facts that two strategies have necessarily at least two common
604
neighbors for groups of five individuals. Note that for k = 2 and k = 3, and for all
605
three strategies, the intensity of the counter-milling is larger in the model than in fish
606
experiments, suggesting that the internal structure of real fish groups is more rigid than
607
predicted by the model.
608
In summary, the simulation results clearly indicate that group behaviors similar
609
to those observed in fish experiments can be reproduced by our model, provided that
610
individuals interact with at least two of their neighbors at each decision time and no
611
clear gain is obtained when agents interact with a third additional neighbor. When only
612
one interacting neighbor is considered, the most influential strategy leads to the
613
best group coordination, which even survives when the group moves in an unbounded
614
domain.
615
By implementing the behavioral fish model and the same local interaction strategies
616
in our robotic platform, we also investigated the impact of the physical constraints and
617
the collision avoidance protocol based on speed control on the group behavior. The
618
most influential strategy is much more efficient than the two other strategies to
619
ensure group cohesion and polarization (see Table 2). Remarkably, and as already
620
observed in the model simulations, even when robots only interact with their most
621
influential neighbor, the group remains highly cohesive and polarized, and close to the
622
border. By contrast, when robots only interact with their nearest neighbor, they are
623
not able to exhibit any kind of coordinated behavior. Everything happens as if pairwise
624
interactions between robots were screened by the effect induced by the collision avoidance
625
protocol: the distributions of the group cohesion, the polarization, and the distance
626
of the barycenter of the group to the border of the tank are almost identical to those
627
obtained with the null model, in which no interaction exists between robots except for
628
collision avoidance. When robots interact with two neighbors, the agreement with the
629
results of fish experiments is improved, but it is only when robots interact with three
630
nearest neighbors that the nearest strategy produces highly cohesive and polarized
631
groups.
632
Overall, and even more convincingly than in the case of the fish model, the most
influential strategy leads to the best overall agreement with fish experiments for k = 1
634
and k = 2, even producing strongly coordinated groups for k = 1. Compared to the
635
case of the fish model, the nearest strategy does not lead to any significant group
636
coordination for k = 1, and only to moderately cohesive and polarized groups for k = 2,
637
yet being even less efficient than the random strategy. The robot collision avoidance
638
protocol induces a strong effective repulsion between close neighbors, which screens the
639
behavioral interactions for the strategy based on these nearest neighbors.
640
In vertebrates, and in particular in fish, the midbrain and forebrain networks are
641
carrying out computation in parallel to process the visual information and select the
642
most salient stimuli that are the focus of attention. The midbrain network continuously
643
monitors the environment for behaviorally relevant stimuli [40]. This is a primary site
644
where the information about the neighbors is filtered for cognitive decision. Then, the
645
forebrain network selects those stimuli on which the fish focuses its attention. The
646
interaction strategies that we have investigated in this work correspond to the different
647
ways for an individual to focus its attention on the stimuli (i.e., its relevant neighbors).
648
Our results show that each fish interacts with one or two neighbors that are the most
649
salient, a process which reduces the amount of information that needs attention.
650
In conclusion, each individual must acquire a minimal amount of information about
651
the behavior of its neighbors for coordination to emerge at the group level, thus allowing
652
individuals to avoid information overload when they move in large groups [33].
653
Materials and Methods
654
Fish experiments
655
Ethics statement. Our fish experiments have been approved by the Ethics Committee
656
for Animal Experimentation of the Toulouse Research Federation in Biology N◦1 and
657
comply with the European legislation for animal welfare.
658
Study species. Rummy-nose tetras (Hemigrammus rhodostomus) were purchased
659
from Amazonie Lab`ege (http://www.amazonie.com) in Toulouse, France. Fish were kept
660
in 150 l aquariums on a 12:12 hour, dark:light photoperiod, at 25.2◦C (±0.7◦C) and
661
were fed ad libitum with fish flakes. The average body length of the fish used in these
662
experiments is 31 mm (±2.5 mm).
663
Experimental setup. We used a rectangular experimental tank of size 120 × 120 cm,
664
made of glass, supported by a structure of metal beam 20 cm high. A plywood plate
665
was interposed between the mesh and the basin to dampen the forces exerted on the
666
glass basin by its own weight and water. This structure also enables the attenuation
667
of vibrations. The setup was placed in a chamber made by four opaque white curtains
668
surrounded by four LED light panels to provide an isotropic lighting. A circular tank of
669
radius R = 250 mm was set inside the experimental tank filled with 7 cm of water of
670
controlled quality (50% of water purified by reverse osmosis and 50% of water treated
671
by activated carbon) heated at 24.9◦C (±0.8◦C). Reflection of light due to the bottom
672
of the experimental tank is avoided thanks to a white PVC layer.
673
Each trial started by placing groups of N = 5 fish randomly sampled from the
674
breeding tank into the circular tank. Fish were let for 10 minutes to habituate before
675
the start of the trial. A trial then consisted of one hour of fish freely swimming in
676
the circular tank with experimenters out of the room. Fish trajectories were recorded
677
by a Sony HandyCam HD camera filming from above the setup at 25 Hz (25 frames
678
per second) in HDTV resolution (1920×1080p). We performed 11 trials with groups of
679
N = 5 fish, and for each trial, we used different fish taken from the breeding tank.
Swarm robotic platform
681
Robots. We used a swarm robotic platform composed by small compact mobile robots
682
that we named “Cuboids”, a name chosen in reference to the first realistic computer
683
program that simulated the flocking behavior in birds and the schooling behavior in fish,
684
called “Boids”, developed in 1986 by Craig Reynolds [41]. The Cuboids robots were
685
specifically designed by us for this experiment.
686
Cuboids have a square basis of 40 × 40 mm, they are 60 mm high and weigh 50 g
687
(Fig. 11). We now describe the elements of a Cuboid (numbers between parentheses
688
refer to labels in Fig. 11). Each robot is equipped with two differential wheels (7)
689
driven by small DC motors (13). The small belts (9) connect wheels to the DC motors,
690
which can drive the robot with a maximum speed of 50 mm/s. The two wheels are
691
mounted on a central axis (6). An IEEE 802.11n/WIFI module (8) with a range of
692
approximately 200 m is used for communication network between robot and a wireless
693
router. A Li-Poly rechargeable battery (15) provided energy for about 6 hours in our
694
experimental conditions. In addition, a coil (12) located under the robot, can be used
695
to charge the robot wirelessly while it is working. The charging circuit is located on
696
the side board (11). The robot bottom hosts a 32-bit, 168 MHz ARM microprocessor
697
STM32F4 (14), which can provide multi control loops with the time duration up to
698
2 ms. Besides, another 8-bit microcontroller PIC18F25k22 is mounted on the top sensor
699
board (1), which controls a LCD screen (16) to display information and a 3-colors
700
LED (17). The microprocessor communicates with the microcontroller by 4 copper
701
bars (4), which can simultaneously provide power and communication bus.
702
Each Cuboid also has several sensors to measure the relative positions of other robots
703
in its neighborhood and to send and receive messages from these robots. Within a
704
sensing range of about 20 cm, a robot can send messages (infrared signals) by the center
705
IR transmitter (3). There are two IR receivers (2) on both sides of the robots, which
706
can determine the distance of a neighboring robot that transmits the infrared signal.
707
From the two distance values provided by the IR receivers, the angle with which this
708
neighboring robot is perceived by the focal robot can be calculated by triangulation.
709
Furthermore, the relative position of the neighboring robot to the focal one can be
710
computed by the information of the distance and the angle of perception acquired before.
711
On the other side, the IR signal also carries a short message that includes information
712
on robot ID, orientation angle, speed and states. The heading of a Cuboid is measured
713
by a motion tracking sensor MPU-9250 (18). This device consists of a 3-Axis gyroscope,
714
a 3-Axis accelerometer, and a 3-Axis magnetometer. Hence, the MPU-9250 is a 9-axis
715
Motion Tracking device that also combines a Digital Motion Processor. With its I2C bus
716
connected with PIC18F25K22, the MPU-9250 can directly provide complete 9-axis
717
Motion Fusion output to the microcontroller. These sensing and local communication
718
devices have not been used in the experiments that have been done in a supervised
719
mode.
720
Experimental platform. The robotic experimental setup consisted of a circular
721
arena of radius 420 mm resting on a 1 × 1 m square flat surface with a camera (Basler
722
piA2400-17gc) mounted on the top (see Fig. 12). The setup was placed in a chamber
723
made by 3 opaque wooden boards and 1 white curtain. 2 LED light panels provide a
724
diffused lighting. A circular cardboard wall of radius R = 420 mm delimited the border
725
of experimental platform. The floor of the experimental platform was made with a rough
726
wooden board that prevented the reflections of light. A computer is connected to the
727
camera to supervise the actions of the robots in the arena, and to perform the necessary
728
image processing to track each robot and compute in real time its position (x, y) and
729
heading angle φ.
730
The loop cycle of the imaging process module is 300 ms, a limit imposed by the