Publisher’s version / Version de l'éditeur:
Canadian Geotechnical Journal, 17, 3, pp. 369-381, 1980-08
READ THESE TERMS AND CONDITIONS CAREFULLY BEFORE USING THIS WEBSITE.
https://nrc-publications.canada.ca/eng/copyright
Vous avez des questions? Nous pouvons vous aider. Pour communiquer directement avec un auteur, consultez la première page de la revue dans laquelle son article a été publié afin de trouver ses coordonnées. Si vous n’arrivez pas à les repérer, communiquez avec nous à PublicationsArchive-ArchivesPublications@nrc-cnrc.gc.ca.
Questions? Contact the NRC Publications Archive team at
PublicationsArchive-ArchivesPublications@nrc-cnrc.gc.ca. If you wish to email the authors directly, please see the first page of the publication for their contact information.
NRC Publications Archive
Archives des publications du CNRC
This publication could be one of several versions: author’s original, accepted manuscript or the publisher’s version. / La version de cette publication peut être l’une des suivantes : la version prépublication de l’auteur, la version acceptée du manuscrit ou la version de l’éditeur.
Access and use of this website and the material on it are subject to the Terms and Conditions set forth at
Comparison of undrained shear strentgh results obtained by different
test methods in soft clays
Eden, W. J.; Law, K. T.
https://publications-cnrc.canada.ca/fra/droits
L’accès à ce site Web et l’utilisation de son contenu sont assujettis aux conditions présentées dans le site LISEZ CES CONDITIONS ATTENTIVEMENT AVANT D’UTILISER CE SITE WEB.
NRC Publications Record / Notice d'Archives des publications de CNRC:
https://nrc-publications.canada.ca/eng/view/object/?id=9ba42a45-4980-49a0-bfea-0149bff8b1c0 https://publications-cnrc.canada.ca/fra/voir/objet/?id=9ba42a45-4980-49a0-bfea-0149bff8b1c0Ser
TH1
National Research
Conseil national
N21d1
+
Council Canada
derecherches
Canada
no.
913
COMPARISON OF UNDRAINED SHEAR STRENGTH RESULTS
OBTAINED
BY
DIFFERENT TEST METHODS
IN
SOFT CLAYS
by W. J. Edm and %.
T.
Law
Reprinted
from
Canadian Geoltschnical Journal Vol. 17, No. 3, August 1980 p. 369-381
DBR Paper No. 9 13
Division of Building Research
This publication is being distributed by the Division of Building Research of the National Research Council of Canada. It should not be reproduced in whole or in part without permission of the original publisher. The Division would be glad to be of assistance in obtaining such permission.
Publications of the Division may be obtained by mailing the ap- propriate remittance (a Bank, Express, or Post Office Money Order, or a cheque, made payable to the Receiver General of Canada, credit NRC) to the National Research Council of Can- ada, Ottawa. KIA 0R6. Stamps are not acceptable.
A list of all publications of the Division is available and may be obtained from the Publications Section, Division of Building Re- search, National Research Council of Canada, Ottawa. KIA 0R6.
Comparison of undrained shear strength results obtained by
different test methods in soft clays1
Geotechnical Section, Division of Building Research, National Research Council of Canada, Ottawa, Ont., Canada K I A OR6
Received August 15, 1979 Accepted April 11, 1980
The Cambridge self-boring pressuremeter and the Norwegian Geotechnical Institute field vane apparatus have been used at three sites of different subsoils. Two of the sites, South Gloucester and National Research Council of Canada grounds, are located in Leda clay in the Ottawa area. The third site features a highly plastic lacustrine clay in northwestern Quebec. At this site tests were conducted beside and under a fill that had undergone 1 m of surface settle- ment. At all three sites, the pressuremeter yields higher strengths than the field vane apparatus. Conventional and special laboratory tests were conducted on large diameter tube or block samples from South Gloucester. It is found that the conventional triaxial compressive strength is intermediate between the pressuremeter and field vane strengths. In accounting for the strength discrepancy, factors such as anisotropy, stress path, and disturbance have been studied in the light of the results of the special tests.
Le pressiomktre autoforeur de Cambridge et le scissomktre de chantier NGI ont CtC mis en oeuvre sur trois sites dans des matCriaux diffkrents. Deux des sites, Gloucester Sud et le terrain du Conseil national des recherches du Canada sont constituCs d'argile Leda, dans la rkgion d'ottawa. Sur le troisikme site, dans le nord ouest du QuCbec, on trouve une argile lacustre forte plasticitC. Sur ce dernier site, des essais paralkles ont CtC rCalisCs B proximitC et sous un remblai qui avait subi 1 m de tassement. Sur les trois sites, le pressiomktre donne des resistances plus Clevks que le scissomktre de chantier.
Des essais de laboratoires conventionels et spCciaux ont CtC rtalisCs sur des khantillons de grand diamktre ou sur des blocs, provenant du site de Gloucester Sud. On a note que la rC- sistance en compression triaxiale conventionnelle est intermediaire aux rCsistances mesurCes au scissomktre et au pressiomktre. Compte tenu de ces diffkrences, des facteurs tels que I'ani- sotropie, le cheminement des contraintes et le remaniement ont CtC CtudiCs B l'aide des rCsultats des essais spCciaux.
Can. Geotech. J., 17, 369-381 (1980) [Traduit par la revue]
Introduction
The use of the pressuremeter as an in situ testing tool has become increasingly popular in recent years because of its potential for obtaining stress-strain relationships and in situ horizontal pressures. To date (1979), pressuremeter tests have been conducted over many parts of the world, both on land and offshore, and in soils ranging from soft sensitive clay to soft rock and frozen soil. For about 20 years the test has been used throughout France for foundation design (Baguelin et al. 1978). With the addition of the self- boring device (Baguelin et al. 1972; Wroth and Hughes 1973), the problem of disturbance prior to testing is greatly reduced, particularly in soft soils. Since then many tests have been carried out in the Scandinavian countries, U.K., U.S.A., and Canada. Based on test results recorded in the literature, there is a general observation that the pressuremeter test gives a strength quite different from those of other tests. Baguelin et al. (1972) report that the 'Presented at the 32nd Canadian Ge~technical Conference, Quebec City, P.Q., Sept. 26-28, 1979.
pressuremeter strength is 50% higher than the in situ vane strength for the Saint-Andre-De-Cubzak clay. Results for a soft Gothenberg clay presented by Wroth and Hughes (1974) show that as the clay approaches the normally consolidated condition with depth the pressuremeter strength is increasingly higher than the vane strength. Pressuremeter tests on a glacial till in the Glasgow district (McKinlay and Anderson 1975) yield strengths about 70% higher than the triaxial strength. A study on two stiff clays by Windle and Wroth (1977) gives contrasting results. Pressuremeter strengths for Gault clay agree closely with those from triaxial and Dutch cone tests whereas for London clay the pressuremeter strength is higher than the triaxial, cone, and plate loading tests.
Thus far the explanation for the discrepancy ob- served was that less disturbance was involved with the pressuremeter, particularly the self-boring type, than with other tests and hence the higher strengths were understandable. It should be noted, however, that other tests, the field vane in particular, already give too high values of undrained strength when applied to well-documented embankment failures.
0008-3674/80/030369-13$01 .W/O
370 CAN. GEOTECH. J. VOL. 17, 1980
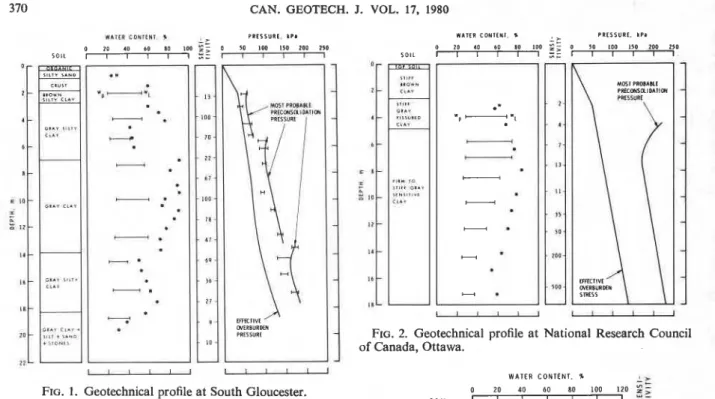
FIG. 1. Geotechnical profile at South Gloucester.
Bjerrum (1972) has suggested a "corrected vane shear strength" depending on the plastic index of the soil. Justification for the correction has been attributed to: (a) effects of rate of loading; (b) anisotropic effects; and (c) progressive failure considerations.
At the three sites noted in this paper, the undrained strength obtained with the Cambridge self-boring pressuremeter was found to be consistently higher than that obtained by the Norwegian Geotechnical Institute (NGI) field vane test. To gain some insight into this discrepancy a systematic study using both field and laboratory methods has been conducted.
Soil Conditions
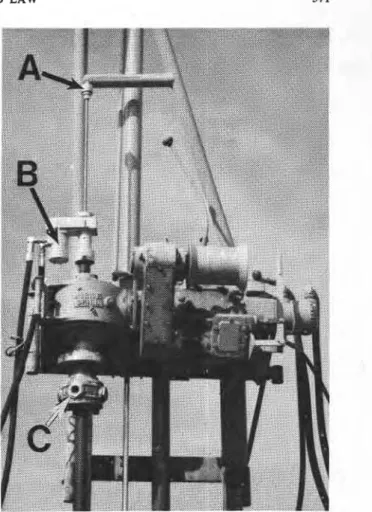
The three sites considered herein are: South Gloucester, an open field within the National Re- search Council of Canada (NRCC) grounds, and Matagami, Quebec. The first two sites are of Leda clay in the Ottawa area; their geotechnical profiles are shown in Figs. 1 and 2. The subsoil at the South Gloucester site is composed mainly of a highly sensitive soft marine deposit formed in various stages of deposition, erosion, and redeposition cycles (Bozo- zuk 1972). It is lightly overconsolidated with an
overconsolidation ratio of about 1.5. The subsoil at
the NRCC site is of similar origin but with a higher strength because of the higher preconsolidation pressure (Eden and Hamilton 1956). The clay there is fissured to a depth of about 7 m, below which the pressuremeter tests described in this paper have been
FIG. 2. Geotechnical profile at National Research Council of Canada, Ottawa.
WATER C O N T E N T . %
::
0 20 4 0 60 80 100 120 z z S O I L 1 I I I I I i 0' +FIG. 3. Soil profile at Matagami, Quebec. (Data from Dascal et a!. 1972.)
-
-
-
-
--
-
-
carried out. The third site features a highly plastic lacustrine deposit of postglacial origin. A test em- bankment was constructed at this site 6 years before the present test series was conducted at 24 m from the toe and under the centre of the embankment, which had undergone 1 m of settlement. The soil profile shown in Fig. 3 is based on the work of Dascal et al. (1972) who investigated an embankment failure at a nearby site.
M U S K E G M E D I U M P L A S T I C C.1c.I C L A Y G I A V C L A Y O F H I G H P L A l l l t l T " G I * " C L A Y S I L T A N D S A N D
EDEN AND LAW 371
Test Description
Norwegian Geotechnical Institute (NGI) Vane Test The NGI vane apparatus is fully described by Andresen and Bjerrum (1956). The outstanding * feature of the apparatus is that the torque rod is com- pletely isolated from the soil so that a soil-rod friction correction is eliminated. Tests at all three sites were conducted at
+
m intervals.The conventional method for interpreting the vane test was used. It assumes a cylindrical failure surface and a uniform distribution of shear strength yielding
the following equation for strength, S,:
3
I
f r
where T is the measured torque; and D is the vane diameter, which is half the vane height.
Cambridge Self-boring Pressuremeter Test
The basic principle and operation of the Cambridge self-boring pressuremeter are described by Wroth and Hughes (1974). From the manufacturer, Cam- bridge Insitu, an 80 mm diameter pressure expansion cell with the lead-in cable and supply tube was ob- tained. The pressure supply panel and electronic readout equipment for the strain gauge systems were also acquired. Initially two X-Y recorders were used to obtain continuous records of total and effective pressure versus strain.
The original cutting shoe on the pressuremeter was replaced with removable hardened tool steel shoes so that the cutting shoe diameter would match the probe diameter with the membrane in place. Law and Eden (1980) have shown that a slight difference in the diameter of membrane and that of the cutting shoe can significantly affect the results obtained.
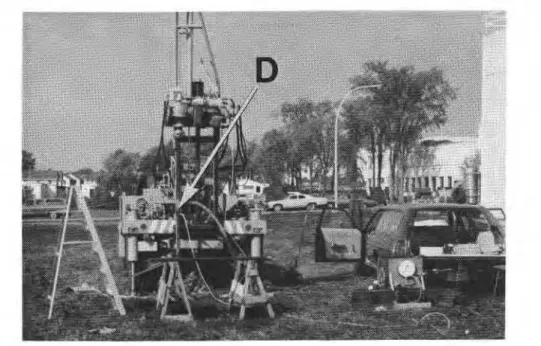
The equipment was adapted to a hydraulic-powered truck-mounted drill rig by the Geotechnical Section of the Division of Building Research. Figures 4 and 5 illustrate the probe adapted to the drill rig. Beginning at the top of the apparatus, Part A is a lightweight water swivel to supply water, by a small piston pump, to the inner rods, which rotate the cutter head. Part B is an auxiliary drive to rotate the inner rods. It con- sists of a hydraulic motor powering a roller chain drive and is mounted on top of the outer EWX casing. Oil supply for the hydraulic motor is supplied from the main hydraulic pump on the drill rig and is metered through a flow divider and on-off control valve. A constant speed of rotation of about 70 rpm was used. Part C is a chuck that holds the EWX casing. The downward advance of the pressuremeter was controlled by the 1.5 m long hydraulic feed cylinders on the drill rig. The rate of advance was
FIG. 4. Details for adapting the probe to the drill rig:
A = water swivel; B = auxiliary drive; and C = chuck for
the EWX casing.
maintained constant by restricting the flow of hy- draulic fluid to the cylinders through a needle valve. Part D (Fig. 5) is a T-connection to which the drainage hose is connected to drain the cuttings and wash water away from the drill hole. When extension rods are added the top section remains in place in the chuck and is raised. The extension sections are added below the T-connection.
The drilling sequence is as follows. A 0.15 m hole is augered to 1.5 m above the test location. The hole is filled with water. The probe is positioned over the hole and the porous stones on the pore pressure sensors are saturated using a hypodermic needle. The probe is immediately lowered in the hole until the pore pressure sensors are submerged and a set of zero readings is taken. The probe is then lowered to the bottom of the augered hole and coupled to the chuck. The inner rods are then positioned in the upper chuck so that the cutter blades are set from 6 to 13 mm above the cutting edge of the shoe. Water is
372 CAN. GEOTECH. J. VOL. 17, 1980
FIG. 5. Probe mounted on the drill rig. D = T-connection for the drainage hose.
supplied to the inner rods and, after flow is estab- monitoring equipment as used in a covered service lished, rotation of the inner rods begins. The probe is truck.
then advanced at about 0.1 m/min. Observations are The procedure used with the programmable calcu-
maintained on the return wash water to make sure no lator for obtaining the shear stress from the pressure- restriction develops. The effective pressure and strain meter test results follows Ladanyi's (1972) method,
sensors are monitored to check against a malfunction. which is in principle identical to those of Baguelin
Efforts are made to maintain a steady rate of advance et al. (1972) and of Palmer (1972).
avoiding a stoppage, which would allow the clay to
grip the membrane. To date no serious difficulties Laboratory Tests
have been encountered in advancing the probe. The laboratory tests on South Gloucester clay
During the first few field trials a great deal of were conducted with two aims: (1) to obtain conven-
difficulty was encountered in maintaining balance on tional triaxial undrained shear strength for compari- the X-Y recorders under field conditions. Because son with the in situ test strengths; and (2) to study
the recorders are so sensitive to external vibrations of factors influencing the measured shear strengths. The
the service vehicle and to small variations of power different test series and sample types are listed in
supply from a portable generator the records ob- Table 1. To achieve the first aim, conventional tri- tained were of questionable value for quantitative axial undrained compression tests (Series 1) were
purposes, but they did provide a continuous record done. The samples were consolidated to pressures
of the progress of the test. approximately equal to the in situ stress conditions
The replacement method was to monitor the three before being subjected to undrained shear at about circuits with the digital voltmeter, then calculate the 2% axial strain per hour. To achieve the second aim,
stress-strain characteristics directly from the readings special tests were carried out on the soft gray silty
I
using a programmable hand calculator as the test clay samples from depths between 3 and 5 m.
progressed. Subsequently a Kaye System 8000 data There were two groups of special tests. The first
1
logger was used to record the three measurements was designed to study undrained strength anisotropy
every minute just prior to the application of pressure and the second to examine the effect of different ,
increments of 9.8 kPa. This rate of pressure applica- stress paths followed in the laboratory and in situ '
tion was also used by Wroth and Hughes (1974) for a tests.
number of soft clays. The data logger yielded a Three methods have been employed here in meas-
printed record of good accuracy, which could be used uring undrained strength anisotropy. The first two
EDEN AND LAW 373
FIG. 6. Monitoring equipment for the probe. TABLE 1. Summary of laboratory test series
Test
series Description
Sample type 1 Conventional triaxial test on vertical A
specimens from various depths
2 Triaxial compression tests on speci- B mens trimmed at various angles
3 Triaxial compression and extension A
tests on vertical specimens
4 Triaxial-vane tests A
5 Conventional triaxial tests along with A controlled stress path plane strain
tests
NOTES: A = 124 mm diameter Osterberg samples; B = block samples.
triaxial-vane apparatus. The first method was to test specimens (Series 2) trimmed at various angles from undisturbed block samples. The specimens were first consolidated to the in situ pressure before the onset of undrained shear. Throughout this test series, an isotropic consolidation pressure equal to the effective overburden pressure was applied as the coefficient of earth pressure at rest, KO, was found close to 1.0 using the hydraulic fracture technique (Bozozuk 1974). By comparing strengths of the specimens at various angles, a measure of anisotropy was obtained. This method has been used by a number of research-
ers (e.g., Duncan and Seed 1966; Lo and Milligan 1967; DeLory and Lai 1971).
The second method compares strengths from tri- axial compression and extension tests on vertical specimens (Series 3). The specimens were again con- solidated to the effective overburden pressure fol- lowed by undrained shear, one via compression and the other extension. The compression test was a standard test of compressing the specimen and the extension test of pulling the specimen. It should be noted that this manner of conducting the extension test is equivalent to maintaining constant vertical pressure and increasing the horizontal pressure (Law and Holtz 1978). This approach has been advocated by Ladd (1965) and Bjerrum (1972).
The third method using the triaxial-vane apparatus was described in detail by Law (1979). Briefly, vane tests were conducted in triaxial specimens (Series 4) consolidated to the desired pressure. Undrained strength anisotropy can be studied by measuring the vane strengths on the vertical and the hori- zontal planes at the in situ effective pressures. These strengths, denoted by Sva and She, respectively, can be deduced by conducting three triaxial-vane tests: ( I ) under an isotropic consolidation pressure equal to the in situ effective horizontal pressure, a< ; (2) un- der an anisotropic consolidation pressure system with oh< in the horizontal direction and u,f' in the
--
374 CAN. GEOTECH. J. VOL. 17. 1980
vertical direction with avf' being a pressure greater V E R T I C A L
than the preconsolidation pressure; and (3) under an
isotropic consolidation pressure equal to cvr'. De-
t
V E R T I C A L S P E C I M E NF O R T R l A X l A L T E S T
noting the torques obtained in these three tests by Ta, Tb, and T,, respectively, it could be shown that
S P E C I M E N F O R
2(Tb
-
3Tc/10a)r21
svo
=xD3(a
-
$)
i V i 2 . 4 O S T E R B E R C m m D I A S A M P L Fand FIG. 7. Specimen arrangement for triaxial and plane strain
I
tests.-
Tb)+
Tc/aat a strain rate and consolidation pressure equal t o
where those in the plane strain test. The soil specimen was
mounted in the plane strain apparatus in such a way
[4] a = (10H
+
3D)/10D that the in situ vertical direction was subject to zeroand D and H~~~ the diameter and height of the vane. strain (intermediate principal stress direction) during
It is appropriate to point out here that the strength shearing. This enables the laboratory simulation of a
anisotropy measured in the different methods will plane strain condition along the vertical direction
not be the same, as there are many operating factors+ during the in sit24 Pressuremeter tests. Furthermore,
The important ones are soil structure, geological the effective stress path during the pressuremeter test
stress history, and stress path leading to failure+ was estimated based on the field test results and
These factors are close[y interrelated and exert vary- in the laboratory plane strain test. This
ing influences in different tests or
in
different soils. requires a control of the stress path during shearingSoil structure that relates to particle orientation or in the laboratory test. Such a has been
fabric may have a dominant effect in the tests on possible with the use of a sophisticated system, which inclined specimens. The stress paths employed in the comprises, besides the plane strain cell, an electric-
compression and extension tests generate different pneumatic transducer and a mini-cOm~uter. The pres-
pore pressures at failure and hence produce unequal sure to the plane strain is regu1ated
undrained strengths ( Land Holtz 1978) even for the electric-pneumatic transducer, which is in turn ~ ~
an isotropic material. The triaxial vane measures the the appro-
strengths on the horizontal and vertical planes that priate in the computer, any desired stress
are generally different from the triaxial tests, The path can be prescribed. Further this system
effect of geological stress history and soil structure be rep0rted (Law 1980).
may therefore play an important role. The purpose examining the stress
for conducting these tests was not to study anise- path plane strain test and triaxial test, factors con-
tropy per se but to obtain an indication of its effect tributing the strength between the
in the strength difference measured in pressuremeter and conventional triaxial tests can be
the various tests. studied.
The second group of special tests (Series 5)
was
conducted on soif specimens using a plane strain cell Test Results and Discussion
(Bozozuk 1972) and a triaxial cell. The plane strain Strength Comparison
cell is similar in principle to the triaxial cell except The results of pressuremeter and vane tests at the
that side blocks are mounted to maintain zero strain NRCC site are shown in Fig. 8. For this firm to stiff
and to measure stress in the intermediate principal Leda clay, the pressuremeter strength exceeds the
stress direction. In order to minimize sample variabil- field vane by about 20-40% (Table 2).
1
,
ity, four specimens, each 80 mm high, were trimmed A typical pressure-strain plot from the pressure-
from a single section of the Osterberg sample shown meter test is shown in Fig. 9a. !
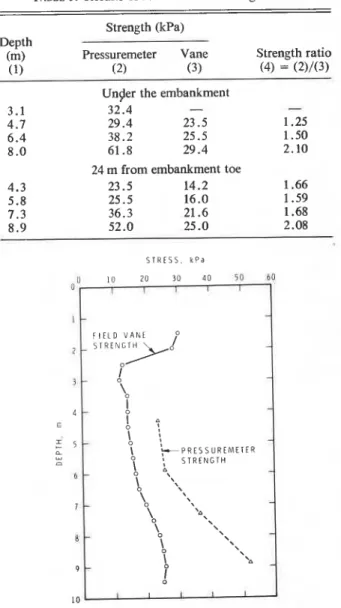
in Fig. 7. Two were horizontal (36.5 mrn by 36.5 mm Figures 10 and 11 show the in situ test results
cross section) for the plane strain tests and the other beside and under the embankment at Matagami site.
two (36.5 mm diameter) were vertical for the triaxial The pressuremeter strengths are again higher than
tests. the vane strength with the former exceeding the latter
The triaxial test was a consolidated undrained test by about 60-1 10% beside the embankment, and I
EDEN AND LAW 375
S T R E S S . k ~ a TABLE 2. Results of in siru tests at National Research Council
a zo 4 0 6 0 so loo 120 of Canada site
a I I I I 1
Strength (kPa)
I
-
Depth(m) Pressuremeter Vane Strength ratio
L
-
(1) (2) (3) (4) = (2)/(3)7 . 3 9 2 . 2 73.5 1.25
7
8 . 8 72.6 61.8 1.17
10.3 78.5 55 .O 1.43
8 - FIELD VANE STRENGTH L
I"
$'-
TABLE 3. Results of in siru tests at Matagami sitep
k.
\
:
PRLSSURCMEIFRLO
-
-
Strength (kPa)Jb i
DepthI
-
(m) Pressuremeter Vane Strength ratioI 1 -
/" (1) (2) (3) (4) = (2)/(3)
12
-
1
- Uncjer the embankment3.1 32.4
-
-
13 I 1 1 I I 4 . 7 29.4 23.5 1.25
6 . 4 38.2 25.5 1.50
FIG. 8. In situ strength profile at National Research Council 8 . 0 61.8 29.4 2.10
of Canada site.
24 m from embankment toe
4 . 3 23.5 14.2 1.66 G o n , , , , , I ' 1 . I ' 1 . 1 .- 5 . 8 25.5 16 .o 1.59 7 . 3 36.3 21.6 1.68 3 5
-
=r 8 . 9 52.0 25 .O 2.08 S T R E S S k P a 111 ( < I 0 10 20 1 30 I 4 0 I 50 I h a-
PbPW I l m- -
I DtFltk 3 l m-
.., 1 - I = 2 0 0 - m F I E L D V A N E rn " u *, - = I50-
1 3 1 3-
-
lDO-
OtlrM L l m - ' 0 I 4-
-
I 0-
Eb
:
E 5 -\o
I
- 0 I , I , I . I , I . 1 . 1 . \o F P R E S S U R E M E T E R 0 4 6 0 2 4 6 S O Z 4 6-
a : S T R E N G T H-
C t R C U M F E R E N r l A L S T R A I N % 6-
\o
\ 4 '\,FIG. 9. Typical pressure-strain curves from pressuremeter
"\
-
tests: ( a ) National Research Council of Canada site; (b) Mata- 7
-
1
' 0gami site; (c) South Gloucester site.
' 0 \ \ - 8 - \ '! , \ \ \
about 25-1 10% under it (Table 3). Figure 9b shows A'
-
9-
a typical pressure-strain curve from a pressuremeter
test at the site. I
LO I _I 1 1
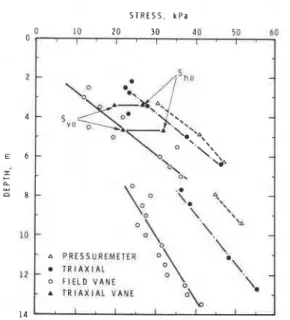
The pressuremeter, field vane, and conventional FIG. 10. I ~ I siru strength profiles beside the embankment
triaxial (Series 1) strengths for South Gloucester clay at Matagami.
are compared in Fig. 12. Throughout the depth
studied, the pressuremeter yields the highest strength, are compared in Table 4. The pressuremeter strength the triaxial ranks second, and the vane gives the is about 17% higher and the field vane strength is lowest strength. The average relative strength values about 35% lower than the triaxial strength and the
CAN. GEOTECH. J. VOL. 17. 1980
S T R E S S , k P a 50
1 I I I I
FIG. 11. In siru strength profile under the embankment at Matagami.
STRESS, k P a
FIG. 12. Strength profiles at South Gloucester site.
pressuremeter strength is 85% in excess of the vane strength.
Figure 9c shows a typical pressure-strain curve from the pressuremeter test at South Gloucester. The shear stress - strain curves from the pressuremeter and the triaxial tests for two depths are shown in Fig. 13. The maximum shear strain, y, is used for both tests for convenience of comparison. This strain
/)---I-
---
I D E P T H = 7 . 9 rn-
,'
-
- I 3 . 4-
I A-
T R l A X 1 A L T E S T- - -
P R E S S U R E M E T E R T E S l h l A X l h l U M S H E A R S T R A I N , %1
FIG. 13. Stress-strain curves from pressuremeter and tri-
axial tests.
I
TABLE 4. Strength comparison at South Gloucester site
Strength ratio
I
Depth Pressuremeter/ Vane/ Pressuremeter/ (m) triaxial triaxial vane
TABLE 5. Results of triaxial compression tests on specimens
trimmed from various angles i, from block samples (Series 2)
Natural
moisture Failure Peak
content strain strength Strength
i (%) (5%) AI (kPa) ratio
y is 1.5 times the axial strain obtained from the un- drained triaxial tests and two times the circumferen-
I
tial strain as measured in the pressuremeter. The pressuremeter test, besides yielding a higher peak strength, gives larger strain to failure and higher post- peak strength than those of the triaxial test. Theseaspects will be discussed in a later section. 1
Strength Anisotropy
The results of tests on inclined specimens are shown in Fig. 14 and summarized in Table 5, which indicates a significant strength anisotropy. The hori- zontal and 60" specimens yield the minimum strength, amount to about 80% of the vertical strength. Part of
EDEN AND LAW 377
S P E C I M E N I N C L I N A T I O N F R O M V E R T I C A L , d e g FIG. 14. Strength variation vs. specimen inclination. TABLE 6. Results of triaxial compression and extension tests
on vertical specimens (Series 3) Natural
moisture Failure Peak
content strain strength
Test type (%I (%) A 1 (kPa)
Compression 64.9 1 . 8 0.38 26.1 Compression 65.3 2.1 0.43 27.5 Extension 65.3 1 .O 1.10 15.5
Extension 65.4 1.3 1.00 15.0
NOTES: ratio of average extension to compression strength = 0.57; ratio of average Ar for extension to Ar for compression = 2.6.
,
this anisotropy is caused by the pore pressure effectas a higher pore pressure parameter, Af, has been
I measured in the inclined specimens.
The triaxial compression and extension tests meas- ured a greater strength anisotropy (Table 6) than the last test series. This is caused by a low strength in the extension test. By comparing Af values, it is clear that such a low strength is largely due to the pore pressure
effect: the Ar for extension is 2.6 times that for com-
pression. This high Ar is in turn caused by the fact that the intermediate principal stress, uz, is equal to the major principal stress, u,, as compared with
0 3 = u1 in the compression test, where a3 is the
minor principal stress. In the pressuremeter test where a plane strain condition prevails (Wroth and
I Hughes 1973), the pore pressure response is in general
lower than in the extension test. The strength anisotropy component caused by the stress path to failure in the pressuremeter test therefore will not be as pronounced as in the extension test.
A significant strength anisotropy has also been
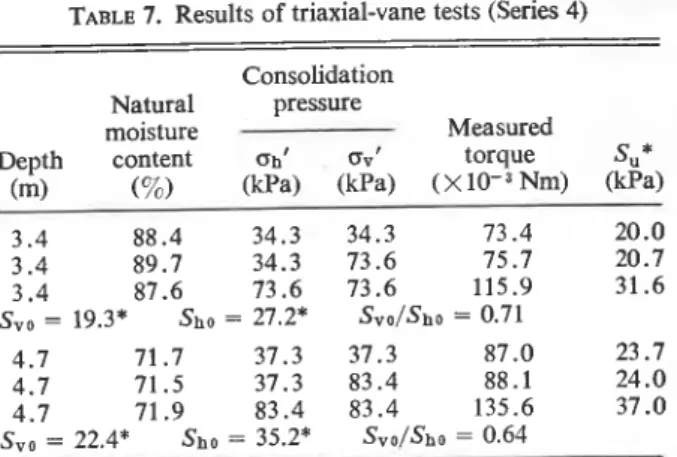
measured in the triaxial-vane tests, the results of which are shown in Table 7. The strength on the
vertical plane, Svo, is smaller than that on the hori-
TABLE 7. Results of triaxial-vane tests (Series 4) Consolidation
Natural pressure
moisture Measured
Depth content at,' avl torque SU * (m) (%) (kPa) (kPa) ( X Nm) (kPa) 3 . 4 88.4 34.3 34.3 73.4 20.0 3 . 4 89.7 34.3 73.6 75.7 20.7 3 . 4 87.6 73.6 73.6 115.9 31.6
Svo = 19.3* Sho = 27.2* Svo/Sho = 0.71
4 . 7 71.7 37.3 37.3 87 .O 23.7 4 . 7 71.5 37.3 83.4 88.1 2 4 . 0 4 . 7 71.9 83.4 83.4 135.6 37 .O
Svo = 22.4* S ~ O = 35.2* Svo/Sho = 0.64
*Su, SVO, and S a o are evaluated using [I], [2], and (31, respectively.
zontal plane, She, with S v o / S h o equal to 0.64 and 0.71
at the two elevations, respectively. These values are intermediate between those measured in the inclined specimens test series and compression and extension test series, showing the varying influence, in the different test types, of factors contributing to aniso- tropy.
Also shown in Table 7 is the value of Su, the vane strength computed using [I]. Su is remarkably close to Svo.
Based upon the foregoing laboratory results, it is clear that, for soils similar to that from South Gloucester, the influence of strength anisotropy should be important. With reference to the maximum strength from vertical compression test or on the horizontal plane, anisotropy may lead to a strength decrease from 20 to 40% depending on the type of shear. In the case of the NGI vane and triaxial-vane tests, the soil resistance mainly comes from the vertical failure surface. The conventional interpreta- tion of the vane test assuming isotropy should there- fore give results very close to the strength on the
vertical plane Svo as is shown in Table 7. Furthermore,
when Svo and ShO are plotted in Fig. 12 they are quite
close to the in situ vane strength and the triaxial com-
pression strength, respectively. This implies that the low field vane strength compared with the triaxial compression strength (Series 1) can be largely ex-
plained by the effect of anisotropy.
In the case of the pressuremeter test, the major
principal stress acts in the horizontal direction. If
anisotropy is the only factor affecting strength. the
pressuremeter should yield a lower strength than the
triaxial compression tests (Series 1). This view,
however, is in contrast to the strength comparison
presented earliw. To explain this apparent contradic-
tion, other factors of equal or geater importance
378 CAN. GEOTECH. J. VOL. 17, 1980 I ' l ' I ' I '
--
- PRESSUREMETER - o LABORATORY PLANE S T R A I N-
a UNDRAINED T R l A X l A L- - - AVERAGE STRENGTH ENVELOPE
-
, /-
<
.
-
-
FIG. 15. Effective stress paths for various tests.
ensuing sections. It is sufficient here to say that A X I A L S T R A I N . %
pressuremeter strength interpretation is subjkct t o
FIG. 16. Shear stress
-
axial strain and volumetric strain -factors that can either overestimate or underestimate strain relationships during the controlled stress path the undrained strength. plane strain test.
Stress Path Eflect
The computed stress path from the pressuremeter test at South Gloucester from depth 3.3 m is shown in Fig. 15. Also shown are the effective stress paths of the plane strain tests on the horizontal specimen and the triaxial test on the vertical specimen (Series 5). In this figure, q is plotted against p' where q = (ul - u3)/2 and p' = (cl'
+
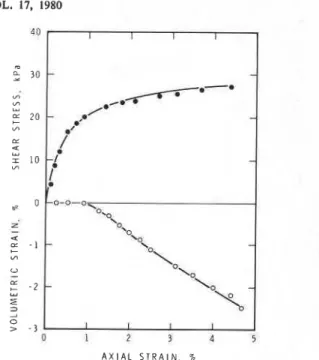
u3')/2. ull and u3' are the effective major and minor principal stresses and in the pressuremeter test they are equal to the effective radial and circumferential stresses, a,' and ui, re- spectively. The effective stress path observed in the field is basically reproduced in the laboratory plane strain test.There is a striking difference between the effective stress paths in the triaxial and the plane strain tests. After reaching the maximum q value, the triaxial stress path bends towards the origin, resulting in a reduction of both p' and q values. On the other hand, the plane strain stress path, after rising almost verti- cally, bends to the right. It then describes a shape roughly conforming to the average peak strength envelope derived from the conventional triaxial compression test. Finally, it dips off the envelope after reaching a certain point. The fact that a section of this path is higher than the strength envelope may be partly because of sample variability at that particu- lar depth and partly because of the plane strain mode of shearing.
One important consequence arises from the ob-
served plane strain stress path: as p' continues to increase along the strength envelope, q increases accordingly and a higher strength will be attained. In addition, there is another phenomenon associated with this increasing p', which is shown in Fig. 16 on which the shear stress and volumetric strain versus axial strain are plotted. Along the initial part of shearing, hardly any volume change can be detected, implying the undrained condition assumed in the pressuremeter test is valid at this stage. Upon further straining to higher q values (and hence higher p' values) there is a gradual decrease in the specimen volume. Significant consolidation is therefore taking place at this stage and the undrained condition is no longer satisfied. As a result, the pressuremeter test, conducted along the observed stress path, corre- sponds to a partially drained test, yielding a strength substantially larger than the undrained value. For South Gloucester clay, this partially drained strength exceeds the triaxial undrained strength by 19% (Table 8). Furthermore, this partial drainage leading to shear at higher p' values also results in a greater strain to failure and gives rise to higher strength at large strain (postpeak), both being mentioned in an earlier section.
Typical effective stress paths during pressuremeter tests at NRCC and Matagami sites are shown in Fig. 17. They are essentially of the same shape as that of the South Gloucester clay, again indicating
EDEN AND LAW 2 so NRCC SITE g 6 0 [
-
TwzPrH1
b" .I, 40 b-
I1----
M A T A G A M I S I T E " 20-
5 . 8 m D E P T H-
n I I I 1 h I p ' = l a ' + 0 ' 1 / 2. k P a r BFIG. 17. Effective stress paths as measured from pressure- meter tests.
TABLE 8. Results of plane strain and triaxial tests (Series 5)
Natural moisture
content
Test type (%)
Controlled stress path plane 67.8
strain test on horizontal 70.6
specimen
Undrained triaxial corn- 70.2
pression test on vertical 69.2
specimen Failure Peak strain strength (54) (kpa) 4.5 29.0 4.7 28 .O
NOTE: ratio of average plane strain to triaxial strength = 1.19.
that the measured pressuremeter strengths occur in a I pressure range higher than that in an undrained test.
Disturbance
Disturbance may be caused by physical disruption of the soil structure and by stress change. It cannot be completely eliminated in any existing laboratory or field test.
In laboratory tests, disturbance is introduced through sampling and trimming of specimens. In this study, physical disruption of the soil structure has been reduced as large diameter or block samples have been used. Stress changes due to sampling are removed by reconsolidating the specimens to in situ pressures prior to shearing. It is believed therefore that the laboratory tests measured realistic strengths
I corresponding to the stress path and strain rate used
in the tests.
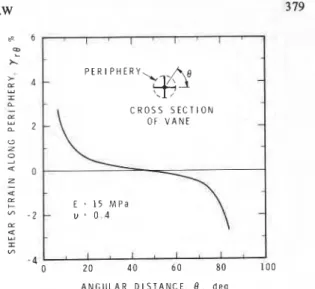
Inserting the vane into soil will also create disturb-
! ance. The vane blades tend to split the soil at the tips, but this tendency is restrained partly or wholly by the confinement of the surrounding soil, hence im- posing a stress change. This process is difficult to analyze precisely. It can be studied, at least quali- tatively, by means of the finite element method
I ' I ' I ' I X P E R I P H E R Y
-
- C R O S S S E C T I O N O F V A N E-
E = 15 MPa - u = 0 . 4 1 1 1 1 1 1 1 1 A N G U L A R D I S T A N C E , 8 , d e gFIG. 18. Shear strain induced along periphery due to vane insertion.
assuming elastic soil behaviour. When applied to the field vane, this method will indicate the induced stress and strain due to vane insertion. Of particular interest is the shear strain along the periphery of the prospec- tive failure surface circumscribed by the vane. The distribution of this strain along a quadrant of the periphery is shown in Fig. 18. It is asymmetrical about and changes sign at the 45" line. The magni- tude and direction of the induced shear there will also follow the same pattern. During shearing, however, the vane is turned in only one direction, which is the same as the induced shear on some part of the failure surface but opposite on the other part. This will then give rise t o failure under both the passive and the active modes, yieiding a strength intermediate be- tween values corresponding to the two different modes of failure. This strength i s therefore smaller than the triaxiaI compression strength that is associ- ated with the active failure mode. How much smaller depends, of course, on the characteristics of the soil. Soil disturbance plays a different role in the inter- pretation of the pressuremeter tests. Instead of re- ducing the measured strength, it increases the strength. Based on the theories of Bapelin el al.
(1975) and PrCvost (1979), the apparent undrained pressuremeter strength may be double the undis- turbed strength. This peculiarity is derived from the method of interpretation, which assumes uniform soil surrounding the pressuremeter without regard t o the soil softening process due to disturbance.
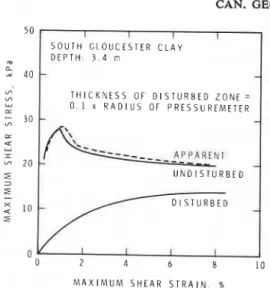
For the pTesent test series, it is possible to evaluate the effect of such disturbance using the method of Baguelin et al. (1975). Briefly, this method yields the apparent stress-strain relationship when the size of the disturbed zone and the stress-strain character-
380 CAN. GEOTECH. J. VOL. 17, 1980
T H I C K N E S S O F D I S T U R B E D Z O N E =
w 0 . 1 x R A D I U S O F P R E S S U R E M E T E R
I
0 2 4 6 8 10
M A X I M U M S H E A R S T R A I N , %
FIG. 19. Theoretical apparent stress-strain curve from a
pressuremeter test conducted in an annulus of disturbed soil.
istics in the disturbed and the undisturbed zones are known. With the pressuremeter test setup described earlier, it is unlikely that the thickness of the dis- turbed zone will exceed 10% of the radius of the pressuremeter. The undisturbed stress-strain charac- teristics may be obtained from the triaxial tests. The disturbed stress-strain relationship is an unknown, but different probable assumptions can be made. Based on these considerations, the apparent stress- strain relationship for South Gloucester clay at 3.4 m depth is shown in Fig. 19 along with the triaxial undisturbed and the assumed disturbed stress-strain characteristics. It is clear that disturbance in this case leads to an insignificant strength overestimation of only about 2y0.
Other disturbed stress-strain functions have also been assumed with the disturbed strength values ranging from one quarter of the undisturbed peak strength to that of the undisturbed postpeak strength. The results show little influence in the apparent strength at this size (10% of the pressuremeter radius) of disturbed zone. Hence, it can be remarked that the present setup of conducting pressuremeter tests in soft clays will incur negligible effect from soil struc- tural disruption.
Rate Efect
The time to reach failure in the pressuremeter tests and the conventional triaxial test was nearly the same, about half an hour. Rate effect should not be impor- tant therefore in comparing strengths d&ved from these tests, In the case of the field vane test, however, the
soil
failed in a few minutes, which is about one order of magnitude less than the time in the other two tests. This higher rate of shearing may increase the soil resistance by roughly 10% based on existingexperience (Bjerrum 1972; Law 1974). This increase is insufficient to compensate for the decrease caused by anisotropy and disturbance, hence resulting in a vane strength being smaller than the triaxial strength.
Summary and Conclusions
The Cambridge self-boring pressuremeter and the NGI field vane were used to measure the in situ stength at three sites of different subsoils. Two of the sites are located in Leda clay in the Ottawa area. The one at South Gloucester comprises a soft clay and the other on the National Research Council of Canada grounds consists of a firm clay. The third site involves a highly plastic lacustrine clay at Matagami in northwestern Quebec. At all the sites, the pressure- meter strength exceeds the vane strength by an amount ranging from about 20% for the firm Leda clay to about 100% for the two soft clays.
Conventional triaxial compression tests were per- formed on South Gloucester clay. The results show that the triaxial undrained strength is intermediate between the two measured in situ strengths.
Special tests were conducted also on South Glou- cester clay to study factors contributing to the strength discrepancy observed between the measured in situ and laboratory triaxial strengths. The analysis of results led to the following:
I . Field Vane Strength
Strength anisotropy and disturbance are two fac- tors that cause strength reduction measured by the vane. The clay is anisotropic with strength on a vertical plane or from a horizontal specimen being 20-35yo lower than on, a horizontal plane or from a vertical specimen. This anisotropy substantially ac- counts for the low strength compared with the triaxial strength. Vane insertion into the soil partially disrupts the soil structure and creates a stress change, both tending to reduce the available strength.
Rate effect, on the other hand, increases the vane strength but such an increase is outweighed by the strength decrease due to anisotropy and disturbance.
2. Pressuremeter Strength
As the maximum shear stress acts on a vertical plane in the pressuremeter test, strength anisotropy in this clay is therefore expected to lead to a strength decrease of 20-30% compared with the triaxial strength. To the contrary, the pressuremeter strength was found to be about 20% higher instead. This anomaly has been explained in two ways. Firstly, soil disturbance around the pressuremeter gives rise to a higher apparent strength, but this effect is minimal in the present test series. Secondly, the effective stress path during a pressuremeter test is markedly different
EDEN A N D LAW 38 1
from that of an undrained triaxial test. It swings upward along the strength envelope instead of down- ward in the triaxial test. As a result, higher resistance associated with higher effective confining pressure is reached. This upward swing of the effective stress constitutes the main reason for the observed high strength. A laboratory simulation using sophisticated apparatus confirmed the possibility of such a stress path. Furthermore, the simulation yields evidence of pore pressure dissipation in the pressuremeter test. The use of this test for obtaining so-called undrained strength at the present rate (9.8 kPa/min) is there- fore questionable.
The results of the various tests reported emphasize
the point made by Kenney (1968) that "undrained
strength" is a measure of behaviour and not a soil
The behaviour is influenced by test method,
including the associated disturbance, the stress path followed, the rate of stress application, and the anisotropic conditions prevailing in the clay deposit. It is evident that no one test method can be expected to completely describe undrained strength behaviour.
Acknowledgements
The tests at Matagami were made possible thrpugh the cooperation and assistance of The Socittt d7Ener- gie de la Baie James. The conscientious efforts of A. Laberge and T. J. Hoogeveen, Technical Officers, in conducting the tests under sometimes difficult circumstances are gratefully acknowledged. This paper is a contribution from the Division of Building Research, National Research Council of Canada, and is published with the approval of the Director of the Division.
ANDRESEN, A., and BJERRUM, L. 1956. Vane testing in Norway. Symposium on Vane Shear Testing of Soils, ASTM (Ameri- cain Society for Testing and Materials) Special Technical Publication No. 193, pp. 54-60.
BAGUELIN, F., FRANK, R., and JEZEQUEL, J. F. 1975. Quelques rksultants theoriques sur l'essai d'expansion dans les sols et sur le frottement latkral des pieux. Bulletin de Liaison de Laboratoires des Ponts et ChaussCes, 78Cjuillet-a6ut), pp. 131-136.
BAGUELIN, F., JEZEQUEL, J. F., L E M ~ E , E., and LE MEHAUTE, A. 1972. Expansion of cylindrical probes in cohesive soil. ASCE Journal of the Soil Mechanics and Foundations Division, 98(SMll), pp. 1129-1142.
I BAGUELIN, F., JEZEQUEL, J. F., and SHIELDS, D. H. 1978. The pressuremeter and foundation engineering. Trans. Tech Publications, Caustha!, Germany.
1 BJERRUM, ASCE Specialty Conference on Performance of Earth and L. 1972. Embankments on soft ground. Proceedings,
Earth-supported Structures, Purdue University, Lafayette, IN, Vol. 2, pp. 1-54.
B o z o z u ~ , M. 1972. The Gloucester test fill. Ph.D. thesis, Purdue University, Lafayette, IN.
1974. Minor principal stress measurements in marine clay with hydraulic fracture tests. Proceedings, ASCE Specialty Conference on Subsurface Exploration for Under-
ground Excavation and Heavy Construction, Henniker, NH, pp. 333-349.
DASCAL, P . , TOURNIER: J. P., TAVENAS, F., and LA ROCHELLE, P. 1972. Failure of a test embankment on sensitive clay. Proceedings, ASCE Specialty Conference on Performance of Earth and Earth-supported Structures: Lafayette, IN, Vol. 1, Part 1; pp. 129-158.
DELORY, F. A., and LAI, H. W. 1971. Variation in undrained shearing strength by semiconfined tests. Canadian Geo- technical Journal, 8, pp. 538-545.
DUNCAN: J. M., and SEED, H. B. 1966. Strength variation along failure surfaces in clay. ASCE Journal of the Soil Mech- anics and Foundations Division, 92(SM6), pp. 81-104. EDEN, W. J.: and HAMILTON. J. J. 1956. The use of a field vane
apparatus in sensitive clay. Symposium on Vane Shear Testing of Soils, ASTM (American Society for Testing and Materials) Special Technical Publication No. 193, pp. 41-53. KENNEY: T. C. 1968. A review of recent research on strength
and consolidation of soft sensitive clays. Canadian Geo- technical Journal, 5, pp. 97-119.
LADANYI, B. 1972. In situ determination of undrained stress- strain behavior of sensitive clays with the pressuremeter. Canadian Geotechnical Journal, 9, pp. 31 3-31 9.
LADD, C. C. 1965. Stress-strain behaviour of anisotropically consolidated clays during undrained shear. Proceedings, 6th International Conference on Soil Mechanics and Founda- tion Engineering, Montreal, P.Q., Vol. 1, pp. 282-286. LAW, K. T. 1974. Analysis of embankments on sensitive clays.
Ph.D. thesis, The University of Western Ontario, London, Ont.
1979. Triaxial-vane tests on a soft marine clay. Cana- dian Geotechnical Journal, 16, pp. 11-18.
-- 1980. A servo system for controlled stress path tests. ASTM Symposium on Shear Strength of Soil, Chicago, IL, June.
LAW, K. T., and EDEN, W. J. 1980. Influence of cutting shoe size in self-boring pressuremeter tests in sensitive clays. Canadian Geotechnical Journal, 17, pp. 165-173. LAW, K. T., and HOLTZ, R. D. 1978. A note on Skempton's A
parameter with rotation of principal stresses. Geotechnique, 28(1), pp. 57-64.
Lo, K. Y., and MILLIGAN, V. 1967. Shear strength properties of two stratified clays. ASCE Journal of the Soil Mechanics and Foundations Division, 93(SMl), pp. 1-15.
MCKINLAY, D. G., and ANDERSON, W. F. 1975. Determination of the modulus of deformation of a till using a pressure- meter. Ground Engineering, 8(6), pp. 51-54.
PALMER, A. C. 1972. Undrained plane-strain expansion of a
cylindrical cavity in clay: a simple interpretation of the prmsurerneter test. Ghtechnique, 22131, pp. 451457.
PR~VOST. J. H. 1979. Undrained shear test on clays. ASCE
Journal of the Geotechnical Engineering Division, 105(GT1),
pp. 49-64.
WINDLE, D., and WROTH, C. P. 1977. In situ measurement of the properties of stiff clays. Proceedings, 9th International Conference on Soil Mechanics and Foundation Engineering, Tokyo, Vol. 1, pp. 347-352.
WROTH, C. P., and HUGHES, J. M. 0 . 1973. An instrument for the in situ measurement of the properties of soft clays. Pro- ceedings, 8th International Conference on Soil Mechanics and Foundation Engineering, Moscow, Vol. 1, Part 2, pp. 487-494.
-- 1974. The development of a special instrument for the in situ measurement of the strength and stiffness of soils. Proceedings, ASCE Specialty Conference on Subsurface Exploration for Underground Excavation and Heavy Con- struction, Henniker, NH, pp. 295-311.