HAL Id: hal-02871773
https://hal.archives-ouvertes.fr/hal-02871773
Submitted on 18 Nov 2020
HAL is a multi-disciplinary open access
archive for the deposit and dissemination of
sci-entific research documents, whether they are
pub-lished or not. The documents may come from
teaching and research institutions in France or
abroad, or from public or private research centers.
L’archive ouverte pluridisciplinaire HAL, est
destinée au dépôt et à la diffusion de documents
scientifiques de niveau recherche, publiés ou non,
émanant des établissements d’enseignement et de
recherche français ou étrangers, des laboratoires
publics ou privés.
Fermi surface investigation of the noncentrosymmetric
superconductor α -PdBi
J. Klotz, T. Butcher, T. Förster, J. Hornung, Ilya Sheikin, P. Wisniewski, A.
Jesche, J. Wosnitza, D. Kaczorowski
To cite this version:
J. Klotz, T. Butcher, T. Förster, J. Hornung, Ilya Sheikin, et al.. Fermi surface investigation of the
non-centrosymmetric superconductor α -PdBi. Physical Review B: Condensed Matter (1978-1997),
Amer-ican Physical Society, 2020, 101 (23), pp.235139. �10.1103/PhysRevB.101.235139�. �hal-02871773�
J. Klotz,1 T. A. Butcher,1, 2, ∗ T. F¨orster,1 J. Hornung,1, 2 I. Sheikin,3
P. Wisniewski,4 A. Jesche,5 J. Wosnitza,1, 2 and D. Kaczorowski4
1
Hochfeld-Magnetlabor Dresden (HLD-EMFL) and W¨urzburg-Dresden Cluster of Excellence ct.qmat,
Helmholtz-Zentrum Dresden-Rossendorf, 01328 Dresden, Germany
2
Institut f¨ur Festk¨orper- und Materialphysik, Technische Universit¨at Dresden, 01062 Dresden, Germany
3
Laboratoire National des Champs Magn´etiques Intenses (LNCMI-EMFL), CNRS, UGA, 38042 Grenoble, France
4
Institute of Low Temperature and Structure Research, Polish Academy of Sciences, 50-950 Wroc law, Poland
5
Experimentalphysik VI, Center for Electronic Correlations and Magnetism, Augsburg University, 86159 Augsburg, Germany (Dated: June 4, 2020)
The noncentrosymmetric superconductor α-PdBi is a candidate material for the realization of topological superconductivity. Here, we present a detailed de Haas–van Alphen (dHvA) study together with band-structure calculations within the framework of density functional theory. The
rich dHvA spectra are a manifestation of the 13 bands that cross the Fermi energy, EF. We
find excellent agreement between calculated and experimentally observed dHvA frequencies with
moderately enhanced effective masses. One of the bands crossing EF, the so-called α band, exhibits
topological character with Weyl nodes lying 43 meV below EF.
INTRODUCTION
Since several years, noncentrosymmetric (NCS) super-conductors have attracted enormous research interest due to their unconventional physical properties [1, 2]. The absence of an inversion center in the crystal lattice im-plies the occurrence of an intrinsic electric-field gradient that gives rise to a Rashba-type antisymmetric spin-orbit coupling (SOC) [2, 3]. This effect lifts the spin degener-acy of electronic bands and a parity-mixed superconduc-tivity may develop in consequence [4, 5]. Most remark-ably, it has recently been noticed that NCS superconduc-tors with strong antisymmetric SOC provide an excellent platform for the realization of topological superconduc-tivity (TSC) [6–8]. Such a material is a fully gapped bulk superconductor with topologically protected gapless states at the Fermi level [7, 8]. In such a system, Majo-rana surface states with a nontrivial bulk Bogoliubov– de Gennes quasiparticle wave function can arise, which possesses helical spin polarization locked to momentum. These are highly promising for the practical achievement of decoherence-robust qubits with the potential for ap-plication in quantum computing [9–12].
Amidst various candidates for TSC, the NCS com-pound α-PdBi is of unique interest. It crystallizes in an orthorhombic lattice and undergoes a structural
transi-tion upon cooling below 210◦C to a monoclinic structure
of its own type (space group P 21, No. 4) [13] and
ex-hibits bulk type-II weak-coupling clean-limit
supercon-ductivity below Tc = 3.7 K [14–20]. Strong SOC has
been clearly evidenced experimentally by means of angle-and spin-resolved photoemission spectroscopy (ARPES) [21–24] as well as scanning tunneling spectroscopy (STS) [24, 25]. Furthermore, both experimental techniques re-vealed the presence of a surface Dirac state located at about 700 meV below the Fermi level and this has been
supported by first-principle band-structure calculations [21–25]. While the absence of topologically nontrivial surface state in the immediate vicinity of the chemical potential rules out the possibility of TSC in parent α-PdBi with high likelihood, such effects might arise in this material upon tuning the Fermi level near the Dirac sur-face state. Proper electrical gating or sursur-face engineering provide the means to achieve this [21].
In order to contrive an efficient route towards realiza-tion of TSC in α-PdBi, an in-depth investigarealiza-tion of its electronic structure is compulsory. Most recently, the Fermi surface of the compound has been characterized by means of de Haas–van Alphen (dHvA) oscillations [26]. These experiments revealed the presence of sev-eral Fermi-surface pockets, as did the spectroscopic mea-surements [21]. Most strikingly, one of the bands was found to bear signatures of a topologically nontrivial bulk state, which evaded detection in both ARPES and STS. This important finding may imply a nontrivial character of the superconducting order parameter associated with that particular Fermi-surface sheet, which in itself hints at TSC in the compound [27].
Motivated by the results reported in Ref. 26, we ex-plored the multi-sheet Fermi surface (FS) of α-PdBi in more detail using the same experimental technique, namely dHvA quantum-oscillation measurements per-formed at temperatures as low as 40 mK for various di-rections of the applied magnetic field. We were able to resolve very rich dHvA spectra for all field orientations. These contain numerous extremal orbits that are well reflected by our density-functional-theory (DFT) FS cal-culations. The experimentally determined band-resolved mass enhancement is moderate, which corresponds to the
reported Tc of 3.7 K. One of the calculated bands shows
nontrivial topology with Weyl nodes 43 meV below the
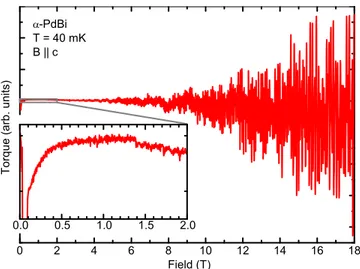
ex-2 0 2 4 6 8 10 12 14 16 18 T o r q u e ( a r b . u n i t s) Field (T) -PdBi T = 40 mK B || c 0.0 0.5 1.0 1.5 2.0
FIG. 1. Field-dependent torque signal of α-PdBi measured at 40 mK and the applied magnetic field B k c. Inset: Zoom into the low-field region of the main panel.
perimental and calculated results in more detail.
EXPERIMENTAL DETAILS
Ultrahigh-quality single crystals of PdBi used in the present study were selected from the same batch as those studied in Ref. 21. These were grown by a mod-ified Bridgman method and characterized by means of x-ray diffraction, energy-dispersive x-ray spectroscopy, magnetic susceptibility, electrical resistivity, and heat-capacity measurements, as described before [21].
Angle-dependent quantum-oscillation measurements were performed using capacitive torque magnetometry,
employing 50 µm thick CuBe cantilevers. These
ex-periments were conducted in a superconducting magnet system equipped with a top-loading dilution refrigerator reaching 18 T and 40 mK, respectively.
dHvA RESULTS
Figure 1 shows a typical torque signal for α-PdBi mea-sured at 40 mK with the magnetic field, B, applied par-allel to c. Note that throughout this paper, we use the
P 1121 convention of the space group P 21 (# 4), i.e.,
the screw axis is parallel to c. This is consistent with the definition used by Yaresko et al. [28], but different from the convention used by Khan et al. [26]. The in-set of Fig. 1 shows the data below 2 T in enlarged scale. A pronounced peak effect emerges near the supercon-ducting upper critical field, which was estimated to be approximately 75 mT from specific-heat and STS mea-surements [19, 25]. Quantum oscillations become visible above about 1.5 T and greatly increase in amplitude to-wards higher fields [29].
0.0 0.1 0.2 0.3 0.4 0.5 0.6 0.7 0.8 0.9 1.0 -PdBi T = 40 mK B || c A m p l i t u d e ( a r b . u n i t s) Field range: 2 - 5 T Field range: 7 - 14 T 0 1 2 3 4 5 6 dHvA frequency (kT) Field range: 8 - 18 T
FIG. 2. dHvA frequency spectra obtained from the torque data shown in Fig. 1 for different field ranges. Note the dif-ferent scaling of the frequency axes between the top and the two bottom panels.
Figure 2 shows the corresponding dHvA frequency spectra, obtained by subtracting a third-order polyno-mial from the torque data and subsequently performing a Fourier transformation of the resulting data within the field range specified in the different panels of Fig. 2. Even in the lowest field range (2-5 T), clear dHvA frequency peaks are resolved. Towards higher magnetic fields, fur-ther peaks appear, reflecting the presence of several ad-ditional extremal orbits of FS sheets. The large number of dHvA frequencies evidence the existence of a rather evolved FS topology originating from many bands, as confirmed by our band-structure calculations below.
Figure 3 shows the temperature dependence of the dHvA oscillation amplitudes obtained for B k c between 3 and 6 T. The amplitudes clearly decrease with increas-ing temperature. As described by the Lifshitz–Kosevich formula, this reduction in amplitudes is proportional to
x/sinh x, where x = αT m∗/B, with the effective
cy-clotron mass m∗ and α = 2π2k
Bme/(e~) = 14.69 T/K
[30]. Here, we used the Boltzmann constant kB, the
elec-tron charge e, and the reduced Planck constant ~. m∗
represents the effective mass given in multiples of the free
electron mass, me. By fitting this formula to the
temper-ature dependence of the amplitudes, we obtain m∗as a fit
parameter, with B the average in inverse fields. Since the dHvA amplitude reduction of low-mass extremal orbits at higher field ranges is too small for a reasonable
extrac-tion of m∗, we used adapted field ranges for the analysis
of m∗: 2-5 T, 3-6 T, 7-14 T, and 8-18 T. Within error
bars, the effective masses of all extremal orbits investi-gated are not field dependent. Altogether, the effective
masses are low, ranging from 0.20(3) to 2.0(1) me. An
0.0 0.2 0.4 0.6 0.8 1.0 1.2 0.0 0.2 0.4 0.6 0.8 1.0 F = 3.78 kT m* = 0.87 m e F = 0.80 kT m* = 1.1 m e F = 2.39 kT m* = 0.7 m e F = 89 T m* = 0.7 m e A m p l i t u d e ( a r b . u n i t s) Temperature (K) -PdBi B || c Field range: 3 - 6 T F = 39 T m* = 0.2 m e
FIG. 3. Effective masses determined by fits of the Lifshitz– Kosevich formula (lines) to the temperature-dependent dHvA oscillation amplitudes (symbols).
given in Table I, together with calculated band masses. Next, we measured the angular dependence of the dHvA frequencies, rotating from B k c to B k [110] and from B k c to B k [110] × [001] (i.e., the axis which is perpendicular both to [110] and [001]). All angles are measured rotating away from the crystallographic c axis. After carefully analyzing the frequency spectra for differ-ent field ranges and removing higher harmonics of fun-damental dHvA frequencies, we obtain the angular de-pendence indicated by symbols in Fig. 4. The frequency branches α and δ reported in Ref. [26] are in excellent agreement with branches appearing in our experiments between B k c and B k [110]. In addition, we also
ob-serve most of the frequency peaks reported for Θ = 70◦
in Ref. [26]. Small deviations may arise due to the un-known in-plane angle in Ref. [26]. Besides these previ-ously known dHvA orbits, several additional dHvA fre-quency branches occur in our experiments. Four of these appear at all angles and several more were only resolv-able for a limited angular range. Due to the abundance of frequencies, different branches could only be assigned with the help of FS calculations, which we discuss below.
FERMI-SURFACE CALCULATIONS
In order to determine the FSs that account for the ex-perimentally detected dHvA frequencies, we conducted DFT calculations for α-PdBi using the fplo code (ver-sion 15.02-50) [31] with a fully relativistic formalism [32]. We chose the local density approximation of Perdew and
Wang for the exchange-correlation potential [33]. As
shown by Yaresko et al., the correct determination of the band structure requires the primitive unit cell [28]. The structural parameters were set to the room-temperature data reported by Ionov et al. [28, 34]. Altogether, there
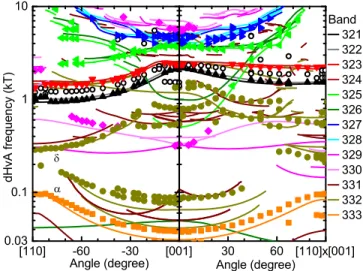
[001] 30 60 [110]x[001] Band 321 322 323 324 325 326 327 328 329 330 331 332 333 Angle (degree) [110] -60 -30 0.03 0.1 1 10 d H v A f r e q u e n c y ( k T ) Angle (degree)
FIG. 4. Angular dependence of the experimentally observed dHvA frequencies (symbols) and of the calculated extremal Fermi-surface cross-sections (lines) in α-PdBi. The line col-ors correspond to the band and FS colcol-ors shown in Fig. 5. Empty symbols denote frequencies which could not clearly be assigned to a calculated frequency branch. Since spin-split bands in α-PdBi produce similar Fermi-surface sheets and, hence, similar dHvA frequencies, we assigned and color-coordinated the experimental data only to the pair of bands. α and δ label the frequency branches which were also observed by Khan et al. [26].
are eight inequivalent atomic sites in α-PdBi. This, cou-pled with the low crystal symmetry brings about compu-tationally intensive calculations. While a comparatively fine 24 × 24 × 24 k mesh could be used for calculating the self-consistent density, we were restricted to an only 4 times denser grid to compute the FSs [35].
Figure 5(a) shows the calculated band structure of α-PdBi. We find a total of 13 bands crossing the Fermi energy, consistent with the results reported in Ref. [26]. The non-centrosymmetric crystal structure leads to a fi-nite spin-orbit coupling (SOC), which removes the spin degeneracy of the bands except for some symmetry lines in the Brillouin zone (BZ). On the one hand, the energy scale of the splitting is fairly small compared to the en-ergy scale of the band widths, leading to pairwise similar bands 321 and 322, 323 and 324, etc. On the other hand, due to the high nuclear charge of the Bi atoms, SOC is comparatively strong, amounting to up to about 0.2 eV, depending on the location in the BZ and the bands. Hence, most of the FS sheets corresponding to spin-split bands are very much alike, as shown in Fig. 5(c). How-ever, the energy splitting greatly changes the FS shapes of bands which are close to the Fermi energy in extended regions of the BZ. For example, band 331 crosses the Fermi energy multiple times along Γ-Y -C, whilst band 332 does not cross it at all along these lines. Thus, the FSs of the bands 331 and 332 differ significantly: Band 331 possesses two additional tiny FS pockets, whereas a
4 other (b) 321 (c) 324 323 326 325 330 329 332 331 328 327
FIG. 5. (a) Calculated band structure of α-PdBi along lines of the Brillouin zone indicated in the sketch. Along the symmetry
lines E-M1-A and M -D-Z, SOC is zero, leading to degeneracy of the bands 321/322, 323/324, etc. Note that band 333 crosses
the Fermi energy only outside the lines shown here. A detailed investigation of the Fermi-energy crossing of bands 331 to 333 is shown in Fig. 6. (b) Corresponding density of states. The shaded areas mark contributions of different atomic orbitals. (c) Calculated FSs. The colors correspond to those of the conduction bands in (a).
larger part of the FS sheet of band 332 around the X point is completely separated. Similarly, band 326 pro-duces an additional small pocket compared to band 325. Band 333 only dips below the Fermi energy in a small region outside of the lines shown in Fig. 5(a), while band 334 remains entirely above the Fermi level. The crossings of bands 332 and 333 will be discussed further below.
The calculated density of states (DOS) is shown in
Fig. 5(b). The DOS at the Fermi level is D(EF) = 1.1
states/(eV formula unit). Using γcalc = π2k2BD(EF)/3,
we determine a Sommerfeld coefficient of γcalc = 2.6
mJ/(mol K2). An effective-mass enhancement due to
many-body effects is implied by the discrepancy between
the experimental value of γ = 4 mJ/(mol K2) [14] and
the theoretical obtained one. From λγ = γ/γcalc− 1, we
obtain a moderate mass enhancement of λγ = 0.5. This
includes the averaged mass enhancement due to electron-phonon and electron-electron interactions.
Every fundamental dHvA frequency F is related to an extremal cross-section S of a FS sheet according to the Onsager relation: F = ~S/(2πe) [30]. Thus, we are able to calculate theoretical dHvA frequencies from the FS sheets we obtained [Fig. 5(c)]. Figure 4 shows the com-parison between the experimental and theoretical dHvA frequencies. The similarity of the spin-split bands mani-fests itself in their FS sheets and corresponding extremal cross sections in turn. Therefore, we assigned some of the
experimental data to the pair of bands. Furthermore, the multitude of calculated cross sections means that some of the experimental frequencies cannot be allocated to calculated branches unambiguously.
Each of the simply connected pockets of bands 321-324 produce a single frequency branch which spans all angles. These branches are well reproduced by the experiment. Between the data points of bands 321/322 and 323/324, we find additional dHvA frequencies in the experimen-tal data (open circles in Fig. 4). Since these pairs of bands come very close in some parts of the BZ, for
ex-ample along the line M1-A [see Fig. 5(a)], electrons can
tunnel between the two bands. Consequently, magnetic breakdown is a likely reason for the appearance of the additional frequencies observed in experiment [30]. The hour-glass-like shape of the FSs of bands 325/326 causes large changes of the related frequency branches when ro-tating away from the c axis, which becomes even more pronounced for the corrugated cylindrical FS sheets of bands 327/328. These calculated frequencies are also in very good agreement with experimental data.
Bands 329-332 produce complicated three-dimensional FS sheets with multiple connections. Not all of the calcu-lated extremal cross sections were found experimentally for these sheets. The strong curvature of the FS sheets, which causes a reduction of the dHvA oscillation ampli-tudes [30], is the most likely reason for the missing dHvA
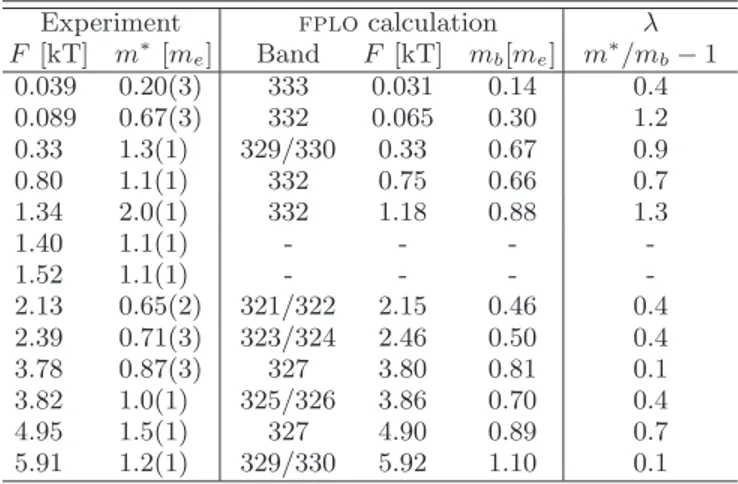
TABLE I. Experimental and calculated dHvA frequencies and effective masses of α-PdBi for B k c. The experimental masses were averaged over several different field ranges. See text for further information.
Experiment fplocalculation λ
F [kT] m∗[m e] Band F [kT] mb[me] m∗/mb− 1 0.039 0.20(3) 333 0.031 0.14 0.4 0.089 0.67(3) 332 0.065 0.30 1.2 0.33 1.3(1) 329/330 0.33 0.67 0.9 0.80 1.1(1) 332 0.75 0.66 0.7 1.34 2.0(1) 332 1.18 0.88 1.3 1.40 1.1(1) - - - -1.52 1.1(1) - - - -2.13 0.65(2) 321/322 2.15 0.46 0.4 2.39 0.71(3) 323/324 2.46 0.50 0.4 3.78 0.87(3) 327 3.80 0.81 0.1 3.82 1.0(1) 325/326 3.86 0.70 0.4 4.95 1.5(1) 327 4.90 0.89 0.7 5.91 1.2(1) 329/330 5.92 1.10 0.1
frequencies. Furthermore, the comparatively coarse k mesh we used for the FS calculations may have been un-able to resolve some fine details of the FSs [36]. Addi-tionally, bands 329 and 330 feature a small pocket around the Z point, which corresponds to frequency branches be-tween 0.3 and 1 kT. These were only partially confirmed experimentally. In some cases, the Fourier spectra show double-peak structures (Fig. 2). These cannot be caused by spin splitting, since spin degeneracy is lifted by SOC, but maybe due to twinning. For α-PdBi with noncen-trosymmetric crystal structure such twinning is hardly avoidable, as discussed in more detail in Refs. [24, 25]. Finally, band 333 only crosses the Fermi level near the
kz = 0 plane of the BZ. This crossing is outside of the
symmetry lines shown in Fig. 5(a) and yields small FS pockets. The corresponding frequency branch, identical to the α frequency reported in Ref. [26], was found at all investigated angles.
Using the assignments of the calculated extremal FS cross sections and experimental dHvA frequencies, we
calculated the band masses, mb, and compared them to
the experimental effective masses m∗, as shown in Table
I. This allows us to estimate the band-resolved
mass-enhancement factors, λ = m∗/m
b− 1. The values for λ
lie between 0.1 and 1.3, which is in good agreement with the mass enhancement estimated from specific-heat data,
λγ = 0.5 (see above). This estimate comprises the
aver-aged λ over all bands and orientations. A large variation in the orientation- and band-resolved mass-enhancement factors is well known from other superconductors [37].
In Ref. [26], the frequency α, related to pocket 333, was reported to possess a non-trivial Berry phase, as ex-tracted from a phase analysis of the dHvA oscillation. In our experiment we cannot safely determine the phase of the α oscillation due to the interference from the large number of other frequencies. In particular, we detected
-0.1 0.0 0.1 -0.2 -0.1 0.0 0.1 0.2 0.3 -0.1 0.0 0.1-0.1 0.0 0.1 -0.2 -0.1 0.0 0.1 0.2 0.3 -0.001 0 0.001 -44 -43 -42 -0.001 0 0.001 -0.001 0 0.001 -44 -43 -42 Bands: 331 332 333 334 E n e r g y ( e V ) k x - k x0 (a) k y - k y0 (b) E n e r g y ( e V ) k z (c) E n e r g y ( m e V ) k x - k x0 (d) k y - k y0 (e) k z E n e r g y ( m e V ) (f)
FIG. 6. Band structure of α-PdBi in the vicinity of the Weyl
node at k0 = (kx0, ky0, kz0) = (0.399706, 0.056504, 0)2π/a.
The cuts are running parallel to the (a) kx, (b) ky, and (c)
kz directions. The band colors are identical to those used in
Fig. 5(a). (d), (e), and (f) are zooms into (a), (b), and (c), respectively. In these zoomed images, we used a fine k spacing
of steps in the range |k − k0| ≤ 10−3 in order to show that
the crossing is indeed nearly linear in all directions.
a neighboring low frequency at many angles, as can be seen in the upper panel of Fig. 2 as a side peak of the α frequency at 39 T, which can cause a large phase shift due to beatings. It is noteworthy that even a correct determination of the phase does not allow for conclusive statements on the existence of a Berry phase. A recent theory work by Alexandradinata et al. analyzes this in detail [38].
Nevertheless, it is still possible to further investigate the band structure of PdBi in the region where band 333 crosses the Fermi energy. For the pocket 333, we
find a linear band crossing at k0 = (kx0, ky0, kz0) =
(0.399706, 0.056504, 0) · 2π/a, 43 meV below the Fermi energy, as shown in Fig. 6 [39]. This linear band crossing is a Weyl node and renders its surrounding FS sheet topo-logically non-trivial, which appears to support the sug-gested presence of topological states given in Ref. [26, 42]. Note, that the linear crossing is symmetry protected in
the kz = 0 plane, whereas the kx0 and ky0 positions are
subject to numerical uncertainty. Furthermore, the two-fold symmetry of the crystal structure is imparted on the band structure, producing a second Weyl node at (−kx0, −ky0, 0).
It remains, however, questionable whether these Weyl nodes have any decisive effect on transport or other macroscopic electronic properties in α-PdBi. The ener-getic distance of the Weyl nodes from the Fermi energy (43 meV) seems to be too large to influence such prop-erties even at room temperature. In addition, the linear dispersion is only found over a very limited energy range
6
EF, the dispersion of band 333 is much more curved and
far from linear and the partial DOS resulting from this band contributes only about 0.23% to the total DOS.
CONCLUSIONS
We performed a comprehensive dHvA study of the noncentrosymmetric superconductor α-PdBi. The dHvA results agree very well with fplo DFT calculations. Al-together, 13 bands cross the Fermi energy leading to rich dHvA spectra. All observed FS sheets reveal rather small
effective masses (2.0 me or less). Their moderate mass
enhancement is in line with the average value of 0.5, which was estimated from specific-heat data and
corre-sponds to the observed Tcof 3.7 K. One of the 13 bands,
the so-called α band with smallest extremal area, shows topologically nontrivial Weyl points 43 meV below the Fermi energy. Whether the electrons in this band give rise to topological superconductivity seems unlikely, but merits further study.
ACKNOWLEDGMENTS
We thank H. Rosner for helpful discussions. The work was supported by Deutsche Forschungsgemeinschaft
(DFG) through the W¨urzburg-Dresden Cluster of
Ex-cellence on Complexity and Topology in Quantum
Mat-ter ct.qmat (EXC 2147, project-id 390858490), the
ANR-DFG grant Fermi-NESt, the grant JE748/1, and by Hochfeld-Magnetlabor Dresden (HLD) at HZDR, member of the European Magnetic Field Laboratory (EMFL). PW and DK were supported by the Na-tional Science Centre (Poland) under research grant 2015/18/A/ST3/00057.
∗ Present address: School of Physics, Trinity College
Dublin, Dublin 2, Ireland
[1] M. Sigrist and K. Ueda, Rev. Mod. Phys. 63, 239 (1991). [2] E. Bauer and M. Sigrist, Non-Centrosymmetric Super-conductors: Introduction and Overview (Springer, New York, 2012).
[3] S. Yip, Annu. Rev. Condens. Matter Phys. 5, 15 (2014). [4] L. P. Gorkov and E. I. Rashba, Phys. Rev. Lett. 87,
037004 (2001).
[5] M. Smidman, M. B. Salamon, H. Q. Yuan, and D. F. Agterberg, Rep. Prog. Phys. 80, 036501 (2017).
[6] X.-L. Qi and S.-C. Zhang, Rev. Mod. Phys. 83, 1057 (2011).
[7] M. Z. Hasan and C. L. Kane, Rev. Mod. Phys. 82, 3045 (2010).
[8] A. P. Schnyder, S. Ryu, A. Furusaki, and A. W. W. Lud-wig, Phys. Rev. B 78, 195125 (2008).
[9] A. Y. Kitaev, Phys. Uspekhi 44, 131 (2001).
[10] D. A. Ivanov, Phys. Rev. Lett. 86, 268 (2001). [11] F. Wilczek, Nat. Phys. 5, 614 (2009).
[12] M. Sato and S. Fujimoto, Phys. Rev. B 79, 094504 (2009).
[13] Y. C. Bhatt and K. Schubert, J. Less-Common. Met. 64, P17 (1979).
[14] B. Joshi, A. Thamizhavel, and S. Ramakrishnan, Phys. Rev. B 84, 064518 (2011).
[15] M. Mondal, B. Joshi, S. Kumar, A. Kamlapure, S. C. Ganguli, A. Thamizhavel, S. S. Mandal, S. Ramakrish-nan, and P. Raychaudhuri, Phys. Rev. B 86, 094520 (2012).
[16] K. Matano, S. Maeda, H. Sawaoka, Y. Muro, T. Tak-abatake, B. Joshi, S. Ramakrishnan, K. Kawashima, J. Akimitsu, and G. Zheng, J. Phys. Soc. Jpn. 82, 084711 (2013).
[17] L. Jiao, J. L. Zhang, Y. Chen, Z. F. Weng, Y. M. Shao, J. Y. Feng, X. Lu, B. Joshi, A. Thamizhavel, S. Ramakr-ishnan, and H. Q. Yuan, Phys. Rev. B 89, 060507(R) (2014).
[18] X. B. Yan, Y. Xu, L. P. He, J. K. Dong, H. Cho, D. C. Peets, J.-G. Park, and S. Y. Li, Supercond. Sci. Technol.
29, 065001 (2016).
[19] D. C. Peets, A. Maldonado, M. Enayat, Z. Sun, P. Wahl, and A. P. Schnyder, Phys. Rev. B 93, 174504 (2016). [20] S. Ramakrishnan, B. Joshi, and A. Thamizhavel, Philos.
Mag. 97, 3460 (2017).
[21] M. Neupane, N. Alidoust, M. M. Hosen, J.-X. Zhu, K. Dimitri, S.-Y. Xu, N. Dhakal, R. Sankar, I. Belopolski, D. S. Sanchez, T.-R. Chang, H.-T. Jeng, K. Miyamoto, T. Okuda, H. Lin, A. Bansil, D. Kaczorowski, F. Chou, M. Z. Hasan, and T. Durakiewicz, Nat. Commun. 7, 13315 (2016).
[22] H. Lohani, P. Mishra, A. Gupta, V. P. S. Awana, B. R. Sekhar, Physica C 534, 13 (2017).
[23] S. Thirupathaiah, S. Ghosh, R. Jha, E. D. L. Rienks, K.
Dolui, V. V. Ravi Kishore, B. B¨uchner, T. Das, V. P. S.
Awana, D. D. Sarma, and J. Fink, Phys. Rev. Lett. 117, 177001 (2016).
[24] H. M. Benia, E. Rampi, C. Trainer, C. M. Yim, A.
Mal-donado, D. C. Peets, A. St¨ohr, U. Starke, K. Kern, A.
Yaresko, G. Levy, A. Damascelli, C. R. Ast, A. P. Schny-der, and P. Wahl, Phys. Rev. B 94, 121407(R) (2016). [25] Z. Sun, M. Enayat, A. Maldonado, C. Lithgow, E.
Yel-land, D. C. Peets, A. Yaresko, A. P. Schnyder, and Peter Wahl, Nat. Commun. 6, 6633 (2015).
[26] M. A. Khan, D. E. Graf, I. Vekhter, D. A. Browne, J. F. DiTusa, W. A. Phelan, and D. P. Young, Phys. Rev. B
99, 020507(R) (2019).
[27] V. Barzykin and L. P. Gorkov, Phys. Rev. B 76, 014509 (2007).
[28] A. Yaresko, A. P. Schnyder, H. M. Benia, C.-M. Yim, G. Levy, A. Damascelli, C. R. Ast, D. C. Peets, and P. Wahl, Phys. Rev. B 97, 075108 (2018).
[29] The small anomaly appearing at about 1.4 T (inset of Fig. 1) is an artifact of the measuement.
[30] D. Shoenberg, Magnetic Oscillations in Metals (Cam-bridge University Press, Cam(Cam-bridge, England, 1984). [31] K. Koepernik and H. Eschrig, Phys. Rev. B 59, 1743
(1999).
[32] H. Eschrig, M. Richter, and I. Opahle, in: Relativis-tic Electronic Structure Theory, Part 2. Applications, edited by P. Schwerdtfeger, Theoretical and Computa-tional Chemistry (Elsevier, 2004), vol. 14, pp. 723-776.
[33] J. P. Perdew and Y. Wang, Phys. Rev. B 45, 13244 (1992).
[34] V. M. Ionov, N. A. Tomilin, A. E. Prozorovskii, A. N. Klimenko, Y. V. Titov, S. G. Zhukov, and G. V. Fetisov, Sov. Phys. Crystallogr. 34, 496 (1989).
[35] For other materials with simpler crystal and band struc-ture, FS calculations on up to 10 times denser grids are straightforward.
[36] The logarithmic frequency axis in Fig. 4 leads to a seem-ingly larger deviation between experimental and calcu-lated dHvA frequencies for the low-frequency bands 332 and 333. However, in absolute numbers this difference is only 24 and 8 T, respectively. These values should be compared to the total area of the first Brillouin zone which corresponds to about 13,100 T. See also Ref. [39]. [37] B. Bergk, V. Petzold, H. Rosner, S.-L. Drechsler, M. Bartkowiak, O. Ignatchik, A. D. Bianchi, I. Sheikin, P. C. Canfield, and J. Wosnitza, Phys. Rev. Lett. 100, 257004 (2008).
[38] A. Alexandradinata, C. Wang, W. Duan, and L. Glaz-man, Phys. Rev. X 8, 011027 (2018).
[39] Although modern DFT calculations show a high de-gree of reproducibility, they are all based on approxima-tions. Therefore, differences between results using differ-ent codes and to experimdiffer-ental data are expected. For a deeper discussion of this DFT challenge, see Refs. [40, 41]. This means for the values given for the position of the Weyl node, they are precise only for the used approxima-tion and code, but may be off to experimental data by some amount. In the present case, where the experimen-tal FS pocket of band 333 is larger by about 20% than calculated, the Weyl node might be even further away from the Fermi energy.
[40] T. F¨orster, I. Kraft, I. Sheikin, A. D. Bianchi, J.
Wos-nitza, and H. Rosner, J. Phys.: Condens. Matter 32, 025503 (2020).
[41] K. Lejaeghere et al., Science 351, aad3000 (2016). [42] In [26], no detailed analysis of the α-band dispersion
re-lation is given. The presence of topological states is con-cluded only from the phase analysis of the dHvA oscilla-tions.