HAL Id: inserm-03215474
https://www.hal.inserm.fr/inserm-03215474
Submitted on 3 May 2021
HAL is a multi-disciplinary open access
archive for the deposit and dissemination of
sci-entific research documents, whether they are
pub-lished or not. The documents may come from
teaching and research institutions in France or
abroad, or from public or private research centers.
L’archive ouverte pluridisciplinaire HAL, est
destinée au dépôt et à la diffusion de documents
scientifiques de niveau recherche, publiés ou non,
émanant des établissements d’enseignement et de
recherche français ou étrangers, des laboratoires
publics ou privés.
Increased Sirt1 secreted from visceral white adipose
tissue is associated with improved glucose tolerance in
obese Nrf2-deficient mice
Laura Braud, Maria Pini, Donald Stec, Sylvie Manin, Geneviève Derumeaux,
David Stec, Roberta Foresti, Roberto Motterlini
To cite this version:
Laura Braud, Maria Pini, Donald Stec, Sylvie Manin, Geneviève Derumeaux, et al.. Increased Sirt1
secreted from visceral white adipose tissue is associated with improved glucose tolerance in obese
Nrf2-deficient mice. Redox Biology, Elsevier, 2021, 38, pp.101805. �10.1016/j.redox.2020.101805�.
�inserm-03215474�
Redox Biology 38 (2021) 101805
Available online 24 November 2020
2213-2317/© 2020 The Author(s). Published by Elsevier B.V. This is an open access article under the CC BY-NC-ND license
(http://creativecommons.org/licenses/by-nc-nd/4.0/).
Research Paper
Increased Sirt1 secreted from visceral white adipose tissue is associated
with improved glucose tolerance in obese Nrf2-deficient mice
Laura Braud
a,***, Maria Pini
a, Donald F. Stec
b, Sylvie Manin
a, Genevi`eve Derumeaux
a,
David E. Stec
c, Roberta Foresti
a,1,**, Roberto Motterlini
a,1,*aUniversity Paris-Est Cr´eteil, INSERM, IMRB, F-94010, Cr´eteil, France
bVanderbilt Institute for Chemical Biology (VICB), Vanderbilt University, Nashville, USA cUniversity of Mississippi Medical Center, Jackson, MS, 39216, USA
A R T I C L E I N F O
Keywords:
Nrf2 Sirtuin 1 Obesity
White adipose tissue Glucose metabolism
A B S T R A C T
Obesity is associated with metabolic dysregulation characterized by insulin resistance and glucose intolerance. Nuclear factor E2-related factor (Nrf2) is a critical regulator of the stress response and Nrf2-deficient mice (Nrf2−/−) are protected against high fat diet (HFD)-induced metabolic derangement. We searched for factors that
could underline this favorable phenotype and found that Nrf2−/− mice exhibit higher circulating levels of sirtuin
1 (Sirt1), a key player in cellular homeostasis and energy metabolism, compared to wild-type mice. Increased Sirt1 levels in Nrf2−/− mice were found not only in animals under standard diet but also following HFD.
Interestingly, we report here that the visceral adipose tissue (eWAT) is the sole source of increased Sirt1 protein in plasma. eWAT and other fat depots displayed enhanced adipocytes lipolysis, increased fatty acid oxidation and glycolysis, suggesting autocrine and endocrine actions of Sirt1 in this model. We further demonstrate that removal of eWAT completely abolishes the increase in circulating Sirt1 and that this procedure suppresses the beneficial effect of Nrf2 deficiency on glucose tolerance, but not insulin sensitivity, following a HFD regime. Thus, in contrast to many other stressful conditions where Nrf2 deficiency exacerbates damage, our study in-dicates that up-regulation of Sirt1 levels specifically in the visceral adipose tissue of Nrf2−/− mice is a key
adaptive mechanism that mitigates glucose intolerance induced by nutritional stress.
1. Introduction
Obesity and associated metabolic dysfunction constitute a great threat for global health and the study of mechanisms implicated in these conditions may help to identify potential therapeutic targets. The white adipose tissue (WAT) is crucial in obesity due its fat storing capacity as well as its endocrine function, promoted by the secretion of several
factors and hormones that influence whole body metabolism [1]. For
example, WAT releases leptin and adiponectin to control appetite and insulin sensitivity, and produces inflammatory factors such as
interleukin-6 (IL-6) and tumor necrosis factor-α (TNF-α) that are
involved in the metabolic complications of obesity. These and other observations led to a shift in the perception of WAT from that of an inert tissue to that of a highly plastic organ that can be manipulated to
provide beneficial effects in obesity. In line with this, we have recently demonstrated that a switch in adipose tissue metabolism towards glycolysis induced by a carbon monoxide-releasing molecule (CORM-401) reduces body weight gain and improves insulin resistance
in HFD-fed mice [2]. In addition, stimulation of brown-like features in
WAT, based on the idea that brown fat augments energy expenditure as opposed to the energy storage function of WAT, has been reported. Treatment with fibroblast growth factor 21 (FGF21), irisin or the over-expression of sirtuin 1 (Sirt1), were shown to confer ‘browning’ char-acteristics to WAT and exert beneficial effects on insulin and glucose
tolerance [3]. In particular, Sirt1 is a NAD+-dependent protein
deace-tylase that plays a crucial role in controlling cellular metabolism as well as the energy status of the organism, and has been shown to protect mice
against HFD-induced metabolic dysfunction [4]. Additional key roles of
* Corresponding author. Faculty of Health, University Paris-Est Cr´eteil, Inserm U955, France. ** Corresponding author. Faculty of Health, University Paris-Est Cr´eteil, Inserm U955, France. *** Corresponding author. Faculty of Health, University Paris-Est Cr´eteil, Inserm U955, France.
E-mail addresses: laura.braud@inserm.fr (L. Braud), roberta.foresti@inserm.fr (R. Foresti), roberto.motterlini@inserm.fr (R. Motterlini).
1 These authors contributed equally to this work.
Contents lists available at ScienceDirect
Redox Biology
journal homepage: www.elsevier.com/locate/redox
https://doi.org/10.1016/j.redox.2020.101805
Sirt1 include inhibition of adipogenesis and increased free fatty acids
utilization in WAT [5], while in the liver Sirt1 enhances gluconeogenesis
and inhibits glycolysis via forkhead box protein O1 (FOXO1) [6].
Overexpression of Sirt1 also ameliorates hepatic steatosis and glucose
intolerance in obese mice by inducing FGF21 [7].
Previous studies have highlighted a crosstalk between Sirt1 and nuclear factor erythroid 2-related factor 2 (Nrf2), the transcription factor that activates the response to stress conditions by regulating the expression of a variety of detoxifying and antioxidant genes including NAD(P)H-quinone oxidoreductase 1 (NQO1), glutathione S-transferases
(GSTs) and heme oxygenase-1 (HO-1) [8–11]. Besides its well-described
cytoprotective activities against tissue damage triggered by oxidative
stress and inflammation [12–14], the possible implications of Nrf2 in the
regulation of metabolism started to emerge only recently [15].
How-ever, whether Nrf2 plays a protective or deleterious role in obesity is unclear as divergent data have been published so far. In fact, pharma-cologic induction of Nrf2 by the synthetic triterpenoid CDDO-imidazolide prevents body weight gain, adipogenesis and hepatic
lipid accumulation in mice [16]. Activation of Nrf2 also improves leptin
and insulin resistance provoked by hypothalamic oxidative stress [17]
and impedes the onsets of HFD-induced diabetes [18]. In addition,
ge-netic deletion of Nrf2 leads to hepatic insulin resistance via the
activa-tion of NF-κB [19]. In contrast, complete or adipose-specific Nrf2
ablation protects mice against HFD-induced obesity and insulin resis-tance; these effects are associated with impaired adipogenesis mediated
by the nuclear receptor PPARγ in adipose tissue [20,21] and by
increased production of FGF21, which regulates glucose intake [22,23].
These discrepancies may be due to the origin of the metabolic disorders or the experimental models used to study the impact of Nrf2 in obesity, emphasizing the need to investigate further the exact role of Nrf2 and its downstream effectors in metabolism.
In the present study, we extensively examined the response of Nrf2 deficient mice to HFD-induced obesity. We demonstrate that Nrf2
defi-cient mice (Nrf2−/−) exhibit significantly elevated basal plasma levels of
Sirt1 compared to wild type (WT) mice. Higher circulating Sirt1 appear to derive most exclusively from the epididymal WAT (eWAT). By
comparing wild type (WT) and Nrf2−/− animals we reveal that Nrf2
deficient mice under HFD maintain an increased production of Sirt1, are resistant to weight gain and metabolic derangement and display enhanced adipocytes lipolysis together with increased bioenergetic metabolism. Finally, we show that removal of eWAT (eWATectomy) before subjecting mice to HFD suppresses the increase in circulating Sirt1 and the beneficial effect of Nrf2 deficiency on glucose tolerance after a HFD regime. Our study demonstrates that increased eWAT- derived Sirt1 is a critical downstream adaptation of Nrf2 deficiency that mitigates glucose intolerance induced by obesity.
2. Materials and methods
2.1. Animals
Wild type (WT) C57/BL6J mice (8 weeks old) were purchased from
Janvier Labs (France). Nrf2−/− mice (8 weeks old), which had been
backcrossed with C57/BL6J mice and kept as homozygous, were pur-chased from the TAAM laboratory (Orl´eans, France). To take in consideration that mice were from different suppliers, even if from the same genetic background, mice from both groups were received at the age of 4 weeks, put into quarantine for a 4 weeks period in order to acclimatize them to our animal facility. Thus, the same environment and nutritional states were applied prior to the beginning of our protocols. Mice were housed under controlled conditions of temperature (21 ±
1◦C), hygrometry (60 ± 10%) and lighting (12 h per day). Animals were
acclimatized in the laboratory for one week before the start of the ex-periments. Mice were fed either a standard diet SD (A04, SAFE Diet, Augy, France) or a HFD (60 kcal % fat, Brogaarden, DK). All animals received care according to institutional guidelines, and all experiments
were approved by the Institutional Ethics committee (licence number 16–090). During follow-up, animals underwent body weight, food intake, metabolic and echocardiography assessments. For tissue collec-tion, mice were euthanatized 6 h after fasting and organs and blood were collected and processed for further evaluation.
2.2. Fasting blood glucose, glucose and insulin tolerance tests
Whole-body glucose tolerance and insulin sensitivity were assessed
in all groups at weeks 12th and 13th by intraperitoneal glucose (GTT) and
insulin (ITT) tolerance tests, respectively. First, blood was collected via tail clip to measure fasting blood glucose (Caresens® N, DinnoSanteTM). Then, mice received glucose (1.5 g/kg) or insulin (0.3 UI/kg) in solution by intraperitoneal injection and blood glucose was measured at 15, 30, 60, 90 and 120 min after the injection. The HOmeostasis Model Assessment of Insulin Resistance (HOMA-IR) adjusted to rodents was calculated as ([glucose (mg/dl)/18] x [insulin (ng/ml)/0.0347])/
108.24 as reported [24]. The area under the curve (AUC) for the glucose
excursion was calculated using Graph Prism.
2.3. Body composition
Body composition (fat mass, free water, and total water) using magnetic resonance imaging (EchoMRI-900TM, Echo Medical System,
Houston, TX) as previously described [25,26]. Conscious mice were
placed in a thin-walled plastic cylinder with a plastic insert that func-tioned to limit the movement while the mice were in the EchoMRI in-strument. Body composition analysis was measured in mice exposed to a low-intensity electromagnetic field and the amount of fat and lean mass detected was expressed as a percentage of total body weight.
2.4. Removal of visceral adipose tissue (eWATectomy)
A total of 10 male WT C57/BL6J mice (WT-eWAT) and 10 male
Nrf2−/− C57/BL6J mice (Nrf2-eWAT), 10 weeks of age and weighing
approximately 25–30 g, were used for adipose tissue removal performed by epididymal fat resection (eWATectomy). Before eWATectomy, mice underwent baseline assessment of metabolic functions (glucose toler-ance and insulin tolertoler-ance test). Mice were anesthetized with inhaled 3% isoflurane and a 1-cm single abdominal midline incision was made. Bilateral epididymal fat pads were lifted from the peritoneal cavity onto a sterilized and humidified surgical drape, dissected with an electronic scalpel, and removed without damaging the testicular blood supply. The sham operation was performed in the same manner without fat pads removal. The abdominal peritoneum was closed with prolyne sutures and the skin was closed with silk sutures (Angiotech, Canada). After eWATectomy, mice were subjected to a 8 week HFD regime. GTT and ITT tests were performed at week 7 and mice sacrificed at the end of the protocol for tissue analysis.
2.5. Preparation of eWAT-conditioned medium (eCM)
Epididymal white adipose tissue (eWAT, 0.1 g) was collected and kept at room temperature in a 24-well plate with 1 ml/well of Dulbec-co’s modified Eagle’s medium DMEM (Life Technologies, France). The
tissue was minced into ~1 mm3 pieces and incubated for 1 h at 37◦C and
5% CO2 prior to transferring it into a new plate with fresh DMEM
me-dium containing 4.5 g glucose, 2 mM glutamine, 1% free fatty acid bovine serum albumin, 1% antibiotic and antimycotic solution (Sigma Aldrich). eWAT-conditioned medium (eCM) was collected 24 h after
incubation and stored at − 80◦C for further analysis.
2.6. Plasma and eCM analysis
Enzyme-linked immunosorbent assay (ELISA) kits were used to measure insulin (ALPCO Diagnostics, Salem, NH), FGF21 (R&D Systems,
Minneapolis, MN) and Sirt1 (E-EL-M0350, Cliniscience). Lactate, alanine transaminase (ALT), aspartate transaminase (AST) were measured in plasma samples using a Cobas 8000 analyser (Roche, Indianapolis, USA). Cytokines (IL-1β, IL-10 and IL-6) and leptin, adi-ponectin and resistin were measured using Mesoscale Multiplex and Single-plex plates, respectively (Mesoscale Discovery, Gaithersburg, USA).
2.7. Analysis of plasma lipids and metabolites
Following an 8 h fast, a blood sample was obtained via the orbital sinus under isoflurane anesthesia for analysis of plasma lipids and me-tabolites. Nuclear magnetic resonance NMR spectroscopy analysis of plasma samples was performed using a 14.0 T Bruker magnet equipped with a Bruker AV-III console operating at 600.13 MHz. All spectra were acquired in 3 mm NMR tubes using a Bruker 5 mm QCI cryogenically cooled NMR probe. Plasma samples were prepared and analyzed ac-cording to the Bruker In-Vitro Diagnostics research (IVDr) protocol.
Sample preparation consisted of combining 50 μl of plasma with 150 μl
of buffer supplied by Bruker Biospin specifically for the IVDr protocol. For 1D 1H NMR, data was acquired using the 1D-NOE experiment, which filters NMR signals associated with broad line widths arising from proteins that might be present in plasma samples that adversely affect spectral quality. Experiment conditions included: sample temperature of 310K, 96k data points, 20 ppm sweep width, a recycle delay of 4 s, a mixing time of 150 ms, and 32 scans. Lipoprotein subclass analysis was performed using regression analysis of the NMR data which is done
automatically as part of the IVDr platform as previously described [27].
2.8. Analysis of mRNA expression
After an initial extraction step by mixing Extract-All (Eurobio, France) and chloroform to samples, total RNA purification was per-formed with a column extraction Kit (RNeasy Mini®, Qiagen, Germany). Double-strand cDNA was synthesized from total RNA with the High- Capacity cDNA Reverse Transcription Kit (Life Technologies, Carlsbad, CA). Quantitative real-time PCR (qPCR) was performed in a StepOne-Plus Real-Time PCR System using commercially available TaqMan primer-probe sets (Life Technologies, Carlsbad, CA). Gene expression was assessed by the comparative CT (ΔΔCT) method with β-actin as the reference gene.
2.9. Western blot analysis
Snap-frozen eWAT samples (200 mg) were lysed in cell lysis buffer (Cell Signaling, Danvers, MA France) supplemented with 1% phenyl-methylsulfonyl fluoride (PMSF). Protein samples were resolved on 12% bis-Tris gels followed by transfer to nitrocellulose membrane. Anti-bodies for AMPK (#2532S), AMPK-P (#2535), Foxo1 (#2880) were from Cell Signaling and antibodies for β-actin (sc-47778) were from Santa Cruz. Bands were visualized by enhanced chemiluminescence and quantified using ImageJ software.
2.10. Histology and immunohistochemistry
Fresh visceral adipose tissue (eWAT) was fixed in 10% phosphate-
buffered formalin overnight. Paraffin wax sections of 5 μm were
pro-cessed for immunostaining. Hematoxylin-eosin (H&E) stained images from mice were analyzed using Adiposoft software. Perilipin antibodies (#9349) were obtained from Cell Signaling, Sirt1 antibodies (GTX17532) were from GeneTex Inc. and CD68 antibodies (ab125512) were from Abcam. Electron microscopy (EM) investigation was per-formed on eWAT sections fixed with glutaraldehyde and stained with, osmium tetroxyde. Primary adipocytes from eWAT samples were stained with Mitotracker green (M7514) from Invitrogen. 3D-Z stack of images were acquired using confocal microscope Zeiss LSM510 and analysis
was performed using Fiji software.
2.11. Pre-adipocytes isolation and culture
Pre-adipocytes were isolated from eWAT obtained from WT or
Nrf2−/− mice. Fat pads were placed in Hanks Balanced Salt Solution
(HBSS) medium (Life Technologies) under a tissue culture hood, minced
into ~1 mm3 pieces and transferred into fresh digestion medium
con-taining 70% HBSS, 30% Bovine Serum Albumin (Sigma Aldrich) and 1 mg/mL collagenase type II (Life Technologies). Samples were incubated
at 37◦C for 1 h under shaking (120 rpm). The resulting material was
filtered through 100 μm mesh and flushed with stop digestion medium
collagenase-free. Adipocytes, pre-adipocytes and stromavascular com-ponents were separated by centrifugation at 1500 rpm for 5 min at room temperature. The pre-adipocytes were collected and transferred into a new tube with 1:1 v/v DMEM growth media containing 10% new born calf serum, 1% penicillin/streptomycin and 2.4 nM insulin. Pre- adipocytes were centrifuged at 1500 rpm for 5 min at room tempera-ture, medium was removed and the pre-adipocyte pellet was washed with 10 mL growth medium. This washing step was repeated twice. The pre-adipocytes pellet was resuspended, plated in 12 well plate and
cultured for 5-6 days for differentiation at 37◦C in 5% CO
2.
2.12. Preparation of stromal and adipocyte fractions
Stromal cells and mature adipocytes were isolated from epididymal adipose tissue from WT and NRF2− /− male mice. Adipose tissue was harvested, weighed, finely minced and digested in HBSS containing 1
mg/mL collagenase type II (Sigma) for approximately 40 min at 37◦C
with gentle shaking. The digested material was passed through a 100 μm
filter (Falcon-352360), washed with HBSS+10%FBS+P/S and spun at 300 g × 5min. The medium was removed, floating mature adipocytes and stromal vascular fraction (SVF) were collected and washed again. Isolation of mRNA was performed by RNeasy Lipid Tissue Mini Kit (Quiagen). Adiponectin (ADIPOQ), a late marker of adipocyte differ-entiation, was used to confirm the purity of the fractions.
2.13. 3T3-L1 cell culture
3T3-L1 murine pre-adipocytes (reference 088SP-L1-F) were pur-chased from the ZenBio company (NC, USA) and cultured in an
atmo-sphere of 5% CO2 at 37 ◦C using DMEM supplemented with 10%
newborn calf serum. For adipocyte differentiation, cells were stimulated
with 3T3-L1 differentiation medium containing IBMX (500 μM),
dexa-methasone (250 nM) and insulin (175 nM) for 2 days after cells reached confluency. The medium was changed to DMEM containing 10% FBS and insulin (175 nM) after 2 days and adipocytes were then kept into DMEM containing only 10% FBS. Prior to the experiments, adipocytes were subjected to serum deprivation for 16 h with DMEM supplemented with 0.5% FBS.
2.14. siRNA treatment
siRNA for Nrf2 (reference L-040766-00-0005) was purchased from Horizon Discovery LTD company (Cambridge, UK) and siRNA treatment was performed according to manufacturer’s instructions.
2.15. Cellular bioenergetic analysis using the Seahorse Bioscience XF analyzer
Bioenergetic profiles of the adipocytes were determined using a Seahorse Bioscience XF24 Analyzer (Billerica, MA, USA) that provides real-time measurements of oxygen consumption rate (OCR), indicative of mitochondrial respiration, and extracellular acidification rate
2.16. Determination of ATP, NAD+ and NADH
NAD+ and NADH levels were determined in frozen adipose tissue samples using an enzymatic method (EnzyChrom, BioAssays Systems, Hayward, CA) according to manufacturer’s instructions. Intracellular ATP levels were measured at the end of the experiments with the XF Analyzer using an ATPLiteTM Bioluminescence Assay Kit (PerkinElmer, Courtaboeuf, France) according to manufacturer’s instructions.
2.17. Statistical analysis
Data are expressed as mean values ± standard error of the mean (SEM). Statistical analysis was performed by one or two-way analysis of
variance (ANOVA) with Fisher multiple comparison test. The result were considered significant at p-value<0.05.
3. Results
3.1. Nrf2-deficient mice exhibit enhanced Sirt1 levels originating from WAT
A representative photograph of 22 week-old mice reveals that the
Nrf2−/− mouse is slightly smaller than its WT counterpart (Fig. 1A).
When mice were fed a standard diet (SD) for 14 weeks, we did not observe a significant difference in the changes of total body weight and
food intake between the two groups (Fig. 1B). Nevertheless, Nrf2−/−
Fig. 1. Metabolic adaptation of Nrf2-deficient mice fed a standard diet (SD) is associated with enhanced circulating Sirt1 levels. (A) Representative photographs of 22-week-old wild-type (WT) and Nrf2-deficient (Nrf2−/−) mice. (B) Changes in body weight (BW) in WT and Nrf2−/− mice during a 14-week SD
regime. (C) Lean and fat mass measured by indirect calorimetry in WT and Nrf2−/− mice after 14 weeks of SD. (D) Insulin tolerance test (ITT) and (E) glucose
tolerance test (GTT) in WT and Nrf2−/− mice after 14 weeks of SD. (F) Plasma levels of sirtuin 1 (Sirt1) protein and (G) Sirt1 mRNA gene expression in different
organs of WT and Nrf2-/-mice after 14 weeks of SD. (H) Immunofluorescence staining for Sirt1 protein in eWAT of WT and Nrf2−/− mice and quantification assessed
by mean of fluorescence intensity (MFI). (I) Sirt1 and adiponectin (AdipoQ) mRNA expression in adipocytes and stromal vascular fraction (SVF) separated from eWAT of WT and Nrf2− /− mice. (J) Nrf2 and Sirt1 mRNA expression in 3T3-L1 cells transfected with Nrf2 siRNA. Values represent the mean ± SEM of n = 8–9 mice per group. *p < 0.05 vs. WT mice (white bars).
mice remained slightly smaller and displayed significantly higher total
lean mass and lower fat mass compared to WT mice (Fig. 1C).
Inter-estingly, the plasma levels of the main adipose tissue cytokines leptin,
adiponectin and resistin were also markedly lower in Nrf2−/− than in
WT mice (Table 1). We did not find any difference in glucose and insulin
metabolism assessed by the glucose (GTT) and insulin (ITT) tolerance
tests, respectively (Fig. 1D and 1E). Similarly, plasma levels of glucose,
insulin and lipids (triglycerides, non-esterified fatty acid, cholesterol, apolipoproteins, low and high-density lipoproteins (LDL and HDL,
respectively)) were all comparable between WT and Nrf2−/− mice
(Table 1). However, among the various parameters measured, we
noticed that plasma Sirt1 levels were strongly enhanced in Nrf2−/− mice
compared to their WT counterparts (Fig. 1F). To identify the source of
Sirt1, we examined the expression of the Sirt1 gene by qPCR in various organs. Interestingly, and compared to WT mice, we detected a
signifi-cant up-regulation of Sirt1 mRNA expression only in eWAT of Nrf2−/−
mice, while no difference was observed in liver, muscle, heart,
subcu-taneous white (SubWAT) and brown adipose tissues (BAT) (Fig. 1G).
Immunofluorescence staining revealed that the enhanced Sirt1 gene
expression in eWAT of Nrf2−/− mice coincided with an increase of Sirt1
protein levels (Fig. 1H). Notably, the marked increase in Sirt1 mRNA
expression in eWAT of Nrf2− /− mice was originating from both the adipocyte and stromal vascular fraction (SVF) as indicated by the similar
level of Sirt1 in these two type of cellular components (Fig. 1I). To
confirm further that an increase in Sirt1 expression is due to the absence of Nrf2, we cultured 3T3-L1 fully differentiated adipocytes and silenced
the Nrf2 gene by siRNA transfection. As shown in Fig. 1J, we found that
ablating Nrf2 in adipocytes causes an increased Sirt1 gene expression.
These data clearly show that Nrf2 deficiency results in a distinctive adaptation characterized by increased circulating levels of Sirt1, which most likely originates from enhanced secretion of Sirt1 from eWAT.
3.2. Nrf2 deficiency enhances lipolysis and fatty acid oxidation in adipose tissue
Because Sirt1 controls lipid metabolism in adipocytes [5,28], we
further investigated the impact of Nrf2 deficiency on lipolysis, fatty acid oxidation and lipogenesis. We first noticed that the amount of eWAT in Nrf2-deficient mice is significantly reduced, with much smaller and
denser adipocytes compared to WT mice (Fig. 2A–D). BAT and SubWAT
of Nrf2−/− mice were also smaller and exhibited a reduced adipocyte
size than in WT (Supplementary Figs. 1 and 2), even in the absence of
increased Sirt1 gene levels (Fig. 1G). Secondly, the expression of several
genes involved in lipolysis and fatty acid oxidation in eWAT of Nrf2−/−
mice was significantly higher compared to WT. These included forkhead box protein O1 (Foxo1), adipose triglyceride lipase (Atgl), fatty acid binding protein 4 (Fabp4) and perilipin (Plin1), peroxisome
proliferator-activated receptor gamma coactivator 1-alpha (PGC1α) and
peroxisome proliferator-activated receptor alpha (PPARα) (Fig. 2E). In
contrast, lipogenic genes such as peroxisome proliferator-activated re-ceptor gamma (PPARγ), fatty acid synthase (Fasn) and sterol regulatory
element-binding transcription factor 1 (Srebp1c) in eWAT of Nrf2−/−
were all lower than in WT mice (Fig. 2E). A similar profile for adipocytes
lipolytic and lipogenic gene expressions was found in SubWAT and for
some genes (i.e. PGC1α) also in BAT (Supplementary Figs. 1 and 2). We
also show that increased Fox1 gene expression correlated with
up-regulation of FOXO1 protein in eWAT of Nrf2−/− mice in association
with enhanced AMPK and phosphorylated-AMPK proteins (Fig. 2F).
Since FOXO1, AMPK and phosphorylated-AMPK are downstream targets of Sirt1, these data suggest a Sirt1-driven metabolic adaptation of eWAT resulting from Nrf2-deficiency. Moreover, we found a significant in-crease in perilipin, a protein known to promote hydrolysis of lipid
droplets in adipose tissue (Fig. 2G), and higher levels of non-esterified
free fatty acid (NEFA) secreted in the conditioned media from eWAT
of Nrf2−/− mice compared to WT (Fig. 2H). Finally, we demonstrated by
electron microscopy that eWAT from Nrf2−/− mice contained more lipid
droplets than eWAT from WT animals (Fig. 2I). Altogether, these data
establish that: 1) Nrf2 deficiency modifies adipose tissue metabolism, driving it towards fatty acids mobilization and elimination; 2) this modification is associated with an increased Sirt1 production, as demonstrated by activation of Sirt1 downstream targets in eWAT and
consistent with the recognized role of Sirt1 in fatty acid utilization [28];
3) in addition to autocrine signaling on eWAT, it is likely that Sirt1 secreted by eWAT and circulating in blood also affects BAT and SubWAT fatty acid metabolism in an endocrine manner.
3.3. Nrf2 deficiency enhances bioenergetic metabolism in adipocytes
Because of the enhanced fatty acid metabolism in eWAT, we next assessed the impact of Nrf2 deficiency on bioenergetics in adipocytes
and adipose tissue punches isolated from Nrf2−/− and WT mice.
Mito-chondrial content, and NAD+/NADH ratio were not significantly
different between the two groups, although citrate synthase activity
tended to increase (Fig. 3A, 3B and 3C). Using the Seahorse analyzer
(Fig. 3D and 3F), we also found that Nrf2−/− adipocytes displayed a slightly higher basal and ATP-linked oxygen consumption rate (OCR), a
significant increase in maximal respiration (Fig. 3E) as well as higher
glycolysis and glycolytic capacity compared to WT adipocytes (Fig. 3G).
Concomitantly, Nrf2−/− adipocytes exhibited higher ATP levels
compared to WT adipocytes (Fig. 3H). The increased ATP originated
from both oxidative phosphorylation, as evidenced by the experiments conducted in the presence of the glycolysis inhibitor 2-deoxyglucose, and glycolysis, revealed by the experiments performed in the presence
of the ATP synthesis inhibitor oligomycin (Fig. 3H). Importantly, a
Table 1
Plasma biochemistry analysis of WT and Nrf2−/− mice on standard (SD) or high
fat diet (HFD). SD HFD WT Nrf2−/− WT Nrf2−/− Glucose (mg/dL) 139.3 ± 11.5 111.3 ±8.4 231.1 ±12.9* 149.4 ±7.9# Insulin (ng/mL) 0.4 ± 0.1 0.3 ± 0.1 1.2 ± 0.2* 0.6 ± 0.1 HOMA-IR 0.8 ± 0.2 0.6 ± 0.2 2.8 ± 0.6* 1.3 ± 0.4 Triglycerides (mg/dL) 143.1 ± 4.8 142.6 ±4.4 137.6 ±4.2 147.5 ±6.3 NEFA (mmol/L) 0.7 ± 0.03 0.7 ± 0.12 0.5 ± 0.06 0.7 ± 0.06 Cholesterol (mg/dL) 45.2 ± 2.2 45.3 ± 2.2 107.8 ±4.9* 68.3 ±5.0*# LDL (mg/dL) 15.8 ± 1.4 14.9 ± 1.0 53.2 ±2.5* 30.2 ±2.4*# HDL (mg/dL) 34.3 ± 1.3 31.8 ± 1.2 53.6 ±1.7* 43.6 ±2.5*# LDL:HDL (arbitrary units) 0.4 ± 0.03 0.5 ±0.02 1.0 ±0.03* 0.7 ±0.03*# ApoA1 (mg/dL) 65.7 ± 1.7 65.5 ± 1.9 89.6 ±2.4* 81.3 ±3.2*# ApoA2 (mg/dL) 13.7 ± 0.9 15.5 ± 0.9 12.1 ± 1.1 20.8 ±1.2*# ApoB100 (mg/mL) 30.4 ± 0.8 31.3 ± 0.8 51.5 ±1.9* 39.2 ±1.4*# Leptin (ng/mL) 2.1 ± 0.7 0.6 ± 0.2* 57.9 ±14.9* 18.0 ± 2.5 Adiponectin (μg/mL) 7.8 ± 0.9 5.3 ± 0.4* 12.3 ±0.7* 14.2 ±0.8*# Resistin (ng/mL) 0.9 ± 0.09 0.5 ± 0.05* 0.5 ±0.07* 0.5 ± 0.04* β-hydroxybutyrate (mmol/L) 0.4 ± 0.05 0.4 ±0.04 0.5 ± 0.04 0.5 ± 0.04 FGF21 (ng/mL) 0.64 ± 0.2 0.78 ± 0.17 1.4 ±0.17* 1.98 ±0.36*# Apo: apolipoprotein; HDL: high densitiy lipoprotein; HOMA-IR. Homeostasic model assessment of insulin resistance; LDL: low density lipoprotein; NEFA: Non-esterified fatty acid; FGF21: fibroblast growth factor 21. Results are shown as mean ± SEM. *p < 0.05 vs. SD WT group; #p < 0.05 vs. HFD WT group.
similar increase in mitochondrial oxygen consumption and glycolytic activity was found in ex vivo adipose tissue punches collected from
Nrf2−/− compared to WT eWAT (Fig. 3I and 3J). These results indicate
that adipocytes from Nrf2−/− mice are more metabolically active in vitro
and ex vivo. Accordingly, Nrf2−/− mice displayed increased plasma
levels of both citric acid and lactic acid compared with WT mice under a
SD regime (Table 2), confirming that Nrf2 deficiency is characterized by
an overall increase in energetic metabolism in adipocytes.
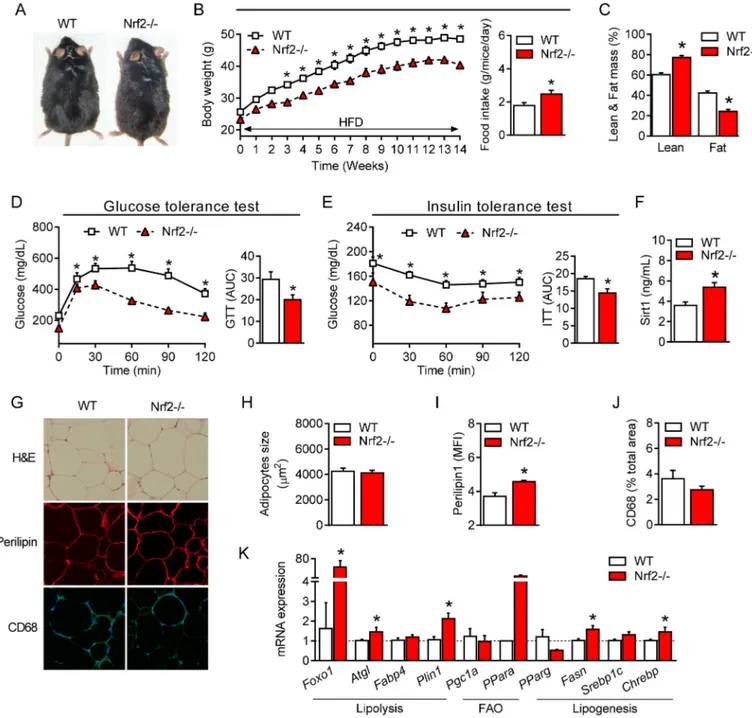
3.4. Improved glucose metabolism and lipid profile in Nrf2-deficient mice fed a high fat diet (HFD)
We next asked whether the beneficial changes in glucose and lipid metabolism promoted by Nrf2 deficiency protect against obesity. For this, WT and Nrf2− /− mice were subjected to a HFD regime for 14
weeks as previously described by our group [2]. As shown in Fig. 4, at
the end of this protocol Nrf2−/− mice displayed a lower body weight
despite having a higher food intake (Fig. 4A and 4B) compared to WT
mice. Nrf2−/− mice also had a higher lean mass and a lower fat mass
(Fig. 4C) as well as improved glucose metabolism and insulin tolerance
compared to their WT counterpart (Fig. 4D and 4E), confirming
previ-ously published data [20]. In line with these findings, Nrf2−/− mice
under HFD showed reduced levels of plasma glycemia and insulin after
fasting and improved HOMA-IR (Table 1). Although plasma triglyceride
and NEFA levels remained unchanged, HDL, LDL, ApoA1, ApoA2 and
ApoB100 were all significantly reduced in Nrf2−/− mice after HFD
(Table 1). As previously reported [22], plasma levels and the hepatic
gene expression of FGF21 were significantly higher in Nrf2−/− mice
(Table 1 and Supplementary Fig. 3G) together with increased circulating
lactic acid and citric acid levels (Table 2). Interestingly, and similarly to
mice fed a SD, Nrf2−/− obese mice maintained significantly higher levels
of plasma Sirt1 compared to WT obese mice (Fig. 4F). No difference in
the size of adipocytes was observed between the two groups (Fig. 4G and
4H) but the visceral adipose tissue of Nrf2−/− mice still displayed a
Fig. 2. Nrf2 deficiency is characterized by enhanced lipolysis and fatty acid oxidation in adipose tissue. (A) Hematoxylin and eosin (H&E) staining of visceral adipose tissue (eWAT) showing differences in size and cell density from WT and Nrf2−/− mice. (B-D) eWAT weight, adipocytes size and cell density based on the H&E
pictures. (E) mRNA expression of genes involved in lipolysis, fatty acid oxidation and lipogenesis in eWAT of WT and Nrf2−/− mice. (F) Western blot analysis of
Foxo1, AMPK-p, AMPK and βactin expression levels from eWAT samples. (G) Representative photographs showing perilipin staining in eWAT and its quantification assessed by mean fluorescence intensity (MFI). (H) Non-esterified fatty acid (NEFA) levels released from eWAT conditioned medium (eCM). (I) Electron microscopy of eWAT from WT and Nrf2−/− mice showing: Nucleus (N), Lipid Droplets (LD), Small Lipid Droplets (SLD), Mitochondria (M), Blood Vessel (BV) and Red Blood Cell
different profile compared to WT. This included increased perilipin
content (Fig. 4G and 4I) and an elevated expression of genes involved in
lipolysis and fatty acid oxidation (Fig. 4K). Moreover, a slight, non
significant, decrease in macrophage infiltration, which is known to contribute to adipose tissue low-grade inflammation during obesity, was
observed in Nrf2−/− mice (Fig. 4G and 4J). Of note, the metabolic
protection afforded by Nrf2 deficiency against HFD was evident not only in the adipose tissue but also in the liver, where our analysis revealed reduced hepatic injury (ALT/AST) and steatosis and decreased
expres-sion of certain genes involved in lipogenesis (Supplementary
Figs. 3A–C). These data support the concept that Nrf2 deficiency coun-teracts the metabolic derangements caused by HFD resulting in improved phenotype of the adipose tissue and other organs such as the liver.
3.5. eWAT removal suppresses the increase in Sirt1 and impairs glucose tolerance in Nrf2-deficient obese mice
Since eWAT of Nrf2−/− mice is the only tissue expressing high Sirt1
levels, we hypothesized that eWAT-derived Sirt1 is responsible for
protecting Nrf2−/− mice against the metabolic disruption caused by
HFD. To test this hypothesis, we directly removed eWAT from WT and
Nrf2−/− mice (eWATectomy) prior to subjecting them to HFD for 8
weeks (see schematic diagram in Fig. 5A). Plasma levels of Sirt1, body
weight and metabolic parameters were assessed at the end of the pro-tocol. Notably, we found that removal of fat completely abolished the increase in circulating Sirt1 characteristic of Nrf2 deficiency to levels
comparable to sham-operated WT mice (Fig. 5B), unequivocally
demonstrating that eWAT is the main source of Sirt1 in Nrf2−/− mice.
Fig. 3. Mitochondrial bioenergetics and glucose metabolism in Nrf2-deficient adipocytes. (A) Immunofluorescence staining for Mitotracker in primary adi-pocytes isolated from eWAT tissue collected from WT or Nrf2−/− mice. (B-C) Citrate synthase (CS) activity and NAD+/NADH ratio in eWAT tissue from WT and
Nrf2−/− mice. (D-E) Oxygen consumption rate (OCR) was measured by a MitoStress assay (Seahorse Analyzer) performed on primary adipocytes with a sequential
addition of oligomycin (O), FCCP, and rotenone/antimycin A (R/AA). (F-G) Extracellular acidification rate (ECAR) was measured by a Glycolytic assay (Seahorse Analyzer) performed on primary adipocytes with a sequential addition of pyruvate (P), Glucose (Glu), Oligomycin (O) and 2-deoxyglucose (2-DG). (H) ATP content in primary adipocytes isolated from eWAT of WT and Nrf2−/− mice. (I-J) OCR and ECAR measured by the Seahorse Analyzer on punches of eWAT collected from WT
Importantly, Nrf2−/− mice subjected to eWATectomy became glucose
intolerant in a manner similar to WT mice under HFD (Fig. 5E) but
retained their enhanced insulin sensitivity in both sham and
eWATec-tomy conditions (Fig. 5D). Moreover, eWATectomy did not affect body
weight gain induced by HFD since Nrf2−/− mice still exhibited lower
body weight gain compared to WT (Fig. 5C). We also found that lactic
acid, which was augmented in Nrf2−/− mice both under SD and HFD
regimes (Table 2), was normalized by eWATectomy to WT levels
(Fig. 5F) while circulating citric acid remained elevated. Circulating lipids were still similar in Nrf2-deficient animals before and after eWATectomy (data not shown). Taken together, these results indicate that Sirt1 produced by eWAT is a critical factor in preserving improved
glucose metabolism in Nrf2−/− mice during obesity.
4. Discussion
Our study reveals for the first time that Nrf2 deficiency in lean and obese mice is characterized by increased systemic levels of Sirt1. We establish the visceral adipose tissue as the sole source of high Sirt1 protein expression that leads to increased Sirt1 plasma levels. We further
demonstrate that removal of eWAT in Nrf2−/− mice restores circulating
Sirt1 to levels of WT mice. Interestingly, we show that Nrf2−/− mice are
protected from insulin and glucose intolerance when subjected to HFD but that, following eWATectomy, insulin sensitivity is maintained while glucose tolerance is completely lost. Our study identifies Sirt1 as a downstream regulator participating to the beneficial effects of Nrf2 deficiency on glucose homeostasis in mice during nutritional stress induced by HFD.
We first observed that lean Nrf2−/− mice exhibited higher lean mass
and lower fat mass than WT mice without significant changes in whole body weight. This difference in body composition was maintained under
HFD but with the important distinction that Nrf2−/− mice gained less
body weight compared to WT obese mice. This is consistent with pre-vious studies reporting a protective role of Nrf2 deficiency in obese mice
through FGF21 overexpression after challenge with HFD [22]. However,
in that study and ours, lean Nrf2−/− mice did not display increased
FGF21 levels and it was unclear why Nrf2 deficiency caused a different body composition even under standard diet. We therefore looked for
other plasma metabolic markers that could explain this difference be-tween the genotypes and discovered that Sirt1 was significantly higher
in the circulation of lean Nrf2−/− mice. By evaluating its gene expression
in different organs, we demonstrated that in Nrf2−/− mice, the visceral
adipose tissue was the only tissue where Sirt1 was elevated compared to WT. We fully validated this finding by showing that this increase was not detected in the liver, muscle, heart, SubWAT and BAT and that circu-lating Sirt1 returned to WT levels when eWATectomy was carried out in
Nrf2−/− mice. Interestingly, Sirt1 levels remained higher also after HFD,
supporting its contribution to the beneficial metabolic adaptation of
Nrf2−/− mice to an obesogenic regime.
It is intriguing that Sirt1 levels increased exclusively in the adipose tissue in response to whole mouse Nrf2 deficiency and a detailed investigation is required to understand the underlying mechanisms. Nevertheless, we speculate that Nrf2 suppresses Sirt1 expression, as indicated also by our preliminary findings showing that silencing Nrf2 with siRNA in 3T3-L1 pre-adipocytes is directly associated with up- regulation of Sirt1 mRNA. Whether this is due to direct control of Sirt1 gene expression by the Nrf2 transcription factor or because Nrf2 deficiency results in higher oxidative stress that in turn may stimulate
Sirt1 [29] is unknown. A very recent report showed that HFD induced
marked oxidative stress in adipose tissue with concomitant increase in
Nrf2 [30], suggesting that oxidative stress may be a participating factor.
These authors also reported that Nrf2 activation promoted lipid
accu-mulation and lipogenesis in adipocytes during obesity [30], supporting
our current results on the beneficial role of Nrf2 deficiency against HFD-mediated lipid dysregulation.
Sirt1 is known to be a key metabolic sensor in various metabolic
tissues [31]. Sirt1 promotes lipolysis via FOXO1 and adipose triglyceride
lipase (ATGL)-dependent mechanisms [28] and stimulates fat utilization
in white adipose tissue by repressing PPARγ [5]. Consistent with this,
our results demonstrated that Nrf2 deficiency led to decreased adipocyte size, increased expression of the lipolysis-related genes Foxo1, Atgl,
Fabp4, Perilipin1 and decreased expression of the adipogenesis gene
PPARγ in both lean and obese mice. A higher lypolysis activity was corroborated by electronic microscopy imaging of visceral adipose
tis-sue showing more numerous lipid droplets in Nrf2−/− than WT mice,
thus indicating a more metabolically active adipose tissue in Nrf2−/−
animals. This effect was accompanied by enhanced mitochondrial oxidative and glycolytic activities in primary adipocytes in vitro and in ex
vivo adipose tissue. Although a previous study on embryonic fibroblast
cells from Nrf2-deficient mice showed an increased oxygen consumption
compared to WT cells [32], other reports have demonstrated a decrease
in oxygen consumption in cells lacking Nrf2 [33] but these studies were
performed on cell types different from adipocytes. Our main findings on gene expression data in different adipose tissue depots, phenotypic and plasma analysis of circulating HDL and LDL as well as apoproteins levels and bioenergetic profile of eWAT strongly support a positive impact of Nrf2 deficiency on systemic metabolism that becomes highly relevant during HFD conditions.
Our work highlights that Sirt1 activation is a crucial adaptive mechanism following the lack of Nrf2, adding to previous investigations which identified increased expression of FGF21 as contributing factor to
the improved metabolic phenotype of Nrf2−/− mice under HFD [22]. We
also found that plasma levels of FGF21 were elevated in Nrf2−/− mice
after HFD and we suggest here that Sirt1 produced by the adipose tissue and FGF21 originating from the liver act in a concerted manner to ameliorate energy homeostasis of Nrf2 deficient animals under HFD. Recent studies report that Sirt1 promotes FGF21 signaling in oxytocin neurons and stimulates oxytocin transcription through Nrf2, contrib-uting to the homeostatic regulation of macronutrient-based diet
selec-tion in mice [34,35]. Thus, we cannot exclude that Sirt1 overproduction
in eWAT of Nrf2−/− mice may also affect FGF21 levels via an endocrine
action on the liver.
Our findings on improved insulin-resistance and glucose intolerance in murine Nrf2 deficiency after HFD are in line with previous studies
Table 2
Plasma energy metabolites in WT and Nrf2−/− mice on standard (SD) or high-fat
diet (HFD). SD HFD WT Nrf2− /− WT Nrf2− /− Keto Acids Pyruvic acid (mmol/L) 0.047 ±0.003 0.056 ±0.009 0.052 ±0.003 0.071 ±0.007 Acetic acid (mmol/L) 0.040 ±0.003 0.089 ±0.011* 0.038 ±0.003* 0.045 ±0.006 Carboxylic Acids
Citric acid (mmol/
L) 0.07 ±0.005 0.14 ±0.004* 0.08 ±0.007 0.11 ±0.005*#
Formic acid
(mmol/L) 0.027 ±0.002 0.029 ±0.002 0.023 ±0.001 0.028 ±0.003 Lactic acid (mmol/
L) 1.5 ± 0.14 2.2 ± 0.015* 1.6 ± 0.08 2.1 ± 0.12* # Amino Acids Alanine (nmol/L) 0.11 ± 0.005 0.16 ±0.007* 0.14 ±0.005* 0.14 ± 0.009 Glutamine (nmol/ L) 0.15 ±0.006 0.25 ± 0.01* 0.23 ±0.01* 0.18 ± 0.01 # Histidine (nmol/L) 0.02 ± 0.004 0.03 ±0.002 0.03 ±0.002 0.03 ±0.002* Leucine (nmol/L) 0.03 ± 0.002 0.03 ±0.003 0.03 ±0.001 0.04 ± 0.002 Valine (nmol/L) 0.05 ± 0.003 0.06 ±0.003 0.06 ±0.003 0.05 ± 0.003
Results are shown as mean ± SEM. *p < 0.05 vs. SD WT group; #p < 0.05 vs. HFD WT group.
[19–22]. Calorimetry assessments have also shown that Nrf2−/− mice under HFD display a significant increase in energy expenditure
compared to WT mice [30,32]. This, combined with our novel data on
Sirt1 overexpression derived exclusively from eWAT, prompted us to
determine the specific role of Sirt1 on metabolism in Nrf2−/− mice.
Because we observed a reduction of Sirt1 to WT levels after eWATec-tomy in Nrf2-deficient mice, we asked ourselves: what would be the
metabolic consequences of subjecting Nrf2−/− mice lacking eWAT to
HFD? Our results clearly demonstrate that following the HFD regime,
Nrf2−/− mice still exhibit improved insulin sensitivity but lose the
pro-tection against glucose intolerance, narrowing down the unique impact
of Sirt1 on glucose metabolism in these conditions. Plasma lactic acid also returned to WT levels after eWATectomy, substantiating the role of
eWAT-derived Sirt1 on glucose metabolism in Nrf2−/− mice and
consistent with a study demonstrating the importance of Sirt1 in glucose
tolerance but not insulin resistance [4]. In contrast, circulating citric
acid remained elevated, indicating that other players, originating from tissues different from eWAT, contribute to metabolic adaptation in
Nrf2−/− mice. These additional factors (including FGF21) likely explain
why Nrf2 deficient animals are still protected from HFD-induced weight gain and insulin resistance even after eWATectomy.
Fig. 4. Improved glucose metabolism, insulin sensitivity and lipid profile in obese Nrf2-deficient mice. (A) Representative photographs of 22-week-old wild- type (WT) and Nrf2-deficient (Nrf2−/−) mice fed a HFD for 14 weeks. (B) Changes in body weight (BW) in WT and Nrf2−/− mice during a 14-week HFD regime. (C)
Percentage of lean and fat mass and (D) plasma levels of Sirtuin 1 (Sirt1) protein in obese WT and Nrf2−/− mice. (E) Glucose tolerance test (GTT) and (F) insulin
tolerance test (ITT) in WT and Nrf2−/− mice after 14 weeks under HFD. (G) Hematoxylin and eosin (H&E) analysis and immunofluorescence staining for perilipin and
CD68 of visceral adipose tissue (eWAT) collected from obese WT and Nrf2-/-mice. (H, I and J) Quantification of adipocyte size, perilipin and CD68 in eWAT of obese
WT and Nrf2−/− mice. (K) mRNA gene expression of genes involved in lipid metabolism in eWAT of obese WT and Nrf2−/− mice. . Values represent the mean ± SEM
5. Conclusions
In conclusion, our study advances our understanding on the role Nrf2 plays in modulating energetic metabolism and identifies novel pathways that are controlled by this master regulator of the stress response. This is the first study reporting a link between Nrf2 deficiency and Sirt1 expression in visceral adipose tissue and their beneficial implications in the regulation of glucose metabolism. The use of Nrf2 inhibitors alone or in combination with other drugs could be an effective therapeutic strategy to counteract the metabolic dysfunction and glucose deregu-lation that characterize diseases such as obesity and type 2 diabetes.
Declaration of competing interest
The authors declare no conflict of interest.
Acknowledgements
This work was supported by a public grant overseen by the French National Research Agency (ANR) as part of the second “Investissements
d’Avenir” programme (CARMMA Project, reference: ANR-15-RHUS- 0003). The NMR instrumentation was supported in part by an NIH grant (S10 RR025677) and Vanderbilt University matching funds. The authors thank Florine Weber and Philippe Druelle for help in the animal facility platform; Xavier Decrouy, Christelle Gandolphe and Wilfried Verbecq- Morlot from the histology platform; Alain Schmitt from the electronic microscopy platform of Institut Cochin; Dr. Costin Radu for kindly showing the surgical procedure to remove adipose tissue (eWATectomy) and St´ephane Moutereau at Henri Mondor Hospital for blood analysis.
Abbreviations
ALT alanine transaminase
AST aspartate transaminase
DMEM Dulbecco’s Modified Eagle Medium
DPBS Dulbecco Phosphate Buffer Solution
ECAR extracellular acidification rate
eWAT epididymal adipose tissue
FBS fetal bovine serum
Nrf2 nuclear factor (erythroid-derived 2)-like 2
Fig. 5. Removal of adipose tissue abolishes the increase in Sirt1 and suppresses the improved glucose metabolism in Nrf2¡/¡obese mice. (A) Schematic
representation of the visceral (epididymal) white adipose tissue removal (eWATectomy) protocol in WT and Nrf2−/− mice. Sham groups underwent the same surgical
procedure without fat removal. After eWATectomy, WT and Nrf2−/− mice were subjected to an 8-week HFD regime before analysis of samples. (B) Plasma levels of
Sirt1 protein in obese WT and Nrf2−/− mice after eWATectomy. (C) Changes in body weight of WT and Nrf2−/− mice without (sham) or with eWATectomy during the
8 week HFD regime. (D) Insulin tolerance test (ITT) and (E) glucose tolerance test (GTT) were performed in WT and Nrf2−/− obese mice after eWATectomy at week 7.
(F) Plasma levels of different metabolites in WT and Nrf2−/− obese mice following eWATectomy. (G) Proposed mechanisms underlying the protective effects of Nrf2
deletion on glucose and lipid metabolism. Values represent the mean ± SEM of n = 10 mice per group. *p < 0.05 indicate statistical difference vs. respective control groups.
GTT glucose tolerance test
HBSS Hanks Balanced Salt Solution
HFD high fat diet
ITT insulin tolerance test
OCR oxygen consumption rate
SD standard diet
SIRT 1 sirtuin-1
Appendix A. Supplementary data
Supplementary data to this article can be found online at https://doi.
org/10.1016/j.redox.2020.101805.
Authors’ contribution
L.B., R.F. and R.M. designed the study, performed experiments, collected and analyzed data and wrote the manuscript. L.B. and M.P. performed metabolic tests and their analysis. D.F.S. and D.E.S. per-formed metabolomic analysis of keto acids, carboxylic acids and amino acids as well as analysis of plasma lipids. S.M. performed RNA and protein extractions, ELISA and immunostaining. G.D. read the manu-script. R.M. is the guarantor of this work and, as such, had full access to all the data in this study and takes responsibility for the integrity of the data and the accuracy of the data analysis.
References
[1] T. Ronti, G. Lupattelli, E. Mannarino, The endocrine function of adipose tissue: an update, Clin. Endocrinol. (Oxf.). 64 (2006) 355–365, https://doi.org/10.1111/ j.1365-2265.2006.02474.x.
[2] L. Braud, M. Pini, L. Muchova, S. Manin, H. Kitagishi, D. Sawaki, G. Czibik, J. Ternacle, G. Derumeaux, R. Foresti, R. Motterlini, Carbon monoxide–induced metabolic switch in adipocytes improves insulin resistance in obese mice, JCI Insight 3 (2018), https://doi.org/10.1172/jci.insight.123485.
[3] L. Qiang, L. Wang, N. Kon, W. Zhao, S. Lee, Y. Zhang, M. Rosenbaum, Y. Zhao, W. Gu, S.R. Farmer, D. Accili, Brown remodeling of white adipose tissue by SirT1- dependent deacetylation of Pparγ, Cell 150 (2012) 620–632, https://doi.org/ 10.1016/j.cell.2012.06.027.
[4] P.T. Pfluger, D. Herranz, S. Velasco-Miguel, M. Serrano, M.H. Tsch¨op, Sirt1 protects against high-fat diet-induced metabolic damage, Proc. Natl. Acad. Sci. Unit. States Am. 105 (2008) 9793–9798, https://doi.org/10.1073/pnas.0802917105. [5] F. Picard, M. Kurtev, N. Chung, A. Topark-Ngarm, T. Senawong, R.M. de Oliveira,
M. Leid, M.W. McBurney, L. Guarente, Sirt1 promotes fat mobilization in white adipocytes by repressing PPAR-γ, Nature 429 (2004) 771–776, https://doi.org/ 10.1038/nature02583.
[6] J.T. Rodgers, C. Lerin, W. Haas, S.P. Gygi, B.M. Spiegelman, P. Puigserver, Nutrient control of glucose homeostasis through a complex of PGC-1alpha and SIRT1, Nature 434 (2005) 113–118, https://doi.org/10.1038/nature03354.
[7] Y. Li, K. Wong, A. Giles, J. Jiang, J.W. Lee, A.C. Adams, A. Kharitonenkov, Q. Yang, B. Gao, L. Guarente, M. Zang, Hepatic SIRT1 attenuates hepatic steatosis and controls energy balance in mice by inducing fibroblast growth factor 21, Gastroenterology 146 (2014) 539–549, https://doi.org/10.1053/j. gastro.2013.10.059, e7.
[8] S. Li, G. Zhao, L. Chen, Y. Ding, J. Lian, G. Hong, Z. Lu, Resveratrol protects mice from paraquat-induced lung injury: the important role of SIRT1 and NRF2 antioxidant pathways, Mol. Med. Rep. 13 (2016) 1833–1838, https://doi.org/ 10.3892/mmr.2015.4710.
[9] A.T. Dinkova-Kostova, W.D. Holtzclaw, R.N. Cole, K. Itoh, N. Wakabayashi, Y. Katoh, M. Yamamoto, P. Talalay, Direct evidence that sulfhydryl groups of Keap1 are the sensors regulating induction of phase 2 enzymes that protect against carcinogens and oxidants, Proc. Natl. Acad. Sci. Unit. States Am. 99 (2002) 11908–11913, https://doi.org/10.1073/pnas.172398899.
[10] N. Wakabayashi, A.T. Dinkova-Kostova, W.D. Holtzclaw, M.-I. Kang, A. Kobayashi, M. Yamamoto, T.W. Kensler, P. Talalay, Protection against electrophile and oxidant stress by induction of the phase 2 response: fate of cysteines of the Keap1 sensor modified by inducers, Proc. Natl. Acad. Sci. Unit. States Am. 101 (2004) 2040–2045, https://doi.org/10.1073/pnas.0307301101.
[11] E. Balogun, M. Hoque, P. Gong, E. Killeen, C.J. Green, R. Foresti, J. Alam, R. Motterlini, Curcumin activates the haem oxygenase-1 gene via regulation of Nrf2 and the antioxidant-responsive element, Biochem. J. 371 (2003) 887–895,
https://doi.org/10.1042/bj20021619.
[12] A. Cuadrado, A.I. Rojo, G. Wells, J.D. Hayes, S.P. Cousin, W.L. Rumsey, O. C. Attucks, S. Franklin, A.-L. Levonen, T.W. Kensler, A.T. Dinkova-Kostova, Therapeutic targeting of the NRF2 and KEAP1 partnership in chronic diseases, Nat. Rev. Drug Discov. 18 (2019) 295–317, https://doi.org/10.1038/s41573-018-0008- x.
[13] N. Keleku-Lukwete, M. Suzuki, A. Otsuki, K. Tsuchida, S. Katayama, M. Hayashi, E. Naganuma, T. Moriguchi, O. Tanabe, J.D. Engel, M. Imaizumi, M. Yamamoto,
Amelioration of inflammation and tissue damage in sickle cell model mice by Nrf2 activation, Proc. Natl. Acad. Sci. Unit. States Am. 112 (2015) 12169–12174,
https://doi.org/10.1073/pnas.1509158112.
[14] M. Yamamoto, T.W. Kensler, H. Motohashi, The KEAP1-NRF2 system: a thiol-based sensor-effector apparatus for maintaining redox homeostasis, Physiol. Rev. 98 (2018) 1169–1203, https://doi.org/10.1152/physrev.00023.2017.
[15] J.D. Hayes, A.T. Dinkova-Kostova, The Nrf2 regulatory network provides an interface between redox and intermediary metabolism, Trends Biochem. Sci. 39 (2014) 199–218, https://doi.org/10.1016/j.tibs.2014.02.002.
[16] S. Shin, J. Wakabayashi, M.S. Yates, N. Wakabayashi, P.M. Dolan, S. Aja, K.T. Liby, M.B. Sporn, M. Yamamoto, T.W. Kensler, Role of Nrf2 in prevention of high-fat diet-induced obesity by synthetic triterpenoid CDDO-imidazolide, Eur. J. Pharmacol. 620 (2009) 138–144, https://doi.org/10.1016/j.ejphar.2009.08.022. [17] Y. Yagishita, A. Uruno, T. Fukutomi, R. Saito, D. Saigusa, J. Pi, A. Fukamizu,
F. Sugiyama, S. Takahashi, M. Yamamoto, Nrf2 improves leptin and insulin resistance provoked by hypothalamic oxidative stress, Cell Rep. 18 (2017) 2030–2044, https://doi.org/10.1016/j.celrep.2017.01.064.
[18] A. Uruno, Y. Furusawa, Y. Yagishita, T. Fukutomi, H. Muramatsu, T. Negishi, A. Sugawara, T.W. Kensler, M. Yamamoto, The Keap1-Nrf2 system prevents onset of diabetes mellitus, Mol. Cell Biol. 33 (2013) 2996–3010, https://doi.org/ 10.1128/MCB.00225-13.
[19] Z. Liu, W. Dou, Z. Ni, Q. Wen, R. Zhang, M. Qin, X. Wang, H. Tang, Y. Cao, J. Wang, S. Zhao, Deletion of Nrf2 leads to hepatic insulin resistance via the activation of NF-κB in mice fed a high-fat diet, Mol. Med. Rep. 14 (2016) 1323–1331, https:// doi.org/10.3892/mmr.2016.5393.
[20] J. Pi, L. Leung, P. Xue, W. Wang, Y. Hou, D. Liu, E. Yehuda-Shnaidman, C. Lee, J. Lau, T.W. Kurtz, J.Y. Chan, Deficiency in the nuclear factor E2-related factor-2 transcription factor results in impaired adipogenesis and protects against diet- induced obesity, J. Biol. Chem. 285 (2010) 9292–9300, https://doi.org/10.1074/ jbc.M109.093955.
[21] L. Zhang, K. Dasuri, S.-O. Fernandez-Kim, A.J. Bruce-Keller, J.N. Keller, Adipose- specific ablation of Nrf2 transiently delayed high-fat diet-induced obesity by altering glucose, lipid and energy metabolism of male mice, Am. J. Transl. Res. 8 (2016) 5309–5319.
[22] D.V. Chartoumpekis, P.G. Ziros, A.I. Psyrogiannis, A.G. Papavassiliou, V. E. Kyriazopoulou, G.P. Sykiotis, I.G. Habeos, Nrf2 represses FGF21 during long- term high-fat diet-induced obesity in mice, Diabetes 60 (2011) 2465–2473,
https://doi.org/10.2337/db11-0112.
[23] Y.-K.J. Zhang, K.C. Wu, J. Liu, C.D. Klaassen, Nrf2 deficiency improves glucose tolerance in mice fed a high-fat diet, Toxicol. Appl. Pharmacol. 264 (2012) 305–314, https://doi.org/10.1016/j.taap.2012.09.014.
[24] S. Lee, R. Muniyappa, X. Yan, H. Chen, L.Q. Yue, E.-G. Hong, J.K. Kim, M.J. Quon, Comparison between surrogate indexes of insulin sensitivity and resistance and hyperinsulinemic euglycemic clamp estimates in mice, Am. J. Physiol. Endocrinol. Metab. 294 (2008) E261–E270, https://doi.org/10.1152/ajpendo.00676.2007. [25] P.A. Hosick, A.A. AlAmodi, M.W. Hankins, D.E. Stec, Chronic treatment with a
carbon monoxide releasing molecule reverses dietary induced obesity in mice, Adipocyte 5 (2016) 1–10, https://doi.org/10.1080/21623945.2015.1038443. [26] Terry D. Hinds Jr., Peter A. Hosick, Shujuan Chen, Robert H. Tukey, Michael
W. Hankins, Andrea Nestor-Kalinoski, David E. Stec, Mice with hyperbilirubinemia due to Gilbert’s syndrome polymorphism are resistant to hepatic steatosis by decreased serine 73 phosphorylation of PPARα, Am. J. Physiol. Endocrinol. Metab.
312 (2017) E244–E252, https://doi.org/10.1152/ajpendo.00396.2016. [27] M. Petersen, M. Dyrby, S. Toubro, S.B. Engelsen, L. Nørgaard, H.T. Pedersen,
J. Dyerberg, Quantification of lipoprotein subclasses by proton nuclear magnetic resonance-based partial least-squares regression models, Clin. Chem. 51 (2005) 1457–1461, https://doi.org/10.1373/clinchem.2004.046748.
[28] P. Chakrabarti, T. English, S. Karki, L. Qiang, R. Tao, J. Kim, Z. Luo, S.R. Farmer, K. V. Kandror, SIRT1 controls lipolysis in adipocytes via FOXO1-mediated expression of ATGL, J. Lipid Res. 52 (2011) 1693–1701, https://doi.org/10.1194/jlr. M014647.
[29] A. Salminen, K. Kaarniranta, A. Kauppinen, Crosstalk between oxidative stress and SIRT1: impact on the aging process, Int. J. Mol. Sci. 14 (2013) 3834–3859, https:// doi.org/10.3390/ijms14023834.
[30] X. Sun, X. Li, H. Jia, H. Wang, G. Shui, Y. Qin, X. Shu, Y. Wang, J. Dong, G. Liu, X. Li, Nuclear factor E2-related factor 2 mediates oxidative stress-induced lipid accumulation in adipocytes by increasing adipogenesis and decreasing lipolysis, Antioxidants Redox Signal. (2019), https://doi.org/10.1089/ars.2019.7769. [31] X. Li, SIRT1 and energy metabolism, Acta Biochim. Biophys. Sin. 45 (2013) 51–60,
https://doi.org/10.1093/abbs/gms108.
[32] K. Schneider, J. Valdez, J. Nguyen, M. Vawter, B. Galke, T.W. Kurtz, J.Y. Chan, Increased energy expenditure, Ucp1 expression, and resistance to diet-induced obesity in mice lacking nuclear factor-erythroid-2-related transcription factor-2 (Nrf2), J. Biol. Chem. 291 (2016) 7754–7766, https://doi.org/10.1074/jbc. M115.673756.
[33] A.T. Dinkova-Kostova, A.Y. Abramov, The emerging role of Nrf2 in mitochondrial function, Free Radic. Biol. Med. 88 (2015) 179–188, https://doi.org/10.1016/j. freeradbiomed.2015.04.036.
[34] T. Sasaki, T. Kitamura, Roles of FoxO1 and Sirt1 in the central regulation of food intake, Endocr. J. 57 (2010) 939–946, https://doi.org/10.1507/endocrj.k10e-320. [35] S. Matsui, T. Sasaki, D. Kohno, K. Yaku, A. Inutsuka, H. Yokota-Hashimoto,
O. Kikuchi, T. Suga, M. Kobayashi, A. Yamanaka, A. Harada, T. Nakagawa, T. Onaka, T. Kitamura, Neuronal SIRT1 regulates macronutrient-based diet selection through FGF21 and oxytocin signalling in mice, Nat. Commun. 9 (2018),