Publisher’s version / Version de l'éditeur:
Vous avez des questions? Nous pouvons vous aider. Pour communiquer directement avec un auteur, consultez la
première page de la revue dans laquelle son article a été publié afin de trouver ses coordonnées. Si vous n’arrivez pas à les repérer, communiquez avec nous à [email protected].
Questions? Contact the NRC Publications Archive team at
[email protected]. If you wish to email the authors directly, please see the first page of the publication for their contact information.
https://publications-cnrc.canada.ca/fra/droits
L’accès à ce site Web et l’utilisation de son contenu sont assujettis aux conditions présentées dans le site LISEZ CES CONDITIONS ATTENTIVEMENT AVANT D’UTILISER CE SITE WEB.
Laboratory Technical Report (National Research Council of Canada. Structures and Materials Laboratory, National Aeronautical Establishment); no. LTR-ST-1263, 1981-05-21
READ THESE TERMS AND CONDITIONS CAREFULLY BEFORE USING THIS WEBSITE. https://nrc-publications.canada.ca/eng/copyright
NRC Publications Archive Record / Notice des Archives des publications du CNRC :
https://nrc-publications.canada.ca/eng/view/object/?id=3a55b02f-aa9e-4624-8807-cc5c457410f7 https://publications-cnrc.canada.ca/fra/voir/objet/?id=3a55b02f-aa9e-4624-8807-cc5c457410f7
Archives des publications du CNRC
For the publisher’s version, please access the DOI link below./ Pour consulter la version de l’éditeur, utilisez le lien DOI ci-dessous.
https://doi.org/10.4224/23004889
Access and use of this website and the material on it are subject to the Terms and Conditions set forth at
Tracker fatigue test: load analysis and discussion
I+
National ResearchCouncH Canada
Conseil national
de
recherches canacta
NATIONAL AERONAUTICAL ESTABLISHMENT
LABORATORY TECHNICAL REPORT
LTR - ST - 1263 TRACKER FATIGUE TEST: LOAD ANALYSIS AND DISCUSSION
G.F.W. MCCAFFREY
RAPPORT TECHNIQUE OE LABORATOIRE
ETABLISSEMENT AltRONAUTIQUE NAT IONAL
21 MAY 1981
TRACKER FATIGUE TEST - LOAD ANALYSIS AND DISCUSSION
1.0 In t r o d uct i on:
In gene r al , the planning and execution of t his test are considered to have been conducted in a very satisfactory manner. The test conc e pt can be considered an evolutionary d eve l o pment of t hose used in similar t e sts of the CF l OO a nd CL41 airframe s . The main purpose of the present report is to highlight some problems, particu l arly those stemming fr o m t he high - wing configuration of the aircraft and the method o f programming t he random loading . This shou l d assist i n inte rpre ting the results of this test and p l anning futur e t e sts of a similar nature.
This will be accomplished by presenting a d escr i pt i on of t h e natu re o f the investigation and an analysis of the
measured loads, for comparison wi t h the design loads, followed
b y a discussion of certain aspects of this test and similar t e sts of other high- wing aircraft.
2.0 I nvest i gation and Analysis of Load s :
2.1 The general approach adopt ed has been to mo n i tor t h e day - to - day operat i on of the test by observing a l arge number of outputs which are present ed as pen recorder traces, typed print-outs or digital vol t ages . From time to t i me a "data set" which includes all loads , stra i ns and deflection measurements is recorded. Thes e a r e tak en on an " as required" basis, such as be f ore a scheduled wing removal or because of any unusual noise from, or crack i ng of, the structure or any unusual out-put from the monitoring instrumentation .
2 . 2 Norma l ly a data set is taken by comman ding a number of halts at "end - of - cycle" so as to obtain a reasonab l e d ispe r sion of t he f l ight load magnitudes over the avail-able range (from - 0.246g to 3.844g) . Strain gauge
circuits are set to zero at the lg (ground) condit ion . The load i s held at each selected load for the
approx imately 2 minute s requi red to record data. Many load cycle s (or even flights) may occur before another load is selected .
In the first few week s of testing a number of p r oblems were identified and eliminated. Among these were:
(a) An appare nt asymmetry of over - wing load, of
approximately 2 1/2%, which was the resu l t of the use of an incorrect "shunt" in establishing the load-cell bridge sensitivity .
2 •
(b) Incorrect magnitude of the under - fuselage load whi ch required re-calibration of the load-cell and
provision of an independe nt shunting resistor for sensitivity calibrations, as well as a minor
correction to the load equation for the actuator . (This load system is the only one wh i ch has the load cell not directly in series wi th its actuator).
(c) Loss of amplitude at the smaller flight loads of the under - nacelle loads. This was cured by the use of the re - set integrators which were provided on the control console but had not been used. Their purpose i s to provide variable gain (with frequency) which is particularly nec es sary in "bucking" loads such as this which move through very small distances when the main loading actuators are cycling at high fre -quency (small flight loads).
2.3 As these , and some lesser problems , were eliminated and sets o f "clean" data became available i t was apparent that the over - wing load cells were consistently measur ing loads which were some 5 percent lower than the design value, although they a ppeared to be linear. Initially this tended to be treated as inconsequential since the
accuracy of the applied loads was confirmed to be excellent. However, since the magnitude of the over-wing reaction
(and to a less e r extent the under- wing load) determine the bending - moment at the {assumed) critical region o f · the wing i . e ., wing stations 145 to 173 ins., further investigation seemed desirable .
In attempting to analyse the over-wing load i t became necessary to also focus on the nose pivo t load
(the only other reaction) which was being measured but whos e magnitude was known to be almost inconsequential. Closer examination of the collected data revealed t ha t the r e corded load was i nc l i ned to be rather erratic for any p articular set of data and showed a s t eady drif t to lower values (of compressive load) over consecutive sets of data.
After elimination of the latter problem by
replacement of the amplifier used in the weighing circuit and re - estab li shment of the true zero load (by removal of the attachment pin) an investigation was undertak e n to attempt to clari f y the true value of the nose reac t ion over the range of app l ied l oads . Since i t was appa r ent that t he dynamometer was being subjected to considerab l e bending momen t as well as direct l oad (as a result of its ins t a l lation geometry), the investigation i nit i ally was concentrated on the effects of this .
The original dynamometer was rep l aced by another which was cons i dered less sensitive to the ef fects of bending and a ser i es o f ad hoc tes t s begun in which the l ocat i o n of the strain gauges on t he dynamometer was systematically oriented to minimize and maximize the bend i ng e f fect. No significant bending sensitivity was identified.
From these tests a pattern of load versus f light g l e vel emerq e d which showed two separate cur ved branches - o ne above lg flig h t and t he other below , with a v er y distinct discontinuity at l g which was determined to d e pend on whether the lg load was selected during
" l and i ng" or "taking- off . " This finding , in conjunction wi th conside r ation of the nature of the load i ng progr amme
4 .
confirmed that the two branches of the nose reaction curve
·ere the r esult of only be i ng abl e to se l ect loads above
lg flight from an i ncreasing load and those below lg fr om
a decreasing load i .e., from the upper and lower limbs re spe ctively of a comp lete hysteresis loop .
2 . 4 An imp ortant subsidiary discovery made during the ad hoc te s ts described in section 2.3 was the existence of a progranuning error in the treatment of the " zero" load for ~he over - wing load cells. This became apparent when
comparing manually-reduced loads to those produced by computer processing of the raw data.
It had been appreciated for some time, by visual observation, that the line of action of the over - wing react ion moved from a forward-of - vertical position at low =l i ght loads to an aft-of - vertical position a t the larger loads but attempts to achieve a balance of loads and
noments had only achieved a limited degree of success due
to the various discrepanci e s which have been discussed above . It now seemed likely that such a balanc e would be po ssible and with this in mind a larger than normal
amount of load data was recorded in the next data set before the removal of the wi ngs for the 50,000 hr. inspection. Thi s set has been identified as Fli g ht
13 8 63---..r.
The analysi s which is now described a pplies specif -ically to this set of data but, with minor alterations, is believed to be representative of all sets. The
princi p al object of the analysis is to determine the
va riation with flight g level of the moment arm about the nose pivot of t he over- wing react ion s and from this and the known magnitude and moment arms of applied loads to deduce the over - wing reactions for comparison with the Mea sured values . In additi on by summing algebraically all vertical l oads the theoretical nose reac tion is
deter~ined. The effects of lack- of - verticality of a pp lied loads has been ignored since the geometry changes a re small
and the magnitude of the load is maintained by closed-loop (active) systems .
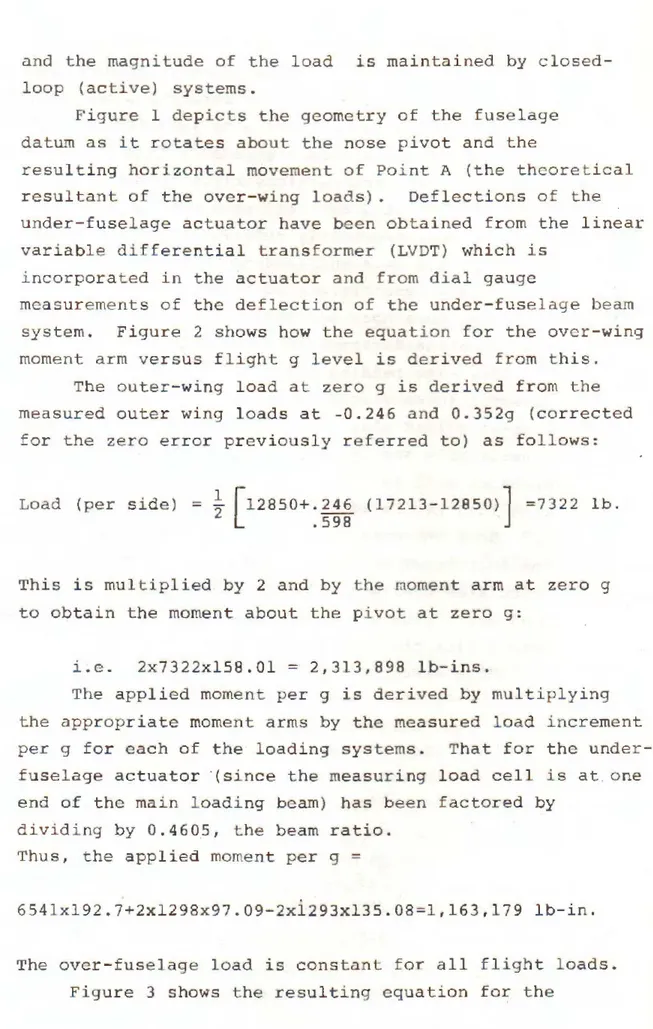
Figure 1 depicts the geometry of the fuselage datum as i t rotates about the nose pivot and the
resulting horizontal movement of Point A (the theore t ical resultant of the over- wing loads). Deflections of the under-fuselage actuator have been obtained from the linear variable differential transformer (LVDT) which is
incorporated in the actuator and from dial gauge
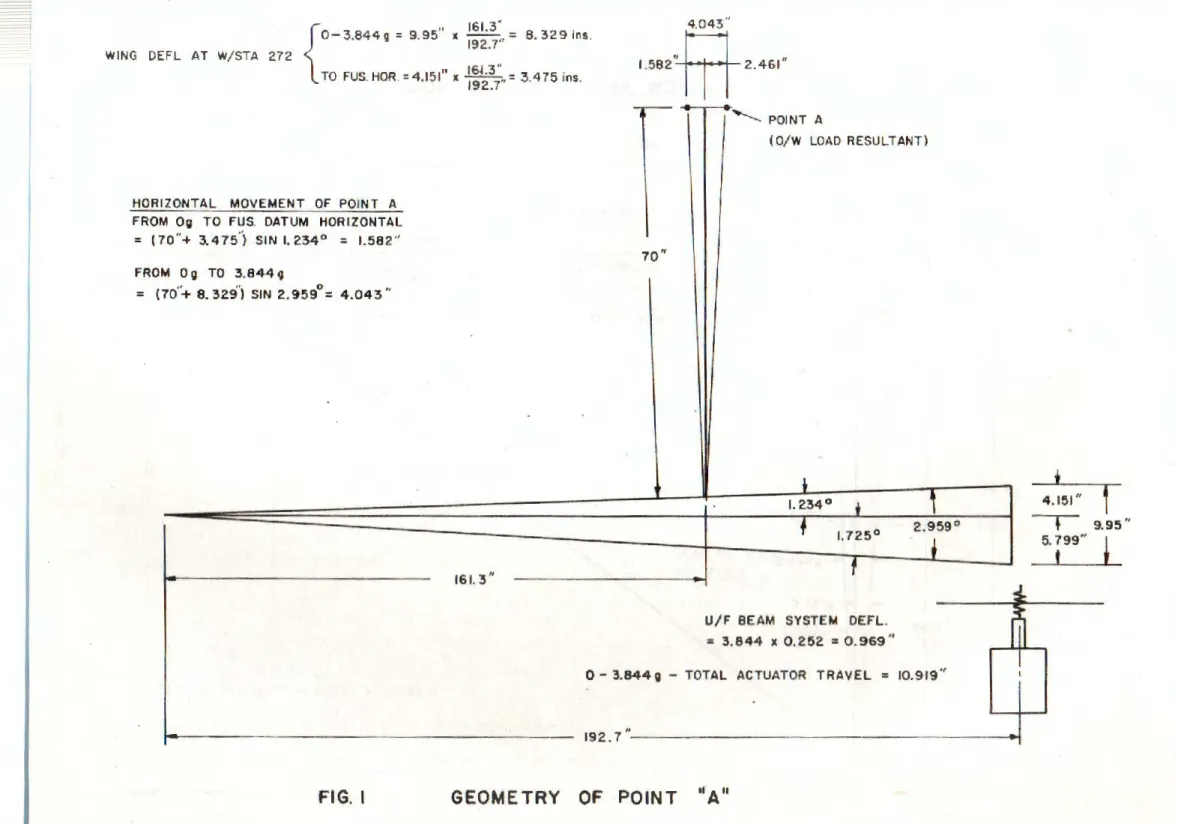
measurements of the deflection of the under - fuselage beam system . Figure 2 shows how the equation for the over-wing moment arm versus flight g level is derived from this.
The outer - wing load at zero g is derived from the measured outer wing loads at - 0.246 and 0.352g (corrected
for the zero error previously referred to) as follows:
Load (per side)
=}
[ 12aso+ . 246 (17213-12850)] =7322 lb . . 598This is multiplied by 2 and by the moment arm at zero g to obtain the moment about the p i vot at zero g:
i.e. 2x7322xl58 . 0l = 2,3)3,898 lb-ins .
The applied moment per g is derived by multiplying the appropriate moment arms by the measured load increment per g for each of the loading systems. That for the under -fuselage actuator ·(since the measuring load cell is at one end of the main loading beam) has been factored by
dividing by 0.4 6 05, the beam ratio . Thus, the applied moment per g =
654lxl92.7+2xl298x97.09 - 2xl293xl35 . 08=1,163 , 179 lb- in.
The ovc r- fuse]age load is con s tant fo r all fligh t loads. Figure 3 shows the resulting equation for the
calculated load and t he plot ted curve which r es ul t s. Superimpo s ed on this ar e the discrete points measured in data set 13863 ~ , and the s t raig ht line 7300+3613n which is th e predicted ove r-wing loa d from L~R- ST-10 71 . It can be seen that the disc repancy fr om the design
6.
l o ad is signifi c an t particularly at the higher loads (3 . 69 p ercent at 3 . 84 g) and when combi ned with the "zero " error , previou sly refer r ed t o , would amoun t t o 5 . 43% i n this data set (and up to 6 . 5% i n ot he~ sets). Fortun ately , the " ze ro error" portion is a conputational error and does not reo resen t a discrepancy of the test
--
-load f rom the design (p redic ted) -load .
The
wing
b e nding moment at the crit i cal station (assumed to be w.sta. 145 to 173) is p roduced by the over-wing load plus the under- wing load (which is consider ably smaller) so t hat t he bending moment di screpancy wi l l b e less than 3 . 69 p ercent, sinc e the under -wi ng load has no appreciable e rror .2 . 5 On ce t h e over-wing l o ad curve has been es t ablished the nose reac t ion can be calculated by deduct ing the calc ulated over - wing load from . the sum of th e applied load per g plu s a consta nt which is the applied load at z e ro g plus the tare loads . The re su lting equation is :
Nos e Re action= 248 44 +655ln - 7438-2
°;w
=
17406+655ln - 2 °;w derived as follows: Load At Og U/Fus .=
U/Nac (2)=
U/W ( 2)=
0Tare (Inc /Fus Beam)= To tal = 2572 lb . 1342 lb . 10360 lb . 10570 lb . 24844 lb .
o/Fus .
=
74 38 l b . ( Inc . 0/ Fu s . Beam) --- Const ant_ for all F light conditions . Net applied l o ad per g =7 h i s curve
i s
plotted in Figure 4 as wel l a s adashed curve (below lg f l ight) which is drawn 250 lb . below the calculated curve to re f lect the fact tha t t he measured over - wing hysteresis is 250 lb. at l g flight which is the only co ndition at which i t can be measured directly, as explained in Sec. 2 . 3.
The plotted points from data set 13.863 _... as we l l as another set measured with the dynarnorneter strai n gauges rotated 90 degrees (gauges on the neutral axis ) are shown superimposed on the plotted curves. Co n s ider ing the scale of this plot and the magnitude of the a p p l i ed loads the agreement is considered reasonabl e . The strai ght l ine i dentif i ed as 3062 - 662n is the nose reaction
predicted in LTR- ST- 1071, which assumed a linear over-wing reaction versus g level relationship .
3.0 Di scussion:
A number o f i mpor t ant f indings have flowed from th i s i nvestigation and analysis wh i ch are recorded here for the benef i t of anyon e wishing to examine the matter further and to assist in planning similar tests and in interpreting the outcome of this test upon its completion.
3.1 This section dea l s with general points that are n ot specific to the Tr acker (or other high-wing aircra ft ) test.
(a) Desirably, prov i sion should be made for achievi ng a "free- in - air zero" condition for all dynamometers in addition to a sensitivity calibra t ion, by shunt i ng the bridge. As an alterna t ive, some well-defined loaded condition, which can be accurate l y repe a t ed , may be used for routine checks provided a true z e r o load condition is available when required.
( b) Dynarnorneters should not be used in comp r ession
except as a last r e sort; but, if they are the des ign of the installation should e n sure that the measuri ng
I
I
I
I
I
I:
I
I
element is not subjected to bending . This, of course, also applies to tension dynamometers but, in general, is more easily achieved.
(c) In planning programmed loading, provision should always be made for reversion to unrestricted, incremental loading , as and when required. Th is should include the ability to set any load
(except the highest and lowest) from any higher or lower load .
8.
3.2 The following comment s are specific to the Tracker
fa t igue test (or tests of simi lar high-wing configurations). (a) As a result of the high - wing configuration of the
aircraft and the use of the nose landing gear pivot axis as a f ixed reaction point, the line of action of the over - wing force unde rgoes a substantial angular change with change in applied load , as the fuselage rotates about the pivot. In the case of this aircraft, this results in a change in the moment arm of this fo r ce about the pivot of some 8.7 inches over the flight spectrum , with the direct result that the over - wi ng reaction is reduced by some 5.4% as the moment arm increases even though the applied loads (and hence moments) are as specifi e d.
A number of alternative arrangeme nts could be adopted to obviate this problem, such as:
(i) P rovi sion of an active {actuator and load cell) nose loading point
(ii) Provision of a passive nose loading point with fore and aft freedom (e.g. hang ing by cable anchored overhead)
(iii) Provision o f (b) and in addition a "soft" spring against vertical l o ad to maintain an essentially leve l fuselage attitude. For examp le, this
could also be accomplished by leaving the nose landing gear and wheels in place, wi th the tire
N.B.
and oleo pressures suitably adjusted and by provision of a "weighing" platform allowing the wheels to move fore and aft to compensate for any inadvertent horizonta l loading while measuring the vertical react i on.
For any of (a), (b) and (c) a method of resist ing loads in the opposite direction should be provided to facilitate erection and maintenance. This could be simply a cable tie or a slotted bar or rod.
(iv ) Provision of the same set-up as in the Tracker test with careful design of the nose attachment so that fore and aft l oads are resisted on the c en tre line of the pivot axis and therefore do no t result in bending of the dynamometer. This approach also requires that the deflection of the wing relative to the fuselag e be known with reasonable accuracy so that the applied loads can be adjusted to compensate fo r non-verticali ty of the over - wing reaction fo rce during loadi ng . (v) Adoption of the traditional approach (which is
not wi thout penalties) of anchor i ng the fuselage in a fixed attitude and applying all o ther loads through ac t ive systems.
3.3 The second source of difficulty which was revealed in the analysis might b e described as more apparent t han real although its existence could only be identified by
t he very careful examination of the data s e ts required to b a lance the measured loads and moments.
It is intended (LTR-ST-1071) that the over-wing load cells indicate zero load when carrying the weight of the over-wing beam system. Since t here
i s
no method providedto check this precisely or to check the fr ee -in-air zero of the load cell, the reduct ion of dat a (by computer) ha,J, been programmed to treat the "lg" ground condition as
10.
zero and to deduct this reading from the data before conversion of the bridge voltage to pounds (force). Fortunately, the zero of the system appears to have remained relatively stable with the indicated "lg"
ground load ranging from 200 to 600 lb. (16 to 48 milli-vol ts) per side over the recorded sets of data. The "correct" lg ground load should be (LTRST107 1
-Table X) 1864 - 996-499 = 369 lb. which is equivalent to 29.5 millivolts. Thus, in general, a better approxim-ation to the "true" load wou ld be to either ignore the lg ground reading completely (since i t is often close to 29 . 5 mil l ivolts) or alternatively to revise the data-reduct ion progranune , to corr ect only for departures from 29.5 mill ivol ts at the lg ground condition. The second approach has more technical merit and has been adopted. For practical reasons, i t has been accomplished by
subtrac t ing 60 from the combined lg (ground) bridge voltages, dividing by 2 and treating the resultant as a zero correction for each of the over-wing loads.
3.4 The third source of confusion in analysis of the tracker data has to do with our inabil ity to command load l evels to permit incremental loading for data recording purposes i.e ., applied loads , reactions and strain
gauge and deflection measurements. In practice, these are read by halting the test at the end of a cycle. This means that flight loads less than lg are al ways
a p proached from a higher load and those above lg are always approached from a lower load and that lg is the only flight condition which can be set from a higher or a lower load. In the case of the former i t is usually only a very slightly higher load simply because of the very large numbers of these. A slightly more subtle source of confusion is that due to the pairing of loads in the programme , some loads are always or almost always preceded by the same load which may be close to it.
For example, 0 .9 7g always fol lows 1.303g and because of the high relative frequency of this load pair , 1 .303g a lmost always follows 0 .979.
In effect , this means that loads above lg
flight are read from the upper limb of the hysteresis loop and loads below lg from the l ower limb, with lg flight the only one capable of directly showing the magnitude of the hysteresis. In the data recorded as F L 13863, for example , both lg "taking- off" and lg
"landing" were r ecorded and while the recorded applied loads are identical e xc ep t fo r a difference of 11 lb., in the under - west-wing load , the re are substantial differences in the measured over - wing and nose
dynamometer loads and in the over - fuselage and under-fuselage deflections and, as would be expected, in the strain gauge readings . These can be used to provide some " scale " to the width of the hysteresis loop which appears to be approximately equivalent to O.lg.
3 .5 Early in the investiga tion, plotting of the recorded nose dynamometer load had reve aled a steady decline from a mid-range (1.5g Flighti value of approximately 2400 lb. , to 600 lb. , with r oughly the same shape prevailing .
The exact cause of th is is not known but is presumed to have resulted from drif t of the amplifier ove r many months (from FL 2731 to FL 13075). The zero of the
system was not checked dur i ng th is period. The dynarnometer and amplifier were changed during the ad hoc inve
stig-ation carried out in February/March 1981 and a technique dev eloped fo r checking the true zero of the load.
4.0 Conclusions:
4 . 1 The Tracker Fa tigue Test loading system has performed in a very satisfactory manner over 50,000 simulated flight hour s of te sting .
4 . 2 The i nve stigation and analysis reported herein ha s exami ned a number of anomalous findings wh i ch
were ide ntified during the course of the test and the resu lts are included .
4 . 3 Th e r eport also presents some comments, fo r futur e
re f ere nce , reg arding the Tracker test and full sca l e fa t ig u e tests, i n general, wi t h p articular re f ere n c e to t e sts o f should er-wing (or high-wing) aircraft.
REFERENCE: Nationa l Research Council of Canada (N.A. E .) LTR-ST- 1 07 1 - Tracker Fatigue Tes t Analysis
12 .
4 . 2 The investigation and analysis reported herein
has examined a number of anomalous findings which were identified during the course of the test and
~he results are included.
4 . 3 The report also presents some comments, for future reference , regarding the Tracker test and full scale fatigue tests, in general, with particula r reference to tests of shoulder-wing (or high-wing) aircraft.
REFERENCE : National Research Council of Canada (N.A .E.) LTR- ST-1071 - Tracker Fatigue Test Analysis of Loading Systems - J. F. deWaal, March, 1979.
{
" 151.3 • 8 329 '
0-3.844g=9. 95 ,c
192_7,,= . ins .
WING DEFL AT W/STA 272
TO FUS. HOR. = 4 .15 111 ,c : : ~ \' .. = :3.475 ins.
HORIZONTAL MOVEMENT OF POINT A
FROM Og TO FUS. DATUM HOR IZONTAL
= ( 70 "+ 3.475 .. ) SIN I. 234° = 1.58 2 '' FROM O Q TO 3. 844 9 = (70'+ 8. 329') SIN 2. 959° = 4 .04 3 " 161.3 "
i5_
1.582r
1 _ _ 1 2.461" セ@ セ@I ~...___
POINT A (0/W LOAD RESULTANT) 70 "k
I. 2340t
f
1.1250f
U/F BEAM SYSTEM DEFL.
: 3. 844 X 0 .252 :S 0 . 969 "
'
2.9590
•
0 - 3.844 Q - TOTAL ACTUATOR TRAVEL = 10.919 ''
...
192. 7 - - -- - - - -- -- - - --
-FIG. I GEOMETRY OF POINT 11A"
セ@
セ@ 9.95 " 5. t99"*
EQUAT ION M.A.= 158.0 1
+
2 . 142n MOM . ARM : 166. 244 11l
' MOM. ARM :: 158. 010 " " 161. 3 1.363° 2.121° 3.486° POINT A ..IFIG. 2
DETERMINATION OF ·OVER-WING MOMENT ARM66,5 H
136. 5 "
20000
0I-··-· -~: i
, • I , j--c..- .:·-· . . I I • • I·1 ...
.,i
IJ_
·F.,JlGJ
3TRACKER FATIGUE TEST
·OUTER W
l NG LO}.D
1. 0 2. 0
FLIGHT
9 LE~EL
セ@
nI
L_
L
f - j I •
r , - - - - -;...-:__1.-;__il I