HAL Id: hal-00480681
https://hal.archives-ouvertes.fr/hal-00480681
Submitted on 10 May 2021
HAL is a multi-disciplinary open access
archive for the deposit and dissemination of
sci-entific research documents, whether they are
pub-lished or not. The documents may come from
teaching and research institutions in France or
abroad, or from public or private research centers.
L’archive ouverte pluridisciplinaire HAL, est
destinée au dépôt et à la diffusion de documents
scientifiques de niveau recherche, publiés ou non,
émanant des établissements d’enseignement et de
recherche français ou étrangers, des laboratoires
publics ou privés.
Distributed under a Creative Commons Attribution| 4.0 International License
Sébastien Lefebvre, C. Harma, J.-L. Blin
To cite this version:
Sébastien Lefebvre, C. Harma, J.-L. Blin. Trophic typology of coastal ecosystems based on �13C and
�15N ratios in an opportunistic suspension feeder.. Marine Ecology Progress Series, Inter Research,
2009, pp.27-37. �hal-00480681�
INTRODUCTION
Coastal ecosystems located at the interface between continental and open-ocean zones exhibit complex ecological functions and trophic relationships that need to be better elucidated (Yokoyama et al. 2005). Particularly, it is necessary to better understand their dynamics, which vary at different temporal and spatial scales depending on the relative amounts of terrestrial or marine inputs, coastal hydrology, and the local food web structure (Cloern & Jassby 2008). Suspension-feeding invertebrates occupy a central place in the food webs of intertidal communities throughout the
world because they provide important links in the material and energy flows between primary producers and larger consumers (Jennings & Warr 2003). In tem-perate coastal ecosystems of western Europe, large areas are also devoted to the cultivation of bivalves, thus enhancing the latter’s role in nutrient cycling pro-cesses (Riera 2007).
Many bivalves are considered to be generalists (as defined in Bearhop et al. 2004) and even opportunists since they can assimilate food from various sources according to their bioavailability (Lefebvre et al. 2009) in order to maximize rates of nutrient acquisition (Hawkins et al. 1996), and according to the occurrence
© Inter-Research 2009 · www.int-res.com *Email: sebastien.lefebvre@unicaen.fr
Trophic typology of coastal ecosystems based on
δδ
13
C and
δδ
15
N ratios in an opportunistic suspension
feeder
S. Lefebvre
1, 3,*, C. Harma
1, J.-L. Blin
21UMR 100 IFREMER-Université de Caen Basse-Normandie ‘Physiologie et Ecophysiologie des Mollusques Marins (PE2M)’,
Laboratoire de Biologie et Biotechnologies Marines, Esplanade de la Paix, B.P. 5186, 14032 Caen Cedex, France
2Syndicat Mixte pour l’Équipement du Littoral (SMEL), 50560 Blainville sur Mer, France
3Present address: Université des Sciences et Technologies de Lille – Lille 1, CNRS, UMR 8187 Laboratoire d’Océanographie
et de Géoscience, Wimereux Marine Station, 28 av. Foch, 62930 Wimereux, France
ABSTRACT: Our objective was to use stable carbon (C) and nitrogen (N) isotope ratios of the adduc-tor muscles of cultured Crassostrea gigas to typify the trophic state of temperate coastal ecosystems. Young oysters were introduced on a regional geographical scale in 8 locations along the coast of Nor-mandy (France) and sampled after 9 mo in cultivation. Food sources were also investigated using a mixing model based on food source isotopic composition data previously obtained. To strengthen the interpretation of trophic ecosystem functioning, values of stable isotope ratios were combined with environmental variables in a principal component analysis (PCA). Isotopic values of adductor muscles varied significantly between –19.94 and –17.26 ‰ for δ13C and between 7.73 and 12.14 ‰ for δ15N. PCA discriminated 2 groups of coastal ecosystems that differed in coastal hydrology, inputs of nutri-ents, and size of their respective watersheds. Our results suggest that isotopic signature differences between these 2 spatial groups appeared too important to be due to (1) variations in the isotopic ratios of food sources and (2) differing trophic step fractionation between locations. These differences are more probably linked with differences in oyster diets. Finally, we conclude that cultured C. gigas is a useful spatial bio-indicator of coastal ecosystem trophic functioning in temperate ecosystems and an interesting biological model for the determination of isotopic baselines.
KEY WORDS: Crassostrea gigas · Marine · Carbon and nitrogen stable isotopes · Trophic web · Isotopic baseline · Aquaculture · Oyster
of competitors (Stuart & Klumpp 1984). Typically, inter-tidal bivalves feed on a mixture of microalgae (phyto-plankton and microphytobenthos) and detritus of marine (macroalgae) and terrestrial origins (Hill et al. 2006, Decottignies et al. 2007, Marín Leal et al. 2008). As benthic sessile organisms, bivalves are good spatial indicators of the trophic state of their environment since they are subject to the quality and quantity of suspended organic matter that serves as their food source (Jennings & Warr 2003), albeit they are able to facultatively select food in their environment (Beninger et al. 2007). Within aquatic ecosystems, sta-ble isotopes are widely used as time-integrating tra-cers of trophic interactions, environmental gradients, and carbon (C) and nitrogen (N) biogeochemical cycles within the system (Fry 2006). δ13C and/or δ15N values of bivalves (mussels, scallops, oysters) are also used to monitor watersheds and anthropogenic effects on freshwater and coastal ecosystems (Fry 1999, Jennings & Warr 2003).
In general, trophic studies based on stable isotopes of C and N need to be conducted such that the spatial and temporal scales are able to capture the variability in δ13C and δ15N values that is relevant to the research objectives (Boyce et al. 2001). Evidence of seasonal iso-topic differences in consumer tissues has been re-ported mostly for invertebrates (Malet et al. 2007) and temporal variations have also been demonstrated to be site-specific (Fukumori et al. 2008, Marín Leal et al. 2008). Previously, spatial variability has only been studied on small scales, generally within bays (e.g. Dubois et al. 2007b) or along an estuarine gradient (e.g. Piola et al. 2006), within the same system with comparable functioning. Few studies involving inver-tebrates consider large spatial biogeographic scales (e.g. Jennings & Warr 2003, Hill et al. 2006). The cap-ture of both temporal and spatial dynamics of coastal environments is a difficult task that necessitates inte-gration of these 2 sources of variation. Changes in iso-topic signatures following dietary change have gener-ally been investigated in the laboratory (Dubois et al. 2007a) and results show that the time to reach a new isotopic equilibrium differs among species and even among tissues (Paulet et al. 2006). In bivalves, muscle tissues integrate long-term trophic information (i.e. months) because of their slow isotopic turnover rate (Lorrain et al. 2002, Paulet et al. 2006, Piola et al. 2006). Our objective was to evaluate the cultivated bivalve Crassostrea gigas (Thunberg, 1793) as a bio-indicator that typifies the trophic functioning of temperate coastal ecosystems. We assumed that stable isotope val-ues of C. gigas muscles reflect patterns in the availabil-ity and isotopic values of their food sources, and subse-quent environmental conditions (e.g. nutrient sources and availabilities, salinity, temperature) in a given
coastal ecosystem, as supported by results on other spe-cies and other environments (Jennings & Warr 2003, Hill et al. 2006, Gustafson et al. 2007). The Pacific oyster C. gigas, an opportunistic suspension feeder, is a Japanese species that has been introduced in various temperate ecosystems worldwide because of its eco-nomic value for aquaculture and its capacity to thrive under different environmental conditions due to the breadth of its trophic niche. This sessile primary con-sumer may provide an interesting bio-indicator that can elucidate trophic ecosystem functioning worldwide. Stable isotopes of C. gigas muscle were investigated on a biogeographical scale along the coasts of Normandy (France) together with environmental conditions of the water column (nutrient concentrations, temperature, salinity, chl a, turbidity) and food availability to strengthen characterisation of ecosystems and to iden-tify causes of the observed variability.
MATERIALS AND METHODS
Study area. The study area is located on the
north-west coastal domain of France in Basse-Normandie, which is one of the most important oyster farming areas of France and Europe (~27 000 t yr–1; Anonymous 2006). We selected 8 oyster farming areas in these macrotidal/megatidal and intertidal environments because of their distinctive characteristics (site hydrol-ogy, mean annual salinity of the water masses, nutrient inputs from rivers, growth of farmed species, especially oysters) around the Cotentin peninsula ( J.-L. Blin et al. unpubl. data, Fig. 1).
Three sampling sites were on the west coast of Cotentin: the isles of Chausey (48° 53’ 31’’ N, 1° 47’ 96’’ W), Lingreville-sur-mer (48° 56’ 61’’ N, 1° 35’ 33’’ W), and Saint-Germain (49° 12’ 95’’ N, 1° 38’ 89’’ W) from the south to the north. This coast is exposed to general currents of the North Atlantic drift, which are propagated eastward and deflected north-ward along the coast from the Baie du Mont Saint-Michel. The maximum spring tidal range is as much as 15 m, and is among the highest in the world. Thus, ecosystems of the west coast are megatidal (Levoy et al. 2000). The substrate is generally medium to coarse sand with some rock inclusions; however, near the coast and especially around the islands where currents form gyres, rocky platforms and tidal deltas locally modify the wave propagation patterns.
Five sampling sites were on the east coast of Cotentin and were more protected from the prevailing winds and marine currents than ecosystems on the west coast because of their location in the Baie de Seine. The maximum tidal range is 8 m, describing a macrotidal environment. Oyster farming sites in
Géfosse (49° 23’ 35’’ N, 1° 05’ 98’’ W, in the Baie des Veys), Utah Beach (49° 25’ 50’’ N, 1° 10’ 62’’ W), Lestre (49° 32’ 49’’ N, 1° 17’ 39’’ W), and La Tocquaise (49° 35’ 49’’ N, 1° 15’ 18’’ W) are influenced by nutrients from the Baie des Veys (from south to north), an estu-ary in the western part of the Baie de Seine. Meu-vaines (49° 21’ 02’’ N, 0° 33’ 75’’ W) represents one of the most recent oyster farming sites in Normandie. On average, the sediment grain size on the east coast is smaller than on the west coast and spatially more het-erogeneous, with fine sand in the middle part of the intertidal zone and also with muddy sand especially in Lestre and Géfosse (F. Levoy pers. comm.).
Sampling design. Young Pacific oysters Crassostrea
gigas (initial total live weight of 1.3 g) from the same batch (i.e. same history: age, method of culture and nutrition status) were introduced in the 8 systems in March 2005 and removed 9 mo later in December 2005. Their weight (taken before introduction and after removal) indicated high growth while reared in the study areas, providing consistently high footprint of each ecosystem in oyster tissues. Oysters were placed in each system (in the middle part of the inter-tidal area) such that daily immersion duration was equal to avoid error due to different feeding durations. Groups of 10 oysters were taken from each study area. They were individually weighed to estimate total live
weight, then killed by freezing, and dissected to sepa-rate the major parts, which were freeze dried. The dry flesh weight was measured on the adductor muscle alone and on the whole individual. Finally, the samples were frozen (–18°C) until further processing.
Simultaneously, surveys of water column parameters (temperature, chl a concentration, salinity, nitrate, ammonium, and phosphate) were conducted fort-nightly in each study site using standard techniques (Aminot & Kérouel 2004). Watershed surface areas were provided by DIREN (Direction Regional de l’En-vironnement Basse-Normandie).
Isotopic analyses. Adductor muscles (n = 10 site–1) were pulverized, and stored in a desiccator until iso-topic analyses. Then, 1 mg (± 0.1 mg) of each sample (total n = 80) was weighed with a microanalytical balance (Mettler Toledo MX5) and put in tin capsules (3.5 × 5 mm Sercon). Analyses were performed using an elemental analyser (Eurovector) for particulate C (% C) and N (% N) and an isotope ratio mass spectro-meter (IRMS GV Isoprime instrument) for C and N iso-topes. Analytical precision was estimated as 0.12 for δ15N, 0.05 for % N, 0.05 for δ13C, and 0.005 for % C. Results were expressed in the delta notation:
δ*X = [(*X/X)sample/ (*X/X)standard– 1] × 1000 where *X and X are respectively the heavier and the Fig.1. Cotentin peninsula (Normandy, France). Map showing the 8 sampling locations and their associated watersheds
lighter stable isotopes of the elements analysed. Stable isotope data are expressed as the relative per mille (‰) differences between the samples and the conventional international standard Pee Dee Belemnite (PDB) for C and atmospheric N2for N.
Statistical analyses. Differences in δ13C and δ15N val-ues (n = 80) and in hydrobiological variables among growing sites (Lingreville-sur-mer, Saint-Germain, Chausey, La Tocquaise, Lestre, Utah Beach, Géfosse, and Meuvaines) were investigated using 1-way ANOVA in Minitab. Normality conditions (Kol-mogorov-Smirnov test, p > 0.05), homoscedasticity of data (Bartlett’s test), and normality of residuals permit-ted the use of parametric tests. Finally, Tukey’s pair-wise comparisons were performed as post-hoc tests. Linear regressions were also performed within each ecosystem (n = 10) and between ecosystems (n = 80) to test for significant linear relationships between vari-ables such as between oyster weights (total live weight, dry weight or adductor muscle dry weight) and δ13C as well as δ15N values. Principal component analy-sis (PCA, Canoco software), a multivariate analyanaly-sis, was used to characterise the various studied ecosys-tems using means of environmental parameters (n = 19 site–1), isotopic results, C/N ratios and oyster weights (n = 10 site–1).
Investigation of food sources. A mixing model
(IsoSource; Phillips & Gregg 2003) was performed to calculate the relative contributions of multiple poten-tial food sources in the oysters’ diets. For the model, mean C and N signatures of potential food sources were taken from a previous study in Lingreville-sur-mer and the Baie des Veys (see Fig. 2; Lefebvre et al. 2009). The isotopic values of organic matter in the Baie des Veys were used for the eastern locations with estu-arine influence, while those in Lingreville-sur-mer were used for the western locations according to the results of PCA (see results section and Table 1). Results of food source contribution were aggregated a posteri-ori according to the method of Phillips et al. (2005) when appropriate.
To correct for the trophic shift existing between oys-ter adductor muscles, as primary consumers, and their potential food sources, we used a particular trophic step fractionation. First, the values (Δ) estimated from experimental oysters (whole body) reared on Skele-tonema costatum (1.85 ‰ for Δδ13C and 3.79 ‰ for Δδ15N; Dubois et al. 2007a) were identified as being the more reliable values for the species. Then, the specific values of McCutchan et al. (2003) for muscle enrich-ment (1 ‰ for Δδ13C and 0.8 ‰ for Δδ15N) were added to strengthen the estimate done on the special tissue analysed here. Δδ13C and Δδ15N are therefore 2.9 and 4.7 ‰ respectively. Moreover, 3 sensitivity analyses were performed to test the response of the mixing
model of food source contribution to (1) the modifica-tion of isotopic values of food sources (values for the east and west coasts were permutated), (2) the change in trophic step fractionation (Δδ13C and Δδ15N were decreased by 1.85 and 3.79 ‰ instead of 2.9 and 4.7 ‰ respectively), and (3) a spatial difference in trophic step fractionation as supported by the results of Gaye-Siessegger et al. (2004) demonstrating a negative rela-tionship between feeding level/growth and trophic step fractionation. Both Δδ13C and Δδ15N were decreased in proportion to the final oyster total live weight (TW), with a maximum decrease of 1 ‰ for the highest TW (for oysters located in Chausey and Utah Beach) and no change for the lowest TW (Saint-Ger-main). This rule can be synthesised in the following regression:
Δδ13Cs (and Δδ15Ns) = Δδ13C – 0.0379 × TW + 0.4545 (Δδ13Cs are spatialised). The new values for Δδ13C and Δδ15N were thus respectively 3.7 and 1.9 ‰ for the Chausey ecosystem, 3.8 and 2.0 ‰ for Lingreville-sur-mer, 4.7 and 2.9 ‰ for Saint-Germain (unchanged), 3.8 and 2.0 ‰ for Géfosse, 3.7 and 1.9 ‰ for Utah Beach, 4.0 and 2.2 ‰ for Lestre, 4.2 and 2.4 ‰ for La Tocquaise, and 4.6 and 2.8 ‰ for Meuvaines.
RESULTS
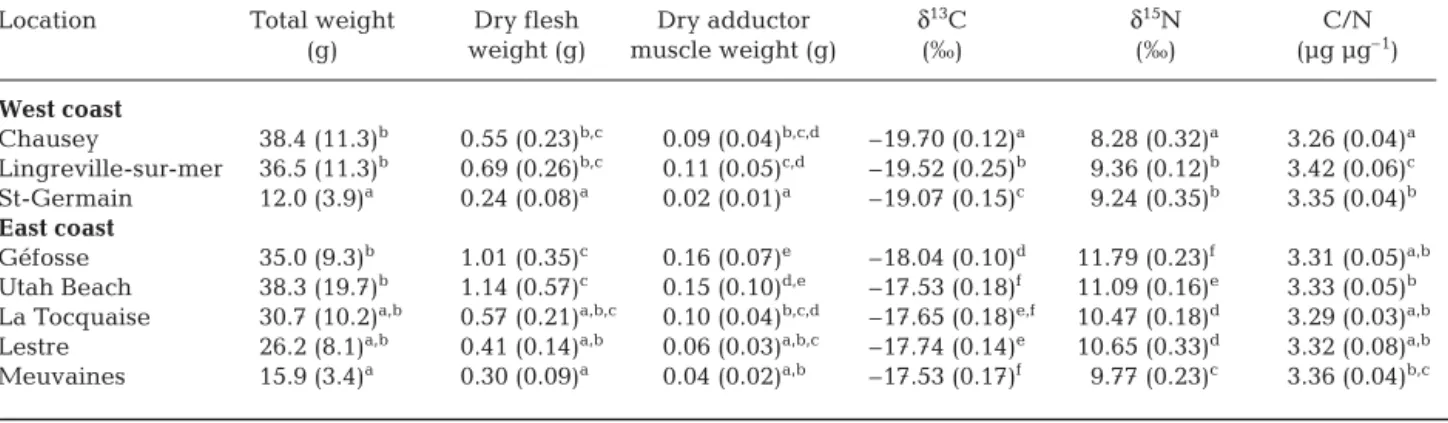
Mean individual dry weights (DW) and total live weights (TW) of oysters differed significantly among ecosystems (ANOVA, Table 1). C/N ratios of oyster adductor muscles differed significantly among sites, but differences were small (ANOVA, Table 1); indeed, values were all under 3.5 µg µg–1. Muscle DWs were linearly correlated with TWs (r2 = 0.926, n = 80, p < 0.01). Linear relationships between adductor muscle DW and δ13C, δ15N, or C/N ratios were not significant whether within (p > 0.05, n = 10) or between (p > 0.05, n = 80) the 8 ecosystems.
Isotopic values of oyster adductor muscles in the 8 sites were between –19.94 and –17.26 ‰ for δ13C, and between 7.73 and 12.14 ‰ for δ15N (Table 1). Isotopic ratios differed significantly among locations, both for C and N. Oysters on the west coast were less enriched in 13C and 15N than those on the east coast, as highlighted by a post-hoc Tukey’s test (Table 1, Fig. 2). On the east coast, the δ15N of adductor muscles decreased con-comitantly with distance from the mouth of the Baie des Veys estuary.
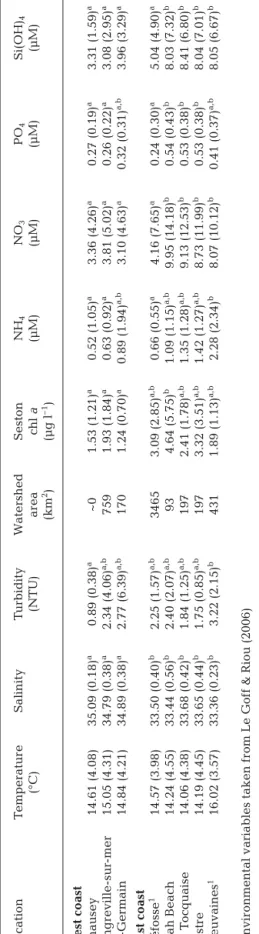
As for environmental variables, there were signifi-cant differences among locations except in tempera-ture (ANOVA, Table 2). Based on post-hoc Tukey’s test, there were clear differences in salinity between east and west coasts, and also in NO3, PO4and Si(OH)4 (except for Géfosse, Table 2). Trends were less
pro-nounced for chl a and NH4, although values were gen-erally lower on the west coast (Table 2). No clear trends were found for turbidity (Table 2). Related watershed surface areas of the 8 locations were given since coastal areas along the east or west coasts are interconnected by upward currents. However, it is worth noting that the total surface area of watersheds impacting the east coast is ~4× larger than that of watersheds impacting the west coast (Table 2).
Principal component analysis using the environmen-tal and biological variables (Tables 1 & 2) confirmed contrasts between the east and west coastal ecosys-tems (Fig. 3). Although the west coast appeared well correlated with salinity, with the isles of Chausey hav-ing the highest salinity (~35) because of their distance from the coast, ecosystems of the east coast were characterised by lower salinity (~33.5) because of their proximity to an estuary receiving freshwater from a large watershed (see Table 2) and higher nutrient con-centrations leading to greater seston chl a concentra-tions (Fig. 3). Indeed, the east coast was more produc-tive, with concentrations of chl a, NO3, and Si(OH)4 being approximately double those on the west coast of Cotentin. While δ13C variations among study sites appeared very well correlated with nutrients, δ15N val-ues of adductor muscle tissue in each ecosystem reflected seston chl a concentrations (Fig. 3). Turbidity, C/N ratio and temperature showed lesser influence in the analysis (Fig. 3).
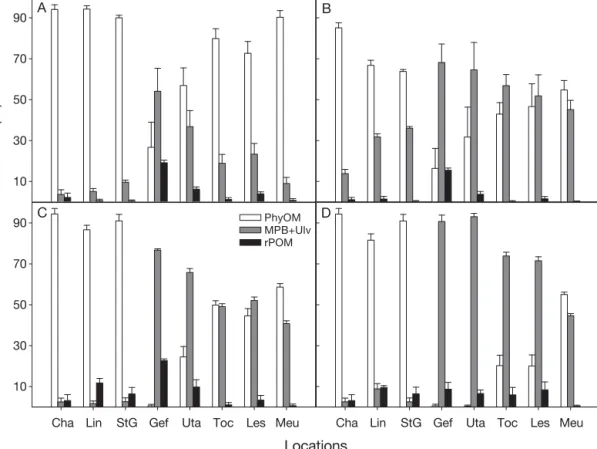
Results from the mixing model suggested that oys-ters on the west coast relied mainly on phytoplankton and marine organic matter sources (POM), while those on the east coast used benthic (microphytobenthos and algal detritus: MPB+Ulv) as well as planktonic sources (Fig. 4A). The contribution of rPOM was substantial only for Géfosse (the most estuarine location). On the east coast, the decrease in δ15N of oyster adductor
mus-Location Total weight Dry flesh Dry adductor δ13C δ15N C/N
(g) weight (g) muscle weight (g) (‰) (‰) (µg µg–1)
West coast Chausey 38.4 (11.3)b 0.55 (0.23)b,c 0.09 (0.04)b,c,d –19.70 (0.12)a 8.28 (0.32)a 3.26 (0.04)a Lingreville-sur-mer 36.5 (11.3)b 0.69 (0.26)b,c 0.11 (0.05)c,d –19.52 (0.25)b 9.36 (0.12)b 3.42 (0.06)c St-Germain 12.0 (3.9)a 0.24 (0.08)a 0.02 (0.01)a –19.07 (0.15)c 9.24 (0.35)b 3.35 (0.04)b East coast Géfosse 35.0 (9.3)b 1.01 (0.35)c 0.16 (0.07)e –18.04 (0.10)d 11.79 (0.23)f 3.31 (0.05)a,b
Utah Beach 38.3 (19.7)b 1.14 (0.57)c 0.15 (0.10)d,e –17.53 (0.18)f 11.09 (0.16)e 3.33 (0.05)b
La Tocquaise 30.7 (10.2)a,b 0.57 (0.21)a,b,c 0.10 (0.04)b,c,d –17.65 (0.18)e,f 10.47 (0.18)d 3.29 (0.03)a,b
Lestre 26.2 (8.1)a,b 0.41 (0.14)a,b 0.06 (0.03)a,b,c –17.74 (0.14)e 10.65 (0.33)d 3.32 (0.08)a,b
Meuvaines 15.9 (3.4)a 0.30 (0.09)a 0.04 (0.02)a,b –17.53 (0.17)f 9.77 (0.23)c 3.36 (0.04)b,c
Table 1. Crassostrea gigas. Weights (n = 10), isotopic carbon and nitrogen ratios, and elemental C/N ratios of adductor muscles (mean ± SD) at sites along the west and east coasts of the Cotentin peninsula after 9 mo in cultivation (mean initial total live weight was 1.30 g). Differences among sites were tested for significance using 1-way ANOVA at p < 0.001. Means within each
column that do not share a common superscript are significantly different at p < 0.05 (post-hoc Tukey’s test)
–32 –30 –28 –26 –24 –22 –20 δ13C δ 15N δ 15N –18 –16 –14 4 6 8 10 12 4 6 8 10 12 POM rPOM MPB Ulv Gef Uta Les Toc Meu Lin StG Cha A B
Fig. 2. Crassostrea gigas. δ13C and δ15N (mean ± SD) of
adduc-tor muscle (n = 10) and of the 4 potential food sources (n = 13) in the east coast of the Cotentin peninsula (A; reference site for food sources is the Baie des Veys), and in the west coast (B; reference site for food sources is Lingreville-sur-mer) from Lefebvre et al. (2009). POM: marine phytoplankton and sus-pended organic matter; MPB: microphytobenthos; Ulv: Ulva sp.; rPOM: riverine organic matter. Gef: Géfosse; Uta: Utah beach; Les: Lestre; Toc: La Tocquaise; Meu: Meuvaines; Lin: Lingreville-sur-mer; StG: Saint-Germain; Cha: Chausey. The corrected values after correction based on trophic step frac-tionation are indicated by the arrows and the envelopes
cles when moving away from the Baie des Veys mouth is demonstrated by the mixing model as a gradual decline in the use of benthic sources at that spatial scale (Fig. 4A). Whatever sensitivity analyses scenario is chosen, the difference between east and west coasts is evident (Fig. 4B–D). A decrease in trophic step frac-tionation for δ13C and δ15N led to a general increase in MPB and Ulv in the oyster diets (Fig. 4B). Differences between the east and the west coasts were stronger when values for isotopic food sources were permutated from one coast to another (Fig. 4C), and when a decrease in trophic step fractionation was spatially cor-related with oyster growth in the different ecosystems (Fig. 4D).
DISCUSSION
The isotope composition of Crassostrea gigas adduc-tor muscle clearly depended on geography, with differ-ences between the west and east coasts of the Cotentin peninsula. Our assumption was that stable C and N isotope values of oyster muscles reflected the trophic
Location T emperatur e Salinity T urbidity W atershed Seston NH 4 NO 3 PO 4 Si(OH) 4 (°C) (NTU) ar ea chl a (µM) (µM) (µM) (µM) (km 2)( µ g l –1) W est coast Chausey 14.61 (4.08) 35.09 (0.18) a 0.89 (0.38) a ~0 1.53 (1.21) a 0.52 (1.05) a 3.36 (4.26) a 0.27 (0.19) a 3.31 (1.59) a Lingr eville-sur -mer 15.05 (4.31) 34.79 (0.38) a 2.34 (4.06) a,b 759 1.93 (1.84) a 0.63 (0.92) a 3.81 (5.02) a 0.26 (0.22) a 3.08 (2.95) a St-Ger main 14.84 (4.21) 34.89 (0.38) a 2.77 (6.39) a,b 170 1.24 (0.70) a 0.89 (1.94) a,b 3.10 (4.63) a 0.32 (0.31) a,b 3.96 (3.29) a
East coast Géfosse
1 14.57 (3.98) 33.50 (0.40) b 2.25 (1.57) a,b 3465 3.09 (2.85) a,b 0.66 (0.55) a 4.16 (7.65) a 0.24 (0.30) a 5.04 (4.90) a Utah Beach 14.24 (4.55) 33.44 (0.56) b 2.40 (2.07) a,b 93 4.64 (5.75) b 1.09 (1.15) a,b 9.95 (14.18) b 0.54 (0.43) b 8.03 (7.32) b La T ocquaise 14.06 (4.38) 33.68 (0.42) b 1.84 (1.25) a,b 197 2.41 (1.78) a,b 1.35 (1.28) a,b 9.13 (12.53) b 0.53 (0.38) b 8.41 (6.80) b Lestr e 14.19 (4.45) 33.65 (0.44) b 1.75 (0.85) a,b 197 3.32 (3.51) a,b 1.42 (1.27) a,b 8.73 (11.99) b 0.53 (0.38) b 8.04 (7.01) b Meuvaines 1 16.02 (3.57) 33.36 (0.23) b 3.22 (2.15) b 431 1.89 (1.13) a,b 2.28 (2.34) b 8.07 (10.12) b 0.41 (0.37) a,b 8.05 (6.67) b 1Envir
onmental variables taken fr
om Le Gof
f & Riou (2006)
T
able 2. Envir
onmental parameters (mean and SD) for each site along the west or east coast of the Cotentin peninsula between Ma
rch and December 2005 (for
tnight
sampling; n = 19). Dif
fer
ences among sites wer
e tested for significance using 1-way ANOV
A at p < 0.05 (No significant dif
fer
enc
es wer
e found for temperatur
e, salinity
or turbidity). Means within each column with dif
fer ent superscripts ar e significantly dif fer ent at p < 0.05 (post-hoc T ukey’ s t est) -1.0 -1.0 1.0 1.0 TW FDW AMDW Delta 13 C/N T° Sal Turb Chl a NH4 NO3PO4 SiO2 WaterS Axis 1 44.4% Axi s 2 30. 6% Meuvaines Saint-Germain Lingreville Chausey Lestre La Tocquaise Utah Beach Géfosse C 15N [NO3-] [PO43-] 4] [Si(OH) [NH4+] 13
Fig. 3. Principal component analysis (PCA) to discriminate studied ecosystems using means (n = 10) of biological vari-ables of Crassostrea gigas (total live weight, TW; dry flesh weight, FDW; dry adductor muscle weight, AMDW; carbon to nitrogen ratio, C/N; adductor muscle δ13C and δ15N) and
means (n = 19) of environmental variables obtained in situ be-tween March 2005 and December 2005 (temperature, T°; tur-bidity, Turb; nutrient concentrations; salinity, Sal; and seston chl a) as explanatory variables within each ecosystem. Water-shed surface (WaterS) was a supplementary variable. The
functioning of coastal ecosystems, i.e. the availability of food sources and their isotopic values as a function of environmental gradients. Another source of vari-ance for such spatial differences that merits discussion is trophic step fractionation.
Spatial variability of isotopic values of food sources
Due to their shallow depths and terrestrial inputs, coastal ecosystems are characterised by high spatial and temporal variability of environmental factors such as freshwater runoff, levels of irradiance, temperature, water movement, and different forms of C (HCO3–or dissolved CO2) and N (NO3–or NH4+) sources. All of these factors may cause differences in the isotopic composition of the same organic matter source (Vizzini & Mazzola 2003). For example, typical δ13C and δ15N values for marine phytoplankton in temperate seas
range from –19.1 to –22.0 ‰ and from 3 to 12 ‰, re-spectively (Maksymowska et al. 2000). These authors showed that δ15N values of PhyOM varied according to season in the Gulf of Gdansk (differences of 1.6 ‰ dur-ing a year). This was a general pattern for other organic matter sources as well, with macroalgal signa-tures varying between 3 and 4.4 ‰ for δ15N and –17.4 and –15.6 ‰ for δ13C, and terrestrial organic matter sig-natures varying from 1.5 to 6.5 ‰ for δ15N and from –29.7 to –27.3 ‰ for δ13C (Maksymowska et al. 2000).
Jennings & Warr (2003) showed a negative correla-tion between salinity and δ15N of scallop tissue at large spatial scales and assumed it was due to higher δ15N values of the phytoplankton resulting from higher nutrient input from the watersheds. At our spatial scales, Marín Leal et al. (2008) showed that the annual isotopic average of potential food sources for Cras-sostrea gigas expressed weak spatial differences within 2 of our studied systems that differ functionally 10 30 50 70 90 Locations
Cha Lin StG Gef Uta Toc Les Meu
Food source contribution (%)
10 30 50 70 90 PhyOMMPB+Ulv rPOM
Cha Lin StG Gef Uta Toc Les Meu
B
C D
A
Fig. 4. Contributions (mean + SD) of the 4 main potential food sources (PhyOM: marine phytoplankton and organic matter; MPB: microphytobenthos; Ulv: Ulva sp.; rPOM: riverine organic matter) in the diets of Crassostrea gigas at each site along the west or east coast of the Cotentin peninsula, as obtained with a mixing model (Phillips & Gregg 2003) using δ13C and δ15N values of
oys-ters and of each of the 4 organic matter sources (Fig. 2). MPB and Ulv were aggregated a posteriori as suggested by Phillips et al. (2005). Cha: Chausey; Lin: Lingreville-sur-mer; StG: Saint-Germain; Gef: Géfosse; Uta: Utah beach; Toc: La Tocquaise; Les: Lestre; Meu: Meuvaines. Tolerance values were 0.5 ‰ except for Chausey (1 ‰). (A) Trophic step fractionation (Δ) of 2.9‰ for δ13C
and 4.6 ‰ for δ15N. (B) Sensitivity analysis 1: no additional Δ for enrichment due to muscle; Δ was 1.9‰ for δ13C and 3.8 ‰ for δ15N.
(C) Sensitivity analysis 2: permutation of isotopic values of food sources between east and west coasts. (D) Sensitivity analysis 3: Δ was spatialized and was dependent on oyster growth in the 8 locations. See ‘Materials and methods’ for details
(i.e. Géfosse in the Baie des Veys, east coast and Lin-greville-sur-mer, west coast; Fig. 2), although they found more similar patterns in oyster isotopic values than in the present study. Generally, isotopic signa-tures of oyster muscles were more enriched in the Baie des Veys than at Lingreville-sur-mer (11.79 ‰ for δ13C in Géfosse versus 9.36 ‰ in Lingreville-sur-mer, and –18.04 ‰ for δ15N in Géfosse against –9.52 ‰ in Lingre-ville-sur-mer). This trend was also observed for the iso-topic signatures of Ulv and PhyOM (only in C for PhyOM). Despite a more similar variation in C be-tween PhyOM and oysters in Géfosse compared with that in Lingreville-sur-mer, this resource cannot explain the huge variation in δ15N (2.4 ‰) in the tissue. Similarly, isotopic variations of Ulv appeared more consistent with those observed between oysters in Lin-greville-sur-mer and the Baie des Veys, where Ulv was used less as a food source (Marín Leal et al. 2008). Thus, the weak distinctions in food source isotopic val-ues among ecosystems may account only a little of the significant isotopic differences found in oyster muscles as also supported by the sensitivity analysis (Fig. 4C). Other sources of variation (e.g. the spatial variability in trophic step fractionation or the spatial difference in the diet) must be considered to explain these differ-ences.
Spatial variability in trophic step fractionation
Mean trophic step fractionation values (1 ‰ for δ13C and 3.4 ‰ for δ15N) that have been estimated for many animals are generally used in the literature (Mc-Cutchan et al. 2003). Nevertheless, isotopic fractiona-tion values may be influenced by species and biochem-ical forms of excretion (Vanderklift & Ponsard 2003, Dubois et al. 2007a), age (Overman & Parrish 2001), tissue biochemical composition (Lorrain et al. 2002), diet and food quality (Hobson & Clark 1992, McCutchan et al. 2003), feeding level and nutritional status (Hobson et al. 1993, Gaye-Siessegger et al. 2004), environmental abiotic parameters (Vanderklift & Ponsard 2003, Sweeting et al. 2007), and even by methods of sample preparation (McCutchan et al. 2003). Some of these sources of variability, specifically, species, age, and methods of sample preparation, could not have caused differences in oyster muscle iso-topic values among our 8 systems. An advantage of the biological model used in our study (Crassostrea gigas) is that many environmental conditions are controlled because culture methods are standardised in Nor-mandy; specifically, oysters are grown in plastic cul-ture bags at similar densities, put on iron tables at 60 cm above the bottom, with the same immersion time at each study site. The other sources of variability, i.e.
environmental parameters, feeding level, and diet composition are discussed below. Few studies of trophic step fractionation exist for bivalves, so the fol-lowing discussion is based on vertebrates.
Trends in δ15N fractionation values of sea bass mus-cles were weaker with temperature than with diet (Sweeting et al. 2007). Nevertheless, Barnes et al. (2007) found that N and C fractionation was affected by temperature. For instance, the difference in frac-tionation was ~0.6 ‰ for δ15N and 0.5 ‰ for δ13C when temperature changed by 5°C (0.1 ‰ °C–1); however, in our study, between-site differences in average temper-atures appeared to be too small (~1.2°C) to explain the observed variability in isotopic fractionation of oyster muscles.
Several studies emphasize that both the amount of the diet consumed and the individual metabolic rate could influence δ13C and δ15N values of tissues (e.g. Gaye-Siessegger et al. 2004, Barnes et al. 2007). Indeed, starvation and low feeding levels of the Nile tilapia Oreochromis niloticus resulted in enrichment of 13C in lipids and 15N in protein (Gaye-Siessegger et al. 2007). Laboratory tests have shown that periods of reduced nutrient intake can cause 15N enrichment (from 0.5 ‰ to 1.5 ‰ depending on the tissue) in grow-ing birds (Hobson et al. 1993). Both C and N isotope values differed significantly in carp fed at different rates; there was a negative relationship between trophic step fractionation and feeding level of up to 1 ‰ for both C and N (Gaye-Siessegger et al. 2004). Barnes et al. (2007) found similar trends in sea bass. Actually, oyster final weight differed by up to 3.2× among our 8 systems, providing evidence of different food availabil-ities. However, δ13C and δ15N values were not signifi-cantly correlated with growth and possibly with feed-ing level, supportfeed-ing the idea that spatial differences in δ13C and δ15N may not be due to a spatialised trophic step fractionation. This assumption is also supported by the sensitivity analysis (Fig. 4D) which showed that spatial differentiation in trophic step fractionation according to the trends of Barnes et al. (2007) and Gaye-Siessegger et al. (2004) amplified the difference in oyster diet food source contribution between east and west coasts.
Diet-tissue fractionation and turnover rates were also influenced by diet quality (Hobson & Bairlein 2003, Miron et al. 2006). For example, nectarivorous bats fed with amaranth had higher δ15N and δ13C val-ues (1.1 ‰ for N and 1.9 ‰ for C), albeit with lower nitrogen content, than those fed with soya (Miron et al. 2006). Hobson & Clark (1992) found lower values for N tissue fractionation (1.7 ‰ for δ15N and 1 ‰ for δ13C) in crows Corvus brachyrhynchos raised on a diet of perch Perca flavescens than crows raised on a plant-based diet (3 ‰ for δ15N and 2.2 ‰ for δ13C). In 2 of our study
sites (Géfosse and Lingreville-sur-mer), Marín Leal et al. (2008) showed that food sources for oysters were similar, but their proportions in the diets differed, in agreement with our results. Therefore, the oyster diets did not completely differ spatially and fractionation might not have been affected by diet quality in the range of values observed in our study.
Difference in ecosystem trophic functioning
C and N isotopic differences among sites are proba-bly due to the discrimination existing between pelagic and benthic food resources used as already shown by 2 previous studies in Lingreville-sur-mer (west coast) and Géfosse (east coast) (Marín Leal et al. 2008, Lefeb-vre et al. 2009). Indeed, among primary producers, low 15N enrichment values are found in phytoplankton in Normandy (Marín Leal et al. 2008). Oyster diets on the west coast were more pelagic than on the east coast. Based on Hsieh et al. (2000), who found a gradient in 13C-depleted values in oyster tissues from the open sea to the Chiku River in a Taiwan lagoon, the oyster C values in our study, particularly those of the west coast, reflected the more seaward stations. This could explain why Chausey, which is an island that is far from terrestrial inputs and had the highest salinity, was the most oceanic area in the multivariate analysis and had oysters that were less enriched in the heavy C and N isotopes. Actually, 13C enrichment indicates that oys-ters on the east coast rely significantly on food items from benthic environments (France 1995). These oys-ters may rely on various potential food sources: phyto-plankton blooms which are greater on the east coast (except in Meuvaines, see chl a concentrations in Table 2), microphytobenthos that live in mudflat areas like sites in the Baie des Veys, and terrestrial inputs from one of the most important estuaries in Normandy (Marín Leal et al. 2008). Although C isotope values were quite similar for locations on the east coast, except for Géfosse, N isotope values displayed a gradi-ent from Géfosse (within Baie des Veys) to La Toc-quaise (the northernmost station) and Meuvaines (the easternmost station), with the gradient being linked to distance from the Baie des Veys. Multivariate analysis showed that N isotope variations were very well corre-lated with chl a concentrations in the water column and with the final weight of oysters. Variability in δ15N values has been linked to the effects of the watershed and also to anthropogenic nutrient sources such as sewage, urban runoff, industrial wastes, and contami-nated groundwater (Fry 1999), which is confirmed by the salinity gradient between east and west coasts in the multivariate analysis. Likewise, total watershed surface areas impacting coastal zones are 4× larger on
the east than on the west coast. The gradient in N was certainly due to terrestrial inputs delivered into estuar-ies and coastal systems by rivers draining agricultural and/or urban wastes that are enriched in N and other nutrients. Oysters inhabiting intertidal areas on the east coast study sites relied mostly on the benthic food web, albeit to a lesser extent than in the Westerschelde estuary, which is located in one of the highest popula-tion density and industrial areas in Europe (The Netherlands; Riera et al. 2000). This confirms the estuarine influence and ecosystem productivity cor-relation.
The general outcome of the mixing model applied to our data confirmed that oysters reared on the west coast of Cotentin relied mainly on POM (i.e. phyto-plankton) in contrast to oysters from the east coast that relied on a mixture of bentho–pelagic sources. These results are in agreement with previous studies done at smaller spatial scales in the same area (Marín Leal et al. 2008, Lefebvre et al. 2009). Similarly, Decottignies et al. (2007) and Malet et al. (2007) found that both benthic and pelagic resources were exploited by oys-ters in 2 estuarine embayments of the French Atlantic coast. Thus, resuspension processes combined with the nature of the sediment (fine sand and muddy sand) may contribute to the mixing and greater availability of benthic organic matter for the oysters located on the east coast of Cotentin. In contrast, the nature of sedi-ment (medium to coarse sand) along the west coast and the higher hydrodynamic processes may not favour the development or accumulation of benthic organic mat-ter that could be used by oysmat-ters once resuspended (Marín Leal et al. 2008).
As concluded by Jennings & Warr (2003) and Barnes et al. (2009), there is a statistical link between bivalve isotopic composition and environmental variables, such as salinity (and consequently nutrient concentra-tions) and temperature. In coastal ecosystems, how-ever, we conclude that biogeographic differences are probably due more to differences in distributions and availabilities of food source biomass than to differ-ences in isotopic values of one dominant food source (phytoplankton), as assumed by these authors. We also conclude that trophic step fractionation could not explain spatial differences at the scale of our study.
Oysters are known to be selective suspension feed-ers that can facultatively select food in suspension in their environment (Beninger et al. 2007). Hence, there is a possibility that the isotopic values of oysters reflect more the microalgal component of seston rather than the detrital component (Ulv and rPOM). Another sus-pension feeder such as Crepidula fornicata, which is well known as an indiscriminate suspension feeder (Beninger et al. 2007), would be an interesting model for the investigation of trophic typology of coastal
eco-systems. However, Lefebvre et al. (2009) showed that the diet of C. fornicata in the Baie des Veys, where oys-ters incorporated both microalgae and detritus (rPOM and Ulv), relied almost exclusively on a mixture of microalgae (phytoplankton and microphytobenthos). To our best knowledge, there is no study concerning selective feeding in oysters using isotopes and more research is needed in this area. The use of cultivated oysters ensures low noise in the results due to stan-dardized age, life cycle, densities, and immersion time. Thus, this study showed that oysters could provide an interesting bio-indicator to typify and monitor marine temperate ecosystem trophic functioning at large spa-tial and possibly interannual scales. In addition, differ-ences in isotopic ratios of food sources and trophic step fractionation may be considered at larger spatial scales if strong environmental gradients (e.g. in temperature or nutrients) are expected (Jennings & Warr 2003, Barnes et al. 2009). These results also have implica-tions for the determination of trophic baselines using bivalves in marine systems, when the trophic position of higher consumers is estimated in food webs (Post 2002, Jennings & Warr 2003, Fukumori et al. 2008). Utilization of different food sources on a regional scale resulted in changes in δ15N values of oysters of up to ~4 ‰, which is equivalent to one trophic level.
Acknowledgements. We thank SMEL and IFREMER for
tech-nical assistance through the HYDRONOR and REMONOR programs, Sea Pen Scientific Writing LLC (J. Purcell) for edi-torial assistance, P. Legoué for geographical information, S. Dubois for valuable comments on the study, and M.-P. Bataillé for help in isotope analysis. We also thank 4 anonymous reviewers for help in improving the manuscript. This work was supported by the Regional Council of Basse Normandie, the Agence de l’Eau Seine-Normandie, DIREN Basse-Nor-mandie, and DRAM/IFOP through the POMOYSTER pro-gram.
LITERATURE CITED
Aminot A, Kérouel R (2004) Hydrologie des écosystèmes marins paramètres et analyses. Editions IFREMER, Plouzané, Finistère
Anonymous (2006) La conchyliculture française. Comité National de la Conchyliculture (CNC), Paris
Barnes C, Sweeting CJ, Jennings S, Barry JT, Polunin NVC (2007) Effect of temperature and ration size on carbon and nitrogen stable isotope trophic fractionation. Funct Ecol 21:356–362
Barnes C, Jennings S, Barry JT (2009) Environmental corre-lates of large-scale spatial variation in the δ13C of marine
animals. Estuar Coast Shelf Sci 81:368–374
Bearhop S, Adams CE, Waldron S, Fuller RA, MacLeod H (2004) Determining trophic niche width: a novel approach using stable isotope analysis. J Anim Ecol 73:1007–1012 Beninger PG, Decottignies P, Guiheneuf F, Barillé L, Rincé Y
(2007) Comparison of particle processing by two intro-duced suspension feeders: selection in Crepidula fornicata
and Crassostrea gigas. Mar Ecol Prog Ser 334:165–177 Boyce MC, Lavery P, Bennett IJ, Horwitz P (2001) Spatial
vari-ation in the δ13C signature of Ruppia megacarpa (Mason)
in coastal lagoons of southwestern Australia and its impli-cation for isotopic studies. Aquat Bot 71:83–92
Cloern JE, Jassby AD (2008) Complex seasonal patterns of primary producers at the land –sea interface. Ecol Lett 11:1294–1303
Decottignies P, Beninger PG, Rincé Y, Riera P (2007) Trophic interactions between two introduced suspension feeders,
Crepidula fornicata and Crassostrea gigas, are influenced
by seasonal effects and qualitative selection capacity. J Exp Mar Biol Ecol 342:231–241
Dubois S, Blin JL, Bouchaud B, Lefebvre S (2007a) Isotope trophic step fractionation of suspension-feeding species: implications for food partitioning in coastal ecosystems. J Exp Mar Biol Ecol 351:121–128
Dubois S, Orvain F, Marín Leal JC, Ropert M, Lefebvre S (2007b) Small-scale spatial variability of food partitioning between cultivated oysters and associated suspension-feeding species, as revealed by stable isotopes. Mar Ecol Prog Ser 336:151–160
France RL (1995) Carbon-13 enrichment in benthic compared to planktonic algae: foodweb implications. Mar Ecol Prog Ser 124:307–312
Fry B (1999) Using stable isotopes to monitor watershed influ-ences on aquatic trophodynamics. Can J Fish Aquat Sci 56:2167–2171
Fry B (2006) Stable isotope ecology. Springer, New York Fukumori K, Oi M, Doi H, Takahashi D and others (2008)
Bivalve tissue as a carbon and nitrogen isotope baseline indicator in coastal ecosystems. Estuar Coast Shelf Sci 79:45–50
Gaye-Siessegger J, Focken U, Muetzel S, Abel H, Becker K (2004) Feeding level and individual metabolic rate affect δ13C and δ15N values in carp: implications for food web
studies. Oecologia 138:175–183
Gaye-Siessegger J, Focken U, Abel H, Becker K (2007) Star-vation and low feeding levels result in an enrichment of C-13 in lipids and N-15 in protein of Nile tilapia Oreochromis
niloticus L. J Fish Biol 71:90–100
Gustafson L, Showers W, Kwak T, Levine J, Stoskopf M (2007) Temporal and spatial variability in stable isotope composi-tions of a freshwater mussel: implicacomposi-tions for biomonitor-ing and ecological studies. Oecologia 152:140–150 Hawkins AJS, Smith RFM, Bayne BL, Heral M (1996) Novel
observations underlying the fast growth of suspension-feeding shellfish in turbid environments: Mytilus edulis. Mar Ecol Prog Ser 131:179–190
Hill JM, McQuaid CD, Kaehler S (2006) Biogeographic and nearshore–offshore trends in isotope ratios of intertidal mussels and their food sources around the coast of south-ern Africa. Mar Ecol Prog Ser 318:63–73
Hobson KA, Bairlein F (2003) Isotopic fractionation and turnover in captive garden warblers (Sylvia borin): impli-cations for delineating dietary and migratory associations in wild passerines. Can J Zool 81:1630–1635
Hobson KA, Clark RG (1992) Assessing avian diets using sta-ble isotopes. 2. Factors influencing diet-tissue fractiona-tion. Condor 94:189–197
Hobson KA, Alisauskas RT, Clark RG (1993) Stable nitrogen isotope enrichment in avian tissues due to fasting and nutritional stress: implications for isotopic analyses of diet. Condor 95:388–394
Hsieh HL, Kao WY, Chen CP, Liu PJ (2000) Detrital flows through the feeding pathway of the oyster (Crassostrea
gigas) in a tropical shallow lagoon: δ13C signals. Mar Biol
➤
➤
➤
➤➤
➤
➤
➤
➤
➤
➤
➤
➤
➤
➤
➤
➤
➤
➤
➤
➤
➤
➤
➤
136:677–684
Jennings S, Warr KJ (2003) Environmental correlates of large-scale spatial variation in the δ15N of marine animals. Mar
Biol 142:1131–1140
Le Goff R, Riou P (2006) Réseau hydrologique littoral Normand (RHLN): Rapport 2006. Report No. RST.LERN/06 -12, Ifremer, Port-en-Bessin, France
Lefebvre S, Marín Leal JC, Dubois S, Orvain F and others (2009) Seasonal dynamics of trophic relationships among co-occurring suspension feeders in two shellfish culture dominated ecosystems. Estuar Coast Shelf Sci 82:415–425 Levoy F, Anthony EJ, Monfort O, Larsonneur C (2000) The
morphodynamics of megatidal beaches in Normandy, France. Mar Geol 171:39–59
Lorrain A, Paulet YM, Chauvaud L, Savoye N, Donval A, Saout C (2002) Differential δ13C and δ15N signatures
among scallop tissues: implications for ecology and physi-ology. J Exp Mar Biol Ecol 275:47–61
Maksymowska D, Richard P, Piekarek-Jankowska H, Piera P (2000) Chemical and isotopic composition of the organic matter sources in the gulf of Gdansk (southern Baltic Sea). Estuar Coast Shelf Sci 51:585–598
Malet N, Sauriau PG, Faury N, Soletchnik P, Guillou G (2007) Effect of seasonal variation in trophic conditions and the gametogenic cycle on δ13C and δ15N levels of diploid and
triploid Pacific oysters Crassostrea gigas. Mar Ecol Prog Ser 346:203–217
Marín Leal JC, Dubois S, Orvain F, Galois R and others (2008) Stable isotopes (δ13C, δ15N) and modelling as tools to
esti-mate the trophic ecology of cultivated oysters in two con-trasting environments. Mar Biol 153:673–688
McCutchan JH, Lewis WM, Kendhall C, McGrath CC (2003) Variation in trophic shift for stable isotope ratios of carbon, nitrogen, and sulfur. Oikos 102:378–390
Miron MLL, Herrera MLG, Ramirez PN, Hobson KA (2006) Effect of diet quality on carbon and nitrogen turnover and isotopic discrimination in blood of a New World nectarivo-rous bat. J Exp Biol 209:541–548
Overman NC, Parrish DL (2001) Stable isotope composition of walleye: 15N accumulation with age and area-specific
dif-ferences in δ13C. Can J Fish Aquat Sci 58:1253–1260
Paulet YM, Lorrain A, Richard J, Pouvreau S (2006)
Experi-mental shift in diet δ13C: a potential tool for
ecophysio-logical studies in marine bivalves. Org Geochem 37: 1359–1370
Phillips DL, Gregg JW (2003) Source partitioning using stable isotopes: coping with too many sources. Oecologia 136: 261–269
Phillips DL, Newsome SD, Gregg JW (2005) Combining sources in stable isotope mixing models: alternative meth-ods. Oecologia 144:520–527
Piola RF, Moore SK, Suthers IM (2006) Carbon and nitrogen stable isotope analysis of three types of oyster tissue in an impacted estuary. Estuar Coast Shelf Sci 66:255–266 Post DM (2002) Using stable isotopes to estimate trophic
posi-tion: models, methods, and assumptions. Ecology 83: 703–718
Riera P (2007) Trophic subsidies of Crassostrea gigas, Mytilus
edulis and Crepidula fornicata in the Bay of Mont Saint
Michel (France): a δ13C and δ15N investigation. Estuar
Coast Shelf Sci 72:33–41
Riera P, Stal L, Nieuwenhuize J (2000) Heavy δ15N in
inter-tidal benthic algae and invertebrates in the Scheldt estu-ary (The Netherlands): effects of river nitrogen inputs. Estuar Coast Shelf Sci 51:365–372
Stuart V, Klumpp DW (1984) Evidence for food-resource partitioning by kelp-bed filter feeders. Mar Ecol Prog Ser 16:27–37
Sweeting CJ, Barry J, Barnes C, Polunin NVC, Jennings S (2007) Effects of body size and environment on diet-tissue δ15N fractionation in fishes. J Exp Mar Biol Ecol 340:1–10
Vanderklift MA, Ponsard S (2003) Sources of variation in con-sumer-diet δ15N enrichment: a meta-analysis. Oecologia
136:169–182
Vizzini S, Mazzola A (2003) Seasonal variations in the stable carbon and nitrogen isotope ratios (13C/12C and 15N/14N) of primary producers and consumers in a western Mediterranean coastal lagoon. Mar Biol 142: 1009–1018
Yokoyama H, Tamaki A, Koyama K, Ishihi Y, Shimoda K, Harada K (2005) Isotopic evidence for phytoplankton as a major food source for macrobenthos on an intertidal sand-flat in Ariake Sound, Japan. Mar Ecol Prog Ser 304: 101–116
Editorial responsibility: Matthias Seaman, Oldendorf/Luhe, Germany
Submitted: November 25, 2008; Accepted: June 29, 2009 Proofs received from author(s): September 4, 2009