HAL Id: hal-00298923
https://hal.archives-ouvertes.fr/hal-00298923
Submitted on 30 Jan 2008HAL is a multi-disciplinary open access
archive for the deposit and dissemination of sci-entific research documents, whether they are pub-lished or not. The documents may come from teaching and research institutions in France or abroad, or from public or private research centers.
L’archive ouverte pluridisciplinaire HAL, est destinée au dépôt et à la diffusion de documents scientifiques de niveau recherche, publiés ou non, émanant des établissements d’enseignement et de recherche français ou étrangers, des laboratoires publics ou privés.
Impacts of ditch cleaning on hydrological processes in a
drained peatland forest
H. Koivusalo, E. Ahti, A. Laurén, T. Kokkonen, T. Karvonen, R. Nevalainen,
L. Finér
To cite this version:
H. Koivusalo, E. Ahti, A. Laurén, T. Kokkonen, T. Karvonen, et al.. Impacts of ditch cleaning on hydrological processes in a drained peatland forest. Hydrology and Earth System Sciences Discussions, European Geosciences Union, 2008, 5 (1), pp.147-182. �hal-00298923�
HESSD
5, 147–182, 2008 Ditch cleaning impacts on hydrology H. Koivusalo et al. Title Page Abstract Introduction Conclusions References Tables Figures ◭ ◮ ◭ ◮ Back CloseFull Screen / Esc
Printer-friendly Version Interactive Discussion
EGU Hydrol. Earth Syst. Sci. Discuss., 5, 147–182, 2008
www.hydrol-earth-syst-sci-discuss.net/5/147/2008/ © Author(s) 2008. This work is licensed
under a Creative Commons License.
Hydrology and Earth System Sciences Discussions
Papers published in Hydrology and Earth System Sciences Discussions are under open-access review for the journal Hydrology and Earth System Sciences
Impacts of ditch cleaning on hydrological
processes in a drained peatland forest
H. Koivusalo1, E. Ahti2, A. Laur ´en1, T. Kokkonen3, T. Karvonen3, R. Nevalainen4, and L. Fin ´er1
1
Finnish Forest Research Inst., Joensuu Research Unit, P.O. Box 68, 80101 Joensuu, Finland 2
Finnish Forest Research Institute, Vantaa Research Unit, P.O. Box 18, 01370 Vantaa, Finland 3
Helsinki Univ. of Technology, Labor. of Water Resources, P.O. Box 5200, 02015 TKK, Finland 4
Geological survey of Finland, P.O. Box 1237, 70211 Kuopio, Finland
Received: 7 December 2007 – Accepted: 17 December 2007 – Published: 30 January 2008 Correspondence to: H. Koivusalo ([email protected])
HESSD
5, 147–182, 2008 Ditch cleaning impacts on hydrology H. Koivusalo et al. Title Page Abstract Introduction Conclusions References Tables Figures ◭ ◮ ◭ ◮ Back CloseFull Screen / Esc
Printer-friendly Version Interactive Discussion
EGU Abstract
One fourth (5.5 Mha) of forests in Finland are growing on peatlands that have been drained to improve forest growth. Forestry operations such as cuttings and ditch net-work maintenance in these areas may increase export of suspended solids and nu-trients, and deteriorate water quality in receiving lakes and rivers. Mitigation of the 5
deterioration calls for understanding how forest management operations affect peat-land hydrology. A process-based simulation model FEMMA was applied to quantify the effects of ditch network maintenance on peatland water balance. The model has sepa-rate computation routines for evapotranspiration in tree stand and understorey vegeta-tion, snow accumulation and melt, water movement in unsaturated and saturated soil, 10
and drainage. Hydraulic characteristics of peat, as well as different drainage designs can be parameterised in the model. The model was applied in artificially delineated research catchments in northern Finland, where the ditch network was maintained by cleaning and digging the ditches deeper. The simulation results indicated that ditch cleaning affected the water balance slightly and the effect was dependent on stand 15
characteristics and soil structure. When the growing stock volume was low and poorly conductive soil extended close to the soil surface, ditch cleaning increased evapo-transpiration. In stands with a high stock volume and a thick topmost layer of highly conductive soil, evapotranspiration was less affected. In the study catchments, the ef-fect of ditch cleaning on runoff was small compared to the error between measured 20
and modelled runoff.
1 Introduction
Forest cuttings in the middle of 20th century exceeded the annual growth of the stock volume in Finland. In order to increase timber production, peatland areas were arti-ficially drained with open ditches and reclaimed for forestry. In late 1960s’ and early 25
HESSD
5, 147–182, 2008 Ditch cleaning impacts on hydrology H. Koivusalo et al. Title Page Abstract Introduction Conclusions References Tables Figures ◭ ◮ ◭ ◮ Back CloseFull Screen / Esc
Printer-friendly Version Interactive Discussion
EGU (Kentt ¨amies, 2006). The drainage activities decreased gradually until late 1990s’, when
practically no drainage was conducted in pristine peatlands. The ditches deteriorate with time (H ¨okk ¨a et al. 2000) and can decrease the growth of tree stands, which calls for a maintenance of the ditch network, i.e. digging supplementary ditches or cleaning old ditches. The demand for the ditch network maintenance has increased and is cur-5
rently estimated to be about 160000 hectares per year (Tomppo, 2005). According to national forest inventory data from 1996 to 2003 about one fourth of managed forests in Finland are located on peatlands (Tomppo, 2005). The share of peatlands drained for forestry is about 54% of the total peatland area in Finland.
The hydrological effects of drainage of pristine peatlands have been studied widely 10
(e.g., Kaitera, 1955; Mustonen and Seuna, 1971; Starr and P ¨aiv ¨anen, 1981; Ahti, 1987; Pr ´evost et al, 1999). Holden et al. (2004) provides an extensive review about drainage effects on peatland hydrological and hydrochemical processes. It is well es-tablished that drainage of peatlands has both short- and long-term effects on hydro-logical processes, and that the effects are dependent on local conditions. Drainage 15
may decrease or increase low flow and peak flow volumes depending on peat type and structure, hydraulic characteristics of drainage network, location of drained area within the catchment, and vegetation response to drainage. The total volume of runoff often increases as the surface soil layers become dryer, the wetland vegetation degener-ates, and evapotranspiration decreases immediately after the drainage. The long-term 20
impact of successful drainage of peatland is seen as increased growth and biomass production of tree stands (e.g. Sepp ¨al ¨a, 1969; H ¨okk ¨a, 1997). Increased height and leaf area index (LAI) of the tree stand result in higher canopy interception and tran-spiration, which gradually leads to a decrease in total runoff volumes. A well-growing and densely-stocked tree stand may have a decisive role in the water balance of a 25
drained peatland. P ¨aiv ¨anen and Sarkkola (2000) suggested that maintenance of a ditch network is not necessarily required, when the volume of the growing stock is sufficiently large for efficient interception and transpiration. A question of major impor-tance for practical forestry is to assess whether ditch network maintenance is required,
HESSD
5, 147–182, 2008 Ditch cleaning impacts on hydrology H. Koivusalo et al. Title Page Abstract Introduction Conclusions References Tables Figures ◭ ◮ ◭ ◮ Back CloseFull Screen / Esc
Printer-friendly Version Interactive Discussion
EGU or whether the water uptake of the forest stand is large enough to maintain favourable
moisture conditions in the root zone. Drainage of peatland also has long-term influ-ences on the structure of the topmost peat layers. Decreasing soil moisture content enhances subsidence and decomposition of peat and can alter the soil hydraulic prop-erties (Holden et al., 2004).
5
Ditch network maintenance deteriorates water quality of receiving streams especially by increasing the loads of suspended solids (Joensuu, 2002). Erosion and sediment transport to the receiving water bodies are most conspicuous during the first years after the digging operations, but long-term loading can be seen both in suspended solids and nutrients such as mineral nitrogen and potassium. The water cycle and the 10
flow pathways are crucially important factors behind the water quality processes. While the hydrological effects of draining pristine peatland are well studied, it is not fully known whether ditch network maintenance has a similar effect on the water cycle of a peatland forest ecosystem. Joensuu et al. (1999, 2001, 2002) studied how ditch maintenance affected runoff, erosion, sediment transport, and nutrient loads by com-15
paring infrequent (biweekly–monthly) measurements from a large set of small catch-ment pairs. One pair included a treated catchcatch-ment and a control catchcatch-ment, both of which had been drained from one to three decades before the maintenance. Clear ef-fects of the ditch maintenance on water quality were detected, but the efef-fects on mea-sured runoff were less visible. Accordingly, ditch network maintenance presumably 20
had no significant effects on the flow volumes leaving the research sites. P ¨aiv ¨anen and Sarkkola (2000) also suggested that forest thinning and ditch maintenance had minor impacts on hydrology in terms of measured water table elevation. Ahti and P ¨aiv ¨anen (1997) reported that the ditch network maintenance alone resulted in a drop of ca 0.05 m in the highest levels of the water table. The data and methods used in these 25
studies did not support an evaluation of the ditch maintenance effects on water cycle as a whole.
Hydrological modelling is an appealing option for estimating the impacts of forest management practices on hydrological processes. A model calibrated against data
HESSD
5, 147–182, 2008 Ditch cleaning impacts on hydrology H. Koivusalo et al. Title Page Abstract Introduction Conclusions References Tables Figures ◭ ◮ ◭ ◮ Back CloseFull Screen / Esc
Printer-friendly Version Interactive Discussion
EGU contains a logical sequence of process descriptions explaining the relationship
be-tween input (meteorological) and output (hydrological) variables. Examples of com-bining experimental and model simulation results in explaining the influence of forest management (clear-cutting) on water and nutrient cycles are presented in Kokkonen et al. (2006), Koivusalo et al. (2006), and Laur ´en et al. (2005). In these case stud-5
ies, a hydrological and nitrogen transport model FEMMA included a separate process description for simulating how forest canopy affects interception, transpiration, snow accumulation, snowmelt, and soil water regime. Such a process description makes a distinction between water balance components in a forest ecosystem. Given the fact that a large proportion of forests are growing on drained peatland areas in Finland, it is 10
important to include a computation routine for simulating the effects of ditching on the water balance of a forest ecosystem.
Inclusion of drainage is a standard option in many simulation models that are used in agricultural water management (e.g., Skaggs, 1980; Jarvis, 1994; Oztekin et al., 2004; Oosterbaan et al., 1996). Amatya et al. (1997) and Skaggs et al. (2006) have 15
implemented ditch drainage scheme into a forest ecosystem model. Dunn and Mackay (1996) demonstrate through a modelling case study that drainage has an important influence on hydrology and that the direction of change caused by the drainage may not be intuitive. Mathematical modelling is a useful aid in testing hypotheses about the mechanisms behind the drainage effects.
20
This study is based on exploiting unpublished hydrological data from Tilanjoki, north-ern Finland, where four artificial catchments were formed using ditch delineation. The areas were newly drained in 1969 and twenty years later two of the areas were sub-ject to ditch network maintenance, i.e. cleaning and deepening of the ditches. FEMMA model was modified to include drainage fluxes and simulate the hydrological effects of 25
ditch cleaning. The objective was to compose from field measurements and simulation results a holistic view of changes in hydrological processes after the ditch cleaning. The purpose of the model application was to bind together snow, water table level, and runoff measurements, and to simulate how ditch cleaning affects interception,
transpi-HESSD
5, 147–182, 2008 Ditch cleaning impacts on hydrology H. Koivusalo et al. Title Page Abstract Introduction Conclusions References Tables Figures ◭ ◮ ◭ ◮ Back CloseFull Screen / Esc
Printer-friendly Version Interactive Discussion
EGU ration, snow processes, moisture content of peat layers, and runoff in different forest
stands. Quantitative assessment of hydrological fluxes and pathways in drained peat-lands serves for further estimation of ditch cleaning impacts on water quality at the catchment outlet.
2 Site description and field data
5
Tilanjoki research area is located in the northern Finland at the border between two mu-nicipalities, Utaj ¨arvi and Puolanka (Fig. 1a). There are large peatland areas drained for forestry within the region. Mean annual temperature in the area was 1◦C and
pre-cipitation was 550 mm/a during 1971–2000.
The peatland in Tilanjoki was drained for the first time in 1969, four experimental 10
catchments were delineated in 1983, and ditch cleaning was conducted in two of the catchments in 1989 (Fig. 1b). Spacing of the ditches ranges from 28 to 43 m, the depth of the ditches prior to the cleaning was 0.3–0.5 m, and 0.8 m after the cleaning.
Runoff at the outlet of each catchment was measured using v-notched weirs and limnigraphs plotting the height of the water level at the weir. Inside the four catchments 15
there were altogether 39 measurement sites, where snow depth and depth of the level of water table was measured at three points in each site (Fig. 1b, c). Air tempera-ture, relative humidity, and precipitation were recorded at two weather stations near the outlets of catchments 1 and 4. In addition to on-site meteorological measurements, precipitation, air temperature, relative humidity, wind speed, and cloudiness were avail-20
able from nearby stations operated by the Finnish Meteorological Institute in S ¨arkij ¨arvi (Utaj ¨arvi), Vaala and Puolanka (Fig. 1a).
The measurement period for hydrometeorological variables was from 1983 until 1994. The frequency of manual snow and groundwater level measurement was once in 1–2 weeks. Printed graphs of runoff and air temperature were processed in order to 25
produce daily time series of the measurements.
HESSD
5, 147–182, 2008 Ditch cleaning impacts on hydrology H. Koivusalo et al. Title Page Abstract Introduction Conclusions References Tables Figures ◭ ◮ ◭ ◮ Back CloseFull Screen / Esc
Printer-friendly Version Interactive Discussion
EGU L.) with a minor admixture of pubescent birch (Betula pubescens Ehrh.) and
Nor-way spruce (Picea abies L. Karst.). Stand characteristics, as well as characteristics of dominant trees (100 largest trees per ha), including height, diameter at breast height (DBH), and tree density were measured from sample plots establishes in 39 measure-ment sites. In 1983, 1989, and 1995 the percentage of Scots pine trees from the total 5
stand volume was 91%, 90 %, and 89%, respectively. The stand volumes in the mea-surement sites ranged from 1.6 to 154 m3/ha and the median volume was 30 m3/ha in 1983. The understorey vegetation was composed of Spaghnum moss, sedges, and dwarf shrubs.
The soil in Tilanjoki is composed of a peat layer underlain by mineral soil. The 10
thickness of peat layer varies considerably among the 39 measurement sites, ranging from 0.07 m to more than 1.5 m. In 37 sites subsoil is sand or till.
3 Methods
A simulation model, FEMMA, was calibrated and tested against hydrological measure-ments in Tilanjoki and applied to assess the impacts of ditch maintenance on water 15
balance components. FEMMA is a forest ecosystem model that separates the pro-cesses of overstorey and understorey interception and transpiration, snow accumula-tion and melt, soil- and ground water interacaccumula-tions, and streamflow. In the current study, FEMMA uses daily time series of air temperature, precipitation, relative humidity, wind speed, and downward short and long-wave radiation as an input. FEMMA has earlier 20
been applied in investigating how clear-cutting affects water and nitrogen fluxes in hill-slopes comprising mineral up-slope and peat down-slope areas (Koivusalo et al., 2006; Laur ´en et al., 2005).
In the current study, the model has undergone changes that were introduced to 1) improve the description of the canopy model in morphologically young and sparse peat-25
land forests, 2) facilitate computation of the drainage flux as a water balance compo-nent, 3) improve prediction of the water table level, and 4) formulate a spatial
descrip-HESSD
5, 147–182, 2008 Ditch cleaning impacts on hydrology H. Koivusalo et al. Title Page Abstract Introduction Conclusions References Tables Figures ◭ ◮ ◭ ◮ Back CloseFull Screen / Esc
Printer-friendly Version Interactive Discussion
EGU tion of a modelling domain for a drained peatland forest. The next paragraphs briefly
address these changes together with a general description of FEMMA.
3.1 Canopy and snow models
Based on input data characterising meteorological conditions above the canopy, the canopy model simulates downward short and long-wave radiation, wind speed, and 5
throughfall beneath the forest canopy. Relative humidity and air temperature are as-sumed not to be affected by the canopy. The process descriptions are given in detail in Wigmosta et al. (1994), Koivusalo and Kokkonen (2002), and Koivusalo et al. (2006).
The canopy model accounts for the interception of rainfall and snowfall in the over-storey vegetation (trees), and for the interception of rainfall in the underover-storey vegeta-10
tion (field and ground layer). Whenever the ground is snow-covered, interception in the understorey is disregarded. The stand density gives the fraction of the ground that is covered by the overstorey. In the current version of the model, the method presented by Raupach (1994) and Schaudt and Dickinson (2000) is applied to parameterize the zero plane displacement height and the roughness height as a function of the stand density 15
(canopy closure) and crown ratio (see Sect. 3.4.). The parameterization ensures that aerodynamic resistance decreases, when canopy closure approaches either full cov-erage in a dense forest or zero in a very sparse forest. The density of the understorey canopy is set to the value of one.
Potential evaporation of intercepted water is computed separately for the overstorey 20
and understorey vegetation according to a combination equation of the Penman– Monteith type where the stomatal resistance is set to zero. Evaporation of the inter-cepted water occurs at the potential rate until all interinter-cepted water is depleted. Transpi-ration, which is initiated after the canopy has become dry, is controlled by the stomatal resistance. The stomatal resistance is controlled by leaf area index (LAI), soil tem-25
perature, water vapour pressure deficit, photosynthetically active radiation (PAR), and soil moisture. Evaporation from the soil surface is neglected, because the moss and undecomposed litter covering the ground are assumed to block evaporation from the
HESSD
5, 147–182, 2008 Ditch cleaning impacts on hydrology H. Koivusalo et al. Title Page Abstract Introduction Conclusions References Tables Figures ◭ ◮ ◭ ◮ Back CloseFull Screen / Esc
Printer-friendly Version Interactive Discussion
EGU peat surface.
The snow model simulates snow surface energy balance, heat conduction through the snowpack into soil, snowmelt, liquid water retention in snow, melt water discharge out of the snowpack, and compaction of snow. The model has been described in more detail in Koivusalo et al. (2001, 2006).
5
3.2 Characteristic profile model
Soil and ground water interactions in FEMMA are described based on the characteristic profile approach of Karvonen et al. (1999). In the case of a drained peatland, the char-acteristic profile is a vertical one-dimensional column residing between the drainage ditch and the midpoint between two parallel ditches. Soil water movement and runoff 10
generation processes are simulated using daily series of throughfall/snowmelt as an input from the canopy and snow submodels. The characteristic profile model is quasi-two-dimensional in the sense that vertical and lateral water fluxes are computed alter-nately. The soil column is divided vertically into soil layers and water fluxes between the layers are computed according to the Richards equation (Richards, 1931). Tran-15
spiration is extracted from the soil layers residing within the root zone. Infiltration into a soil column is controlled either by the current air-filled pore volume of the topsoil layer or by the hydraulic conductivity between the soil surface and the topsoil layer. Water that cannot infiltrate is transported laterally to the ditch as surface runoff.
In order to simulate the effect of drainage on transpiration, the soil moisture control 20
on transpiration has been changed from earlier applications of FEMMA. Schw ¨arzel et al. (2006) studied moisture dynamics and evapotranspiration in a drained peatland and presented a relationship between the root zone pressure head and the ratio of actual and potential evapotranspiration. The relationship was adopted in FEMMA to charac-terise how excessive soil moisture or soil drying in the root zone decrease transpiration. 25
The stomatal resistance rs is given by
rs = rsminf−1 1 (Tsoil)f −1 2 (∆e)f −1 3 (PAR)f −1 4 (θ) (1)
HESSD
5, 147–182, 2008 Ditch cleaning impacts on hydrology H. Koivusalo et al. Title Page Abstract Introduction Conclusions References Tables Figures ◭ ◮ ◭ ◮ Back CloseFull Screen / Esc
Printer-friendly Version Interactive Discussion
EGU where rsmin is the minimum stomatal resistance, f1(Tsoil) is a function describing the
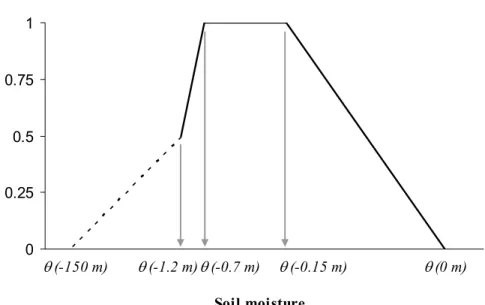
influence of the soil temperature Tsoil on rs, f2(∆e) defines the influence of the vapour pressure deficit ∆e on rs, f3(PAR) defines the influence of the photosynthetically active radiation (PAR) on rs, and f4(θ) depicts in the influence of the soil moisture θ on rs. The functions f1(Tsoil), f2(∆e), f3 (PAR) are given in Nijssen et al. (1997) and the soil
5
moisture function is illustrated in Fig. 2. When the pressure head of a computation node in the root zone is between −0.15 m and −0.70 m, soil moisture does not limit transpiration. Schw ¨arzel et al. (2006) sketch the relationship down to a pressure head of about −1.2 m, where the ratio of actual and potential evapotranspiration is about 0.5. In this study, the function f4(θ) is assumed to further decrease toward zero, when the
10
pressure head approaches the wilting point (dashed line in Fig. 2).
After the vertical fluxes and the resulting groundwater level of a column have been solved, the lateral flows to drainage ditches are computed. When there is snow on the ground, surface runoff is delayed using a linear storage. Lateral drainage flow within the soil column is computed according to Hooghoudt’s drainage equation (e.g., El-15
Sadek et al., 2001). The method assumes steady state recharge and drainage fluxes and allows a description of soils with different values of an effective saturated hydraulic conductivity above and below a ditch depth. The water level in the ditch is set equal to the elevation of the ditch bottom and it prescribes a boundary condition for the drainage flow computation. Ditch cleaning changes the boundary condition when the ditches are 20
dug deeper.
In earlier applications lateral groundwater flow was included in the model to account for subsurface flow in saturated soil (e.g. Kokkonen et al., 2006). In the current study, drainage flow is assumed to be the only lateral subsurface flow mechanism in peatlands drained with open ditches. After the drainage flow ceases no groundwater flow is 25
assumed to occur. The sum of two runoff components entering a ditch – surface runoff and drain flow – forms the total runoff.
HESSD
5, 147–182, 2008 Ditch cleaning impacts on hydrology H. Koivusalo et al. Title Page Abstract Introduction Conclusions References Tables Figures ◭ ◮ ◭ ◮ Back CloseFull Screen / Esc
Printer-friendly Version Interactive Discussion
EGU 3.3 Assumptions behind the parameterisation of ditch cleaning
In FEMMA only direct hydrological effects of ditch cleaning are considered. It is as-sumed that subsidence of peat soil has mainly occurred during the years following the initial drainage, and that the structure of the peat does not change during the five-year period following the ditch cleaning. The saturated hydraulic conductivity is assumed to 5
be significantly higher in topmost soil layers compared with subsoil, and this difference is not influenced by the ditch cleaning. The effect of the cleaning operation on the forest biomass is not simulated. Temporal changes in forest properties, such as LAI, canopy density, and tree height are estimated based on measured forest characteristics (see Sect. 3.4.). Understorey vegetation is assumed to adapt immediately to changed soil 10
moisture conditions, i.e. there is no degeneration of old species or invasion of new species. Both overstorey and understorey transpiration are limited by excessive soil moisture conditions or soil drying as described in Fig. 2. Changes in channel flow pro-cesses caused by ditch cleaning are ignored, because the flow delay caused by the ditch network is likely to be shorter than the daily modelling time step in the studied 15
research catchments.
3.4 Parameterisation of Tilanjoki experimental catchments
One characteristic profile, i.e. a soil column between two parallel drains, was prescribed for each measurement site where snow depth, snow water equivalent (SWE), and wa-ter table level had been measured. As the number of snow observation points per 20
site (three snow depths and one SWE) did not warrant the calibration of canopy and snow model separately for each site, the model was not calibrated against snow data. Instead, the snow model parameters were adopted from Koivusalo et al. (2006).
The input data for the snow and canopy model were from the closest weather sta-tions. Downward short- and long-wave radiation fluxes were estimated based on air 25
temperature, simulated clear-sky radiation, and cloudiness index (see e.g. Tarboton and Luce, 1996). Daily air temperature is averaged from temperature graphs
mea-HESSD
5, 147–182, 2008 Ditch cleaning impacts on hydrology H. Koivusalo et al. Title Page Abstract Introduction Conclusions References Tables Figures ◭ ◮ ◭ ◮ Back CloseFull Screen / Esc
Printer-friendly Version Interactive Discussion
EGU sured on-site during 1983–1988 and 1993–1994, but the missing temperature values
over these years and all temperature values during 1989–1992 were estimated as the mean temperature of the closest two weather stations (S ¨arkij ¨arvi and Puolanka). On-site temperature measurements during 1989-1992 were not used, because they dete-riorated the performance of the snow model.
5
Forest stand characteristics for each site were prescribed according to available in-ventory data from years 1983, 1989, and 1995. The stand properties between the measurement times were estimated with linear interpolation. In order to derive LAI at each site, the needle biomass of Scots pine was computed from the stand properties in the following way. A two-parameter Weibul distribution characterizing the stand DBH 10
distribution was fitted against the measured arithmetic mean DBH of the stand and the mean DBH of the dominant trees. Once the Weibul distribution was created, the nee-dle biomass was computed for ten discrete DBH classes using the biomass function proposed by Hakkila (1979). The biomass for different DBH classes was subsequently multiplied with the stem number and the specific needle area to produce the estimate of 15
LAI. Finally, the relationship between the effective winter leaf area index and the forest density (Pomeroy et al., 2002) was applied to derive canopy closure directly from the LAI estimate. Figure 3 illustrates the distribution of LAI and canopy closure in the mea-surement sites of Tilanjoki. The estimated values of LAI and the canopy closure were used in the parameterisation of the overstorey vegetation. The LAI for the understorey 20
vegetation was fixed to a value of 1.0.
The parameters of the functions controlling stomatal resistance are fixed to the val-ues reported in Nijssen et al. (1997), except for the parameter defining the minimum stomatal resistance (rsmin), which was calibrated against water table level and runoff measurements. In earlier studies with a similar model for simulating transpiration, the 25
value of minimum stomatal resistance for coniferous trees has ranged from 100 to
>1000 s/m in (e.g. Wigmosta et al., 1994, Nijssen et al., 1997; Whitaker et al., 2003,
Koivusalo et al., 2006). The rest of the canopy model parameters are set according to Koivusalo et al. (2006) with the exception of the new parameter, the crown ratio, which
HESSD
5, 147–182, 2008 Ditch cleaning impacts on hydrology H. Koivusalo et al. Title Page Abstract Introduction Conclusions References Tables Figures ◭ ◮ ◭ ◮ Back CloseFull Screen / Esc
Printer-friendly Version Interactive Discussion
EGU is set to a value of 3.5 (see e.g., Schaudt and Dickinson, 2000).
Tilanjoki area is characterized by shallow peat thickness in most of the measurement sites. In this study, topsoil refers to the shallow peat layer, except in two sites (7 and 8) with a deep peat formation, where the topsoil refers to peat layer above the depth of the ditches. Subsoil refers to all material below the topsoil. The depth of the topsoil 5
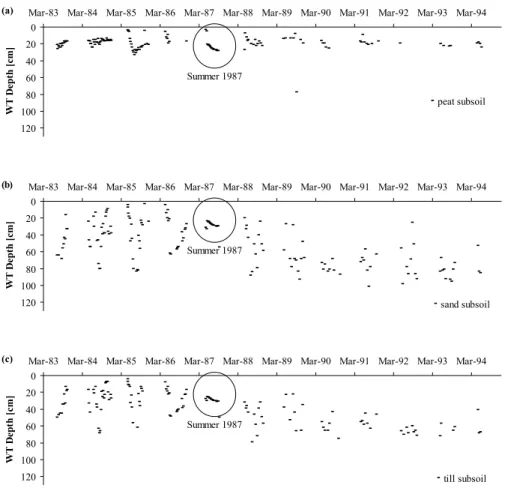
was measured at the groundwater tube located midway between two ditches. Spatial distribution of subsoil layers was interpreted from ground penetrating radar measure-ments. Spatial data indicate that the measurement sites are scattered through an area where subsoils are composed of peat, till, and sand. Spatial data together with wa-ter table measurements were utilized to prescribe the dominant type of subsoil at the 10
measurement sites. Water table after the ditch cleaning tends to drop lower at sites with sandy subsoil compared to sites with peat or till at the bottom (see Fig. 4 as an example). The dominant subsoil type was assumed to be sand at sites where water table dropped deep in the soil during summer dry periods and where bottom sandy deposits were located close to the measurement site according to the spatial data. In 15
sites where water table remained close to the soil surface, the subsoil type was set to till or peat according to the spatial data.
Water retention curves for the peat soils were described separately for the layer extending down to a depth of 0.3 m from soil surface, and for the peat layer below the depth of 0.3 m. The retention characteristics for these two peat layers were adopted 20
from P ¨aiv ¨anen (1973), who tabulated water retention characteristics at different depths and for different bulk densities of Sphagnum peat. In the current study, parameters of the van Genuchten (1980) function were fitted against the data from P ¨aiv ¨anen (1973). Temporal changes in peat characteristics were neglected. On-site measurements of particle size distribution and the relationship of Jauhiainen (2004) were used to derive 25
the water retention characteristics of mineral soils.
In addition to defining the thickness of the peat layer in each measurement site, a depth to an interface between a highly conductive upper soil layer and a less conductive lower soil layer was deduced from water table measurements in each site. In Fig. 4
HESSD
5, 147–182, 2008 Ditch cleaning impacts on hydrology H. Koivusalo et al. Title Page Abstract Introduction Conclusions References Tables Figures ◭ ◮ ◭ ◮ Back CloseFull Screen / Esc
Printer-friendly Version Interactive Discussion
EGU behaviour of water table during a rainy year of 1987 is encircled. Water table remained
close to the surface at all sites and varied less in time during the wet summer of 1987 compared to other years in Tilanjoki. The depth of an interface between soil zones having high and low hydraulic conductivity was set equal to the median level of the measured water table in the summer of 1987 (May-September). It was found out that 5
this depth of highly conductive upper soil layer differed from the depth of the peat layer, which indicates that the depth of the peat layer in the midpoint between two drains is not a good indicator of the conductivity structure of the soil. The values of saturated hydraulic conductivity for the different soil zones were calibrated against measured water table elevation in three different measurement sites and measured runoff from 10
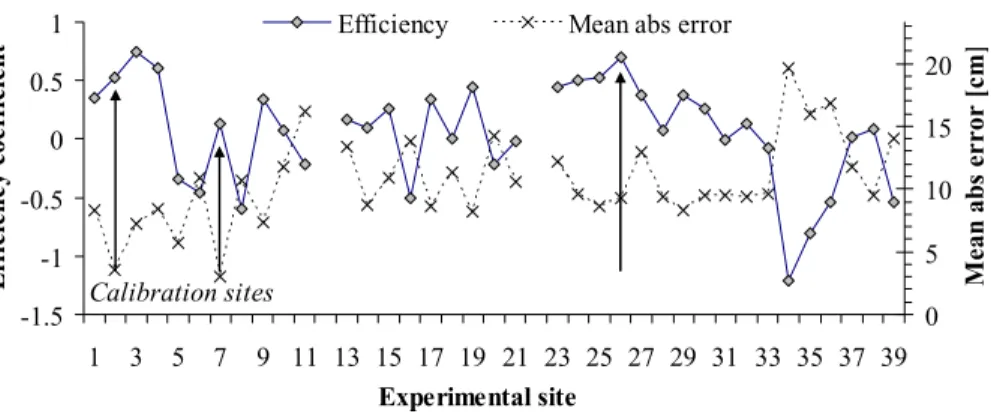
catchment 3. The three calibration sites shown in Fig. 1 were number 7 (peat subsoil), 26 (sand subsoil), and 30 (till subsoil). In addition to rsmin and soil conductivity values, the time constant (0.2 1/d) of the linear storage that delays surface runoff was adjusted in the model calibration.
In the model setup the depth of the drainage ditch was set to 0.5 m prior to the ditch 15
cleaning and 0.8 m after the cleaning that was carried out in study catchments 1 and 3 in autumn 1989. Changes in the depth of the ditches by erosion, sedimentation, and vegetation growth were disregarded.
The hydrological model is applied separately in each measurement site to simulate runoff input that enters the ditch network. In this study, total runoff from the study 20
catchments was modelled as an equally weighted average runoff from measurement sites 1–11 in Catchment 1, from sites 13–19 in Catchment 2, from sites 23–37 in Catchment 3, and from sites 20–22 plus 38–39 in Catchment 4 (Fig. 1).
HESSD
5, 147–182, 2008 Ditch cleaning impacts on hydrology H. Koivusalo et al. Title Page Abstract Introduction Conclusions References Tables Figures ◭ ◮ ◭ ◮ Back CloseFull Screen / Esc
Printer-friendly Version Interactive Discussion
EGU
4 Results and discussion
4.1 Snow
Ditch network maintenance changes soil moisture regime and soil temperature, but it is not likely to change snow accumulation and melt in a short time scale. However, modelling of snow accumulation and melt is a prerequisite for a holistic assessment of 5
hydrological processes in peatland forests.
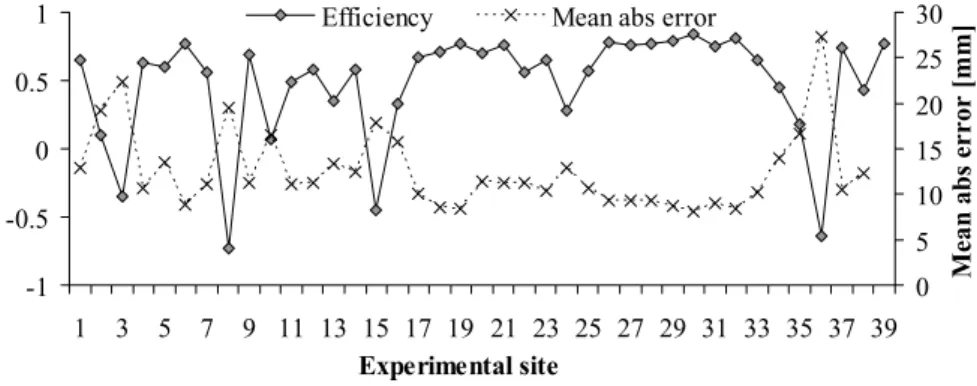
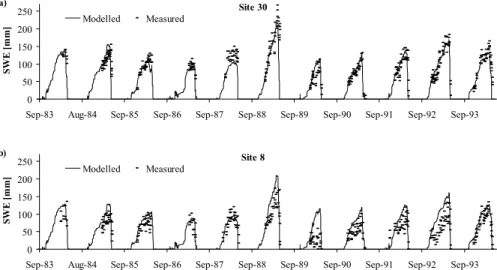
The median value of Nash and Sutcliffe (1970) efficiencies (Fig. 5) between the mea-sured and modelled snow water equivalent is 0.63 for all sites and the mean absolute error is 11 mm. Figure 6 presents the best snow simulation result at site 30 (Efficiency coefficient = 0.81, mean abs error = 8.1 mm) and the worst result at site 8 (Efficiency 10
coefficient = −0.73, mean abs error = 19 mm). The simulations suggest that the me-teorological variables are not consistent with snow measurements in Tilanjoki during some winters. For example, in winter 1992–1993 the measured snow water equivalent clearly decreases in December, whereas the simulated water equivalent increases. Be-cause snowmelt has a major role in the formation of spring floods, these deficiencies 15
in snow simulation increase errors in reproducing runoff.
The direct hydrological effects of ditch cleaning were studied by running the model at sites 1–11 and 23–37 with and without cleaning for years 1990–1994. According to the model, the cleaning of the ditches has no detectable short-term effects on snow accumulation and melt. Long term effects of the ditch cleaning would be seen, if the 20
growth of the tree stand were increased.
4.2 Water table level
Field measurements indicate that the ditch cleaning clearly decreases the water table levels at some sites, whereas the effect is negligible at other sites. The model was applied to shed light on the causes behind the varying measurements.
25
HESSD
5, 147–182, 2008 Ditch cleaning impacts on hydrology H. Koivusalo et al. Title Page Abstract Introduction Conclusions References Tables Figures ◭ ◮ ◭ ◮ Back CloseFull Screen / Esc
Printer-friendly Version Interactive Discussion
EGU the simulated and measured depth of the water table level for measurement sites 1–
39. The efficiency values in calibration sites (7, 26 and 30) range from 0.13 to 0.70 and mean absolute error from 3.0 to 9.5 cm. The median efficiency in the validation sites is 0.08 and the median of absolute errors is 9.6 cm. Figure 8 presents modelled and measured water table levels in sites 3 and 34, where the model had the best (efficiency 5
coefficient = 0.75, mean absolute error = 7.2 cm) and worst (efficiency coefficient = −1.2, mean absolute error = 20 cm) performance, respectively. Site 3 had sand as subsoil type, and site 34 had till subsoil. The calibrated value of the hydraulic conduc-tivity in the top soil layer (100 cm/h) is very high compared to the conductivities for sand subsoil (3.5 cm/h), till subsoil (0.75 cm/h), or peat (0.01 cm/h).
10
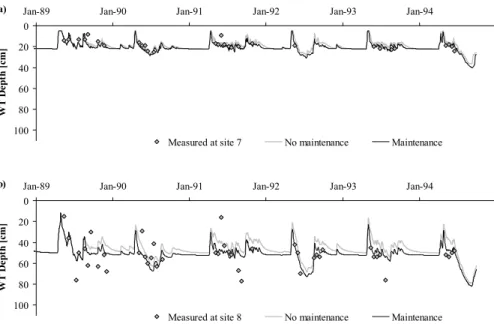
Figure 9 illustrates the simulation results for the time period following the ditch clean-ing in sites 7 and 8, where the stand volume in 1995 was 50 and 159 m3/ha, respec-tively, and the subsoil is peat. The depth of conductive soil layer is 0.25 m in site 7 and 0.52 m at site 8. The dynamics of water table is different between these two sites, which is mainly explained by the different depths of the conductive soil layer. The sim-15
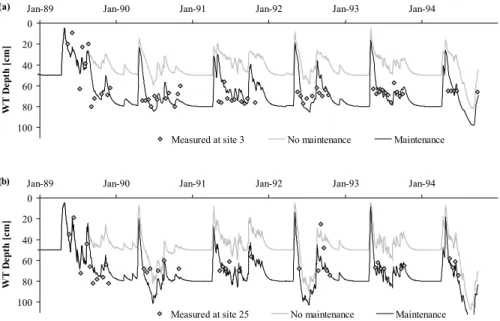
ulated effect of the ditch cleaning on water table level is small, when subsoil has a low value of hydraulic conductivity. Figure 10 shows the results for sites 3 and 25 with stand volumes of 17 and 195 m3/ha, respectively, with sandy subsoil, and with depths of conductive layers of 0.32 m and 0.25 m, respectively. The effect of ditch cleaning on water table level is clear in sites with more conductive subsoil layers, such as sand. 20
The large difference in stand volume does not affect the water level response to the ditch cleaning in Figs. 9 and 10.
Sensitivity of computed water table level to a perturbation in the ditch depth was studied by increasing the depth of the ditches by 1% for the time period after the ditch cleaning. The perturbation decreased the mean water table level by 0.63, 0.78, and 25
0.11% in sites where subsoil was sand, till, or peat, respectively. The level of the water table is sensitive to the ditch depth particularly in sites with coarse subsoil material.
HESSD
5, 147–182, 2008 Ditch cleaning impacts on hydrology H. Koivusalo et al. Title Page Abstract Introduction Conclusions References Tables Figures ◭ ◮ ◭ ◮ Back CloseFull Screen / Esc
Printer-friendly Version Interactive Discussion
EGU 4.3 Runoff
Accurate measurements of runoff in Tilanjoki were challenged by remote location of the site and harsh field conditions, which easily mask the effect of the ditch cleaning on runoff. Even though runoff from catchment 3 was used in the model calibration, the model results against measured daily runoff remained poor. The efficiency coefficients 5
for the all four catchments during 1983 and 1993 were 0.54 (C1), 0.62 (C2), 0.60 (C3, calibration data), and 0.54 (C4). Deficiencies in the snow simulation results are one of the most important factors affecting the model performance.
Yearly examination of runoff data reveals that measurements during some years were more successful than during other years. Year 1984 before the ditch cleaning and 10
year 1991 after the cleaning were studied in more detail to assess how ditch cleaning affects runoff. Figure 11a presents measured daily runoff at catchments 3 and 4 dur-ing 1984 together with the modelled runoff at catchment 4. Measured runoff from the catchment 3 is only slightly higher than runoff from the control catchment 4. The effi-ciency coefficient between the measured and modelled runoff at C3 is 0.74, whereas 15
the efficiency coefficient between the measured runoff series of the two catchments is 0.96. After ditch cleaning in 1991 (Fig. 11b) the measured runoff series from the two catchments are less similar (efficiency coefficient = 0.72), because the treated catch-ment 3 yields higher runoff relative to catchcatch-ment 4 than earlier in 1984. The modelled runoff in 1991 at catchment 3 with and without ditch cleaning (Fig. 11c) shows that 20
the modelled effect of the cleaning is less than the effect seen in the measured data (Figs. 11a and b). The efficiency coefficient between the modelled and measured runoff series at catchment 3 is 0.65 in 1991. The efficiency coefficients suggest that the ditch cleaning effect on runoff is less than the error between measured and modelled runoff. Sensitivity of computed runoff to a perturbation in the ditch depth was explored by 25
increasing the depth of the ditches by 1% from the value of 0.8 m after the ditch clean-ing. The resulting change in total runoff was less than 0.02% in all four catchments, which indicated that runoff was insensitive to a small change in the ditch depth.
HESSD
5, 147–182, 2008 Ditch cleaning impacts on hydrology H. Koivusalo et al. Title Page Abstract Introduction Conclusions References Tables Figures ◭ ◮ ◭ ◮ Back CloseFull Screen / Esc
Printer-friendly Version Interactive Discussion
EGU 4.4 Simulated water balance components
The modelled effect of ditch cleaning on the components of annual water balance in treated catchments 1 and 3 is seen as an increased air-filled pore space in soil, but the effect on water fluxes is small (Table 2). Ditch cleaning has an opposite impact on the two runoff components, but the net effect is that annual runoff is not affected by 5
the cleaning of the ditches. These results characterise average behaviour within the research catchments and the small simulated changes are in line with earlier investi-gations about hydrological impacts of ditch network maintenance (e.g., Joensuu, 2002; P ¨aiv ¨anen and Sarkkola, 2000).
More detailed information about the effects of ditch cleaning is produced by exploring 10
how water balance components change in various forest stands and soil structures. According to Fig. 12a ditch cleaning increases mean air-filled pore space in all sites and the effect is largest in sites with small depths of the highly conductive upper soil layer. Figure 12b suggests that transpiration either increases or decreases after the ditch cleaning. This response is explained by the soil moisture limit in Fig. 2, where 15
excessively high or low soil moisture restricts transpiration. In soils with a small depth of a highly conductive layer and low LAI, soil moisture in the rooting zone is often close to saturation. Drainage in this case shifts the soil moisture regime drier toward the optimum transpiration range, where moisture does not limit transpiration. In sites where the highly conductive top soil layer extends deeper than about 0.3 m or LAI is larger 20
than about 1.2, transpiration remains higher when ditch cleaning is not conducted. When soil moisture conditions in the root zone are within the optimal range before ditch cleaning, there is a chance that drainage shifts root zone soil moisture to the range where soil drying starts to limit transpiration. In this case, ditch network maintenance is an unnecessary treatment. The effect of ditch cleaning on transpiration in different 25
stands is reflected in the changes of total runoff (Fig. 11c). Ditch cleaning increases runoff in sites where transpiration decreases and vice versa. It needs to be noted that these results are sensitive to the parameterisation of the relationship between
HESSD
5, 147–182, 2008 Ditch cleaning impacts on hydrology H. Koivusalo et al. Title Page Abstract Introduction Conclusions References Tables Figures ◭ ◮ ◭ ◮ Back CloseFull Screen / Esc
Printer-friendly Version Interactive Discussion
EGU soil moisture in the root zone and transpiration (see Sect. 3) The finding that ditch
cleaning has minor effect on transpiration in some situations has practical relevance. Assuming dependency between transpiration and tree growth the results suggest that ditch cleaning may not be necessary when stand volume of the forest is sufficiently large (50–100 m3/ha) or top soil layer with a high hydraulic conductivity is sufficiently 5
deep (0.3 m or deeper in the current model parameterisation).
It must be reminded that the results about the effects of ditch cleaning on water balance components are based on model simulations. Available data alone do not support identification of small changes in hydrological fluxes following ditch cleaning.
5 Conclusions
10
A hydrological model was applied to assess how ditch cleaning affects water balance components during a period of five post-treatment years. The model application is subject to a number of assumptions: 1) the effect of ditch cleaning on the growth of the forest biomass is neglected during the five-year study period, 2) excessively high or low soil moisture limits transpirations in the root zone, 3) the structure of the soil is 15
not affected by ditch cleaning, and 4) there is no degeneration of peatland vegetation species or invasion of new species after the maintenance.
Simulated canopy and snow processes were not affected by ditch cleaning during the post-treatment years. Water table level was lowered and air-filled pore volume in soil increased, when the water level in ditches dropped due to ditch cleaning. Ditch 20
cleaning had no clear effect on transpiration and runoff volumes at the catchment scale. Model results from different sites revealed that the hydrological effect of ditch clean-ing was dependent on the volume of the forest stand and the hydraulic structure of soil. Ditch cleaning increases transpiration and decreases runoff in poorly drained sites with a small overstorey vegetation (LAI<1.2) and a small depth (<0.3 m) of a highly conduc-25
tive topmost soil layer. In sites with a larger forest stand and a thick topmost layer of conductive soil the cleaning of the ditch network has a minor influence on the water
HESSD
5, 147–182, 2008 Ditch cleaning impacts on hydrology H. Koivusalo et al. Title Page Abstract Introduction Conclusions References Tables Figures ◭ ◮ ◭ ◮ Back CloseFull Screen / Esc
Printer-friendly Version Interactive Discussion
EGU cycle and therefore, ditch cleaning in such sites is unnecessary. The effect of ditch
cleaning on annual runoff volumes is small compared with the uncertainties related to measuring and modelling runoff. Since there are no direct measurements of transpira-tion and soil moisture, the relatively large effects of ditch cleaning on these hydrological components were not validated against data.
5
Acknowledgements. The study is financed by the Ministry of Agriculture and Forestry in Finland (KUNTO-project). The first author acknowledges additional funding from the Land and Water Technology foundation. We are thankful to P. Vakkilainen, H. Mannerkoski, J. Laine, H. H ¨okk ¨a, J. Issakainen, I. Suopanki, T. Haikarainen, S. Putkinen, and T. Mattson for assistance and help in this work. The model application was supported by data from the Geological Survey of 10
Finland, the Finnish Meteorological Institute, and the Finnish Environment Institute.
References
Ahti, E.: Water balance of drained peatlands on the basis of water table simulation during the snowless period, Comm. Inst. For. Fenn., ISSN 0358-09609, 141 pp., 1987.
Ahti, E. and P ¨aiv ¨anen, J.: Response of stand growth and water table level to maintenance of 15
ditch networks within forest drainage areas, in: Northern Forested Wetlands: Ecology and Management, edited by: Trettin, C. C., Jurgensen, M. F., Grigal, D. F., Gale, M. R., and Jeglum, J. K., CRC Press Inc., Lewis Publishers, 449–457, 1997.
Amatya, D. M., Skaggs, R. W., Gregory, J. D., and Herrmann, R. B.: Hydrology of a drained forested pocosin watershed, J. Am. Water Resourc. As., 33, 535–546, 1997.
20
Dunn, S. M. and Mackay, R.: Modelling the hydrological impacts of open ditch drainage, J. Hydrol., 179, 37–66, 1996.
El-Sadek, A., Feyen, J. and Berlamont, J.: Comparison of models for computing drainage discharge, J. Irrig. Drain. E.-ASCE, 127, 363–369, 2001.
Hakkila, P.: Wood density survey and dry weight tables for pine, spruce and birch stems in 25
Finland, Comm. Ins. For. Fenn., 96, 1–59, 1979.
H ¨okk ¨a, H.: Models for predicting growth and yield in drained peatland stands in Finland, The Finnish Foresest Research Institute, Res. Papers, 651, 1997.
HESSD
5, 147–182, 2008 Ditch cleaning impacts on hydrology H. Koivusalo et al. Title Page Abstract Introduction Conclusions References Tables Figures ◭ ◮ ◭ ◮ Back CloseFull Screen / Esc
Printer-friendly Version Interactive Discussion
EGU H ¨okk ¨a, H., Alenius, V., and Salminen, H.: Predicting the need for ditch network maintenance in
drained peatland sites in Finland, Mires and Peat, 51, 1–10, 2000.
Holden, J., Chapman, P. J., and Labadz, J. C.: Artificial drainage of peatlands: hydrological and hydrochemical process and wetland restoration, Prog. Phys. Geog., 28, 95–123, 2004. Jarvis, N. J.: The MACRO model (Version 3.1). Technical description and sample simulations, 5
Reports and Dissertation 19, Department of Soil Science, Swedish University of Agricultural Sciences, Uppsala, Sweden, 51 pp., 1994.
Jauhiainen, M.: Relationships of particle size distribution curve, soil water retention curve and unsaturated hydraulic conductivity and their implications on water balance of forested and agricultural hillslopes, Helsinki University of Technology, Water Resourc. Publ., TKK-VTR-10
12, Espoo, 165 pp., 2004.
Joensuu, S.: Effects of Ditch Network Maintenance and Sedimentation Ponds on Export Loads of Suspended Solids and Nutrients from Peatland Forests, Finnish Forest Research Institute, Res. Papers, 868, Vantaa, 2002.
Joensuu, S., Ahti, E., and Vuollekoski, M.: The effects of peatland forest ditch maintenance on 15
suspended solids in runoff, Boreal Env. Res., 4, 343–355, 1999.
Joensuu, S., Ahti, E. and Vuollekoski, M.: Long-term effects of maintaining ditch networks on runoff water quality, Mires and Peat, 52, 17–29, 2001.
Joensuu, S. Ahti, E., and Vuollekoski, M.: Effects of ditch network maintenance on the chem-istry of runoff water from peatland forests, Scand. J. Forest Res., 17, 238–247, 2002. 20
Kaitera, P.: Raivauksen ja ojituksen vaikutuksesta vesist ¨oalueiden hydrologiaan, Mires and Peat, 6, 1–10, 1955 (in Finnish).
Karvonen, T., Koivusalo, H., Jauhiainen, M., Palko, J., and Weppling, K.: A hydrological model for predicting runoff from different land use areas, J. Hydrol., 217, 253–265, 1999.
Kentt ¨amies, K.: Mets ¨atalouden fosfori- ja typpikuormituksen m ¨a ¨aritys, in: Mets ¨atalouden 25
vesist ¨okuormitus MESUVE- projektin loppuraportti, edited by: Kentt ¨amies, K. and Mattsson, T., Finnsih Environment Institute (SYKE), 816, 9–28, 2006 (in Finnish).
Koivusalo, H. and Kokkonen, T.: Snow processes in a forest clearing and in a coniferous forest, J. Hydrol., 262, 145–164, 2002.
Koivusalo, H., Heikinheimo, M. and Karvonen, T.: Test of a simple two-layer parameterisation 30
to simulate the energy balance and temperature of a snowpack, Theor. Appl. Climatol., 70, 65–79, 2001.
Pent-HESSD
5, 147–182, 2008 Ditch cleaning impacts on hydrology H. Koivusalo et al. Title Page Abstract Introduction Conclusions References Tables Figures ◭ ◮ ◭ ◮ Back CloseFull Screen / Esc
Printer-friendly Version Interactive Discussion
EGU tinen, S., Seuna, P., Starr, M., and Fin ´er, L.: Parametrisation and application of a hillslope
hydrological model to assess impacts of forest clear-cutting on runoff generation, Environ. Modell. Softw., 21, 1324–1339, 2006.
Kokkonen, T., Koivusalo, H., Laur ´en, A., Penttinen, S., Starr, M., Kellom ¨aki, S., and Fin ´er, L.: Implications of processing spatial data from a forested catchment for a hillslope hydrological 5
model, Ecol. Model., 199, 393–408, 2006.
Laur ´en, A., Fin ´er, L., Koivusalo, H., Kokkonen, T., Karvonen, T., Kellom ¨aki, S, Mannerkoski, H., and Ahtiainen, M.: Water and nitrogen processes along a typical water flowpath and streamwater exports from a forested catchment and changes after clear-cutting: a modelling study, Hydrol. Earth Syst. Sc., 9, 1324–1339, 2005.
10
Mustonen, S. and Seuna, P.: Mets ¨aojituksen vaikutuksesta suon hydrologiaan, Publ. Water Res. Inst., 2, 63 pp., 1971 (in Finnish).
Nash, J. E. and Sutcliffe, J. V.: River flow forecasting through conceptual models, part I – a discussion of principles, J. Hydrol., 10, 282–290, 1970.
Nijssen, B., Haddeland, I., and Lettenmaier, D. P.: Point evaluation of a surface hydrology model 15
for BOREAS, J. Geophys. Res., 102(D24), 29 367–29 378, 1997.
Oosterbaan, R. J., Boonstra, J., and Rao, K. V. G. K.: The energy balance of groundwater flow, in: Subsurface-Water Hydrology, edited by: Singh, V. P. and Kumar, B., Kluwer Academic publishers, The Netherlands, 153–160, 1996.
Oztekin, T., Brown, L. C., and Fausey, N. R.: Modification and evaluation of the WEPP hillslope 20
model for subsurface drained cropland, An ASAE/CSAE Meeting Paper Number: 042274, St. Joseph, Mich. USA, 21 pp., 2004.
P ¨aiv ¨anen, J.: Hydraulic conductivity and water retention in peat soils, Acta For. Fenn., 129, 70 pp., 1973.
P ¨aiv ¨anen, J. and Sarkkola, S.: The effect of thinning and ditch network maintenance on the 25
water table level in a Scots pine stand on peat soil, Mires and Peat, 51, 131–138, 2000. Pomeroy, J. W., Gray, D. M., Hedstrom, N. R., and Janowicz, J. R.: Physically based estimation
of seasonal snow accumulation in the boreal forest, in: Proc. Eastern Snow Conf., Stowe, Vermont, USA, 93–108, 2002.
Pr ´evost, M., Plamondon, A. P., and Belleau, P.: Effects of drainage of a forested peatland on 30
water quality and quantity, J. Hydrol., 214, 130–143, 1999.
Raupach, M. R.: Simplified expressions for vegetation roughness length and zero-plane dis-placement as functions of canopy height and area index, Bound. Lay. Meteorol., 71, 211–
HESSD
5, 147–182, 2008 Ditch cleaning impacts on hydrology H. Koivusalo et al. Title Page Abstract Introduction Conclusions References Tables Figures ◭ ◮ ◭ ◮ Back CloseFull Screen / Esc
Printer-friendly Version Interactive Discussion
EGU 216, 1994.
Richards, L. A.: Capillary conduction of liquids through porous mediums, Physics, 1, 318–333, 1931.
Schaudt, K. J. and Dickinson, R. E.: An approach to deriving roughness length and zero-plane displacement height from satellite data, prototyped with BOREAS data, Agr. Forest 5
Meteorol., 104, 143–155, 2000.
Schw ¨arzel, K., ˇSim ˚unek, J, van Genuchten, M. Th., and Wessolek, G.: Measurement and modeling of soil-water dynamics and evapotranspiration of drained peatland soils, J. Plant Nutr. Soil Sci., 169, 762–774, 2006.
Sepp ¨al ¨a, K.: Post-drainage growth rate of Norway spruce and Scots pine on peat, Acta For. 10
Fenn., 93, 88 pp., 1969 (in Finnish with English summary).
Skaggs, R. W.: A water management model for artificially drained soils, North Carolina Agricul-tural Research Service, Raleigh, NC, 54 pp., 1980.
Skaggs, R. W., Amatya, D. M., Chescheir, G. M., Blanton, C. D., and Gilliam, J. W.: Effect of Drainage and Management Practices on Hydrology of Pine Plantation. Hydrology and 15
Management of Forested Wetlands, Proc. Int. Conf., New Bern, North Carolina, 3–14, 2006. Starr, M. and P ¨aiv ¨anen, J.: The influence of peatland forest drainage on runoff peak flows,
Mires and Peat, 32, 79–84, 1981.
Tarboton, D. G. and Luce, C. H.: Utah Energy Balance Snow Accumulation and Melt Model (UEB), Computer model technical description and users guide, Utah Water Research Labo-20
ratory and USDA Forest Service Intermountain Research Station, 1996.
Tomppo, E.: Suomen suomets ¨at 1951–2003, in: Suosta mets ¨aksi, Suometsien ekologisesti ja taloudellisesti kest ¨av ¨a k ¨aytt ¨o, edited by: Ahti, E., Kaunisto, S., Moilanen, M., and Murtovaara, I., Final Report, Res. Rep. Finnish Forest Res. Inst., Vantaa, 26–38, 2005 (in Finnish). van Genuchten, M. Th.: A closed-form equation for predicting the hydraulic conductivity of 25
unsaturated soils, Soil Sci. Soc. Am. J., 44, 892–898, 1980.
Whitaker, A., Alila, Y., Beckers, J., and Toews, D.: Application of the distributed hydrology soil vegetation model to Redfish Creek, British Columbia: model evaluation using internal catchment data, Hydrol. Process., 17, 199–224, 2003.
Wigmosta, M. S., Vail, L. W., and Lettenmaier, D. P.: A distributed hydrology-vegetation model 30
HESSD
5, 147–182, 2008 Ditch cleaning impacts on hydrology H. Koivusalo et al. Title Page Abstract Introduction Conclusions References Tables Figures ◭ ◮ ◭ ◮ Back CloseFull Screen / Esc
Printer-friendly Version Interactive Discussion
EGU
Table 1.Mean annual water balance components (mm/a) during 1990-1994 for measurement sites located in catchments 1 and 3. The difference (mm/a) between the cleaning and no-cleaning conditions is shown in parentheses.
Catchment 1 Catchment 3
No cleaning Cleaning No cleaning Cleaning
Precipitation 561 561 (±0) 561 561 (±0)
Throughfall beneath overstorey 480 480 (±0) 474 474 (±0)
Throughfall on ground/snow 456 456 (±0) 450 450 (±0) Overstorey evaporation 81 81 (±0) 87 87 (±0) Understorey evaporation 24 24 (±0) 24 24 (±0) Snow evaporation 14 14 (±0) 14 14 (±0) Snowmelt/rain 448 448 (±0) 442 442 (±0) Overstorey transpiration 48 48 (+0) 58 57 (−1) Understorey transpiration 89 97 (+8) 102 102 (±0) Total Evapotranspiration 256 264 (+8) 285 284 (−1) Drainage flow 304 306 (+2) 279 287 (+8) Surface runoff 10 1 (−9) 7 1 (−6) Total runoff 314 307 (−7) 286 288 (+2)
HESSD
5, 147–182, 2008 Ditch cleaning impacts on hydrology H. Koivusalo et al. Title Page Abstract Introduction Conclusions References Tables Figures ◭ ◮ ◭ ◮ Back CloseFull Screen / Esc
Printer-friendly Version Interactive Discussion EGU C1 (ditch maintenance) C2 (control) C3(ditch maintenance) C4 (control) 0 500 m 60° N (a) (b) 0 200 km 25° E Pu Vaala Särkijärvi Tilanjoki olanka 60° N Helsinki c) S1…S3 W1…W3 28-43 m Ditch
Fig. 1.Location of Tilanjoki and weather stations in S ¨arkij ¨arvi, Puolanka, and Vaala (a), layout of 4 research catchments (C1. . . C4) and 39 measurement sites (b), and layout of a measure-ment site between two ditches. W1. . . W3 refer to water table measuremeasure-ment locations and S1. . . S3 to snow measurements. Forest compartments with different tree stand properties are delineated with gray lines in (b).
HESSD
5, 147–182, 2008 Ditch cleaning impacts on hydrology H. Koivusalo et al. Title Page Abstract Introduction Conclusions References Tables Figures ◭ ◮ ◭ ◮ Back CloseFull Screen / Esc
Printer-friendly Version Interactive Discussion EGU 0 0.25 0.5 0.75 1 θ(-0.15 m) f4(θ) Soil moisture θ(-0.7 m) θ(-1.2 m) θ(-150 m) θ(0 m)
Fig. 2. Relationship between θ (pressure head) and function f4(θ), where θ is soil moisture content. Soil moisture does not limit transpiration, when f4(θ) is equal to 1.0.
HESSD
5, 147–182, 2008 Ditch cleaning impacts on hydrology H. Koivusalo et al. Title Page Abstract Introduction Conclusions References Tables Figures ◭ ◮ ◭ ◮ Back CloseFull Screen / Esc
Printer-friendly Version Interactive Discussion EGU 0 1 2 3 4 5 6 7 1 6 11 16 21 26 31 36 LA I [ -] -1 -0.8 -0.6 -0.4 -0.2 0 0.2 0.4 0.6 0.8 1 C a n o p y c lo su r e [ -] 1983 1989 1995 Cd Cd Cd
Fig. 3. Estimated values of LAI and canopy closure in years 1983, 1989, and 1995 in 39 measurement sites of Tilanjoki.
HESSD
5, 147–182, 2008 Ditch cleaning impacts on hydrology H. Koivusalo et al. Title Page Abstract Introduction Conclusions References Tables Figures ◭ ◮ ◭ ◮ Back CloseFull Screen / Esc
Printer-friendly Version Interactive Discussion EGU 0 20 40 60 80 100 120
Mar-83 Mar-84 Mar-85 Mar-86 Mar-87 Mar-88 Mar-89 Mar-90 Mar-91 Mar-92 Mar-93 Mar-94
WT D e p th [ c m ] peat subsoil (a) Summer 1987 0 20 40 60 80 100 120
Mar-83 Mar-84 Mar-85 Mar-86 Mar-87 Mar-88 Mar-89 Mar-90 Mar-91 Mar-92 Mar-93 Mar-94
WT D e p th [ c m ] sand subsoil (b) Summer 1987 0 20 40 60 80 100 120
Mar-83 Mar-84 Mar-85 Mar-86 Mar-87 Mar-88 Mar-89 Mar-90 Mar-91 Mar-92 Mar-93 Mar-94
WT D e p th [ c m ] till subsoil (c) Summer 1987
Fig. 4. Measured depth of the water table level (WT) in measurement site 7 with peat subsoil
(a), site 26 with sand subsoil (b), and site 30 with till subsoil (c). Measured values during the wet summer of 1987 are circled.
HESSD
5, 147–182, 2008 Ditch cleaning impacts on hydrology H. Koivusalo et al. Title Page Abstract Introduction Conclusions References Tables Figures ◭ ◮ ◭ ◮ Back CloseFull Screen / Esc
Printer-friendly Version Interactive Discussion EGU -1 -0.5 0 0.5 1 1 3 5 7 9 11 13 15 17 19 21 23 25 27 29 31 33 35 37 39 Experimental site E ff ic ie n c y c o e ff ic ie n t 0 5 10 15 20 25 30 M e an a b s e r r o r [ m m ]
Efficiency Mean abs error
Fig. 5.Efficiency coefficients and values of mean absolute error between measured and
HESSD
5, 147–182, 2008 Ditch cleaning impacts on hydrology H. Koivusalo et al. Title Page Abstract Introduction Conclusions References Tables Figures ◭ ◮ ◭ ◮ Back CloseFull Screen / Esc
Printer-friendly Version Interactive Discussion EGU Site 30 0 50 100 150 200 250
Sep-83 Aug-84 Sep-85 Sep-86 Sep-87 Sep-88 Sep-89 Sep-90 Sep-91 Sep-92 Sep-93
S WE [ m m ] Modelled Measured Mitattu2 Mitattu3 (a) Site 8 0 50 100 150 200 250
Sep-83 Aug-84 Sep-85 Sep-86 Sep-87 Sep-88 Sep-89 Sep-90 Sep-91 Sep-92 Sep-93
S W E [mm] Modelled Measured Mitattu2 Mitattu3 (b)
Fig. 6.Simulated snow water equivalent (SWE) and measured SWE at three points in site 30
HESSD
5, 147–182, 2008 Ditch cleaning impacts on hydrology H. Koivusalo et al. Title Page Abstract Introduction Conclusions References Tables Figures ◭ ◮ ◭ ◮ Back CloseFull Screen / Esc
Printer-friendly Version Interactive Discussion EGU -1.5 -1 -0.5 0 0.5 1 1 3 5 7 9 11 13 15 17 19 21 23 25 27 29 31 33 35 37 39 Experimental site E ff ic ie n cy c oe ff ic ie n t 0 5 10 15 20 M e an ab s e r r or [ c m ]
Efficiency Mean abs error
Calibration sites
Fig. 7.Efficiency coefficients between the measured and modelled water table level in 39
HESSD
5, 147–182, 2008 Ditch cleaning impacts on hydrology H. Koivusalo et al. Title Page Abstract Introduction Conclusions References Tables Figures ◭ ◮ ◭ ◮ Back CloseFull Screen / Esc
Printer-friendly Version Interactive Discussion EGU 0 20 40 60 80 100
Mar-83 Mar-84 Mar-85 Mar-86 Mar-87 Mar-88 Mar-89 Mar-90 Mar-91 Mar-92 Mar-93 Mar-94
W T D e p th [ c m ] Measured at site 3 Modelled (a) 0 20 40 60 80 100
Mar-83 Mar-84 Mar-85 Mar-86 Mar-87 Mar-88 Mar-89 Mar-90 Mar-91 Mar-92 Mar-93 Mar-94
W T D e p th [ c m ] Measured at site 34 Modelled (b)
HESSD
5, 147–182, 2008 Ditch cleaning impacts on hydrology H. Koivusalo et al. Title Page Abstract Introduction Conclusions References Tables Figures ◭ ◮ ◭ ◮ Back CloseFull Screen / Esc
Printer-friendly Version Interactive Discussion EGU 0 20 40 60 80 100
Jan-89 Jan-90 Jan-91 Jan-92 Jan-93 Jan-94
WT D e p th [ c m ]
Measured at site 7 No maintenance Maintenance
(a) 0 20 40 60 80 100
Jan-89 Jan-90 Jan-91 Jan-92 Jan-93 Jan-94
WT D e p th [ c m ]
Measured at site 8 No maintenance Maintenance
(b)
Fig. 9. Simulated depth of water table level with and without ditch cleaning, and measured depth (ditch network is maintained) in site 7 (a) and site 8 (b) with peat subsoil.
HESSD
5, 147–182, 2008 Ditch cleaning impacts on hydrology H. Koivusalo et al. Title Page Abstract Introduction Conclusions References Tables Figures ◭ ◮ ◭ ◮ Back CloseFull Screen / Esc
Printer-friendly Version Interactive Discussion EGU 0 20 40 60 80 100
Jan-89 Jan-90 Jan-91 Jan-92 Jan-93 Jan-94
WT D e p th [ c m ]
Measured at site 3 No maintenance Maintenance
(a) 0 20 40 60 80 100
Jan-89 Jan-90 Jan-91 Jan-92 Jan-93 Jan-94
WT D e p th [ c m ]
Measured at site 25 No maintenance Maintenance
(b)
Fig. 10. Simulated depth of water table level with and without ditch cleaning, and measured depth (ditch network is maintained) in site 3 (a) and site 25 (b) with sandy subsoil.
HESSD
5, 147–182, 2008 Ditch cleaning impacts on hydrology H. Koivusalo et al. Title Page Abstract Introduction Conclusions References Tables Figures ◭ ◮ ◭ ◮ Back CloseFull Screen / Esc
Printer-friendly Version Interactive Discussion EGU 0 5 10 15
Jan-1984 Mar-1984 May-1984 Jul-1984 Sep-1984 Nov-1984
R u n o ff m m /d
. Measured at C3 (before treatment)
Measured at C4 (control) Modelled at C3 (a) 0 2 4 6 8 10
Jan-1991 Mar-1991 May-1991 Jul-1991 Sep-1991 Nov-1991
R u n o ff m m /d
. Measured at C3 (after treatment)
Measured at C4 (control) (b) 0 2 4 6 8 10
Jan-1991 Mar-1991 May-1991 Jul-1991 Sep-1991 Nov-1991
R u n o ff m m /d . Modelled at C3 (treatment)
Modelled at C3 (no treatment)
(c)
Fig. 11. Measured runoff from catchments C3 and C4, and modelled runoff from catchment
C3 in 1984 (a), measured runoff from catchments C3 and C4 in 1991 (b), and modelled runoff from catchment C3 with and without ditch cleaning (c). Ditch cleaning was conducted in 1989.
HESSD
5, 147–182, 2008 Ditch cleaning impacts on hydrology H. Koivusalo et al. Title Page Abstract Introduction Conclusions References Tables Figures ◭ ◮ ◭ ◮ Back CloseFull Screen / Esc
Printer-friendly Version Interactive Discussion
EGU Air volume (no cleaning) / air volume (cleaning)
0 20 40 60 80 100 0 10 20 30 40 50 6 Conductivity depth [cm] % a 0 ) LAI: 2.5 0
Transpiration (no cleaning) / Transpiration (cleaning)
0 20 40 60 80 100 120 0 10 20 30 40 50 6 Conductivity depth [cm] % b 0 ) LAI: 2.5 0
Total runoff (no cleaning) / Total runoff (cleaning)
90 95 100 105 110 115 120 0 10 20 30 40 50 Conductivity depth [cm] % c 60 ) LAI: 2.5 0
Fig. 12.Change in the air-filled pore space of soil between no cleaning and cleaning conditions in sites with different depth of a highly conductive upper soil layer and different LAI (a), change in transpiration between no cleaning and cleaning conditions in sites with different depth of the conductive layer and LAI (b), and change in runoff between no cleaning and cleaning conditions in sites with different depth of the conductive layer and LAI (c). The change (%) is computed by dividing the long term average value for the no cleaning conditions by the average value for the cleaning conditions.