HAL Id: hal-00316265
https://hal.archives-ouvertes.fr/hal-00316265
Submitted on 1 Jan 1996
HAL is a multi-disciplinary open access
archive for the deposit and dissemination of sci-entific research documents, whether they are pub-lished or not. The documents may come from teaching and research institutions in France or abroad, or from public or private research centers.
L’archive ouverte pluridisciplinaire HAL, est destinée au dépôt et à la diffusion de documents scientifiques de niveau recherche, publiés ou non, émanant des établissements d’enseignement et de recherche français ou étrangers, des laboratoires publics ou privés.
EISCAT verification in the development of ionospheric
tomography
I. K. Walker, J. A. T. Heaton, L. Kersley, C. N. Mitchell, S. E. Pryse, M. J.
Williams
To cite this version:
I. K. Walker, J. A. T. Heaton, L. Kersley, C. N. Mitchell, S. E. Pryse, et al.. EISCAT verification in the development of ionospheric tomography. Annales Geophysicae, European Geosciences Union, 1996, 14 (12), pp.1413-1421. �hal-00316265�
Ann. Geophysicae 14, 1413—1421 (1996) ( EGS — Springer-Verlag 1996
EISCAT verification in the development of ionospheric tomography
I. K. Walker, J. A. T. Heaton, L. Kersley, C. N. Mitchell, S. E. Pryse, M. J. WilliamsDepartment of Physics, University of Wales, Aberystwyth, SY23 3BZ, UK Received: 26 February 1996/Revised: 6 May 1996/Accepted: 15 May 1996
Abstract. This paper highlights the important role played by the EISCAT radar for verification in the development of tomographic techniques to produce images of iono-spheric electron density. A brief review is given of some of the stages in the application of tomographic reconstruc-tion techniques to the ionosphere. Results are presented to illustrate the effectiveness of the method in imaging iono-spheric structures at high latitudes. In addition, the results include the first tomographic image of the ionosphere for a region extending from mid-latitudes over mainland Scandinavia to high latitudes above Svalbard.
1 Introduction
In the past few years ionospheric tomography has become an established technique for imaging ionospheric electron density. The application of tomographic techniques to the imaging of electron density was first suggested by Austen
et al. (1986). In the ionospheric application, the line
inte-gral of electron density, known as the total electron con-tent (TEC), is measured over a large number of intersect-ing paths crossintersect-ing a region of interest. The resultintersect-ing data set is then inverted in a reconstruction algorithm to give a two-dimensional image of the electron density, usually in a height versus latitude plane. EISCAT has played a vital role in the development of ionospheric tomography by providing independent observations of electron density in a region at auroral latitudes where the horizontal struc-turing of the ionosphere on a scale of tens to hundreds of kilometres is well suited to imaging by the tomographic method. Pryse and Kersley (1992) reported the first inde-pendent verification of a tomographic image using elec-tron-density measurements provided by the EISCAT radar. Whilst this represented a rudimentary initial test of the potential application of tomographic techniques to
Correspondence to: I. K. Walker
image the ionosphere, results from a later, more sophisti-cated experimental campaign reported by Raymund et al. (1993) produced two images of the main trough which were compared to measurements taken using the EISCAT common program CP3f. Subsequent developments have involved the use of a UK Special Program for the radar, designed specifically to take measurements of electron density for independent comparison with tomographic reconstruction images. The availability of the density measurements from EISCAT has proved highly beneficial in assessing various refinements to the algorithms used for the production of tomographic reconstructions. A brief summary of these developments is given here, together with some recent results in which the radar is used for verification of a small section of a tomographic image that extends from the polar ionosphere to mid-latitudes. It can be noted that recently measurements from EISCAT have also been presented by other workers in connection with ionospheric tomography. Markkanen et al. (1995) de-scribe an alternative approach to the inversion problem and report two results from an experimental campaign where they were able to make comparisons between re-constructed images and simultaneous EISCAT observa-tions above Tromsø.
2 The experiment
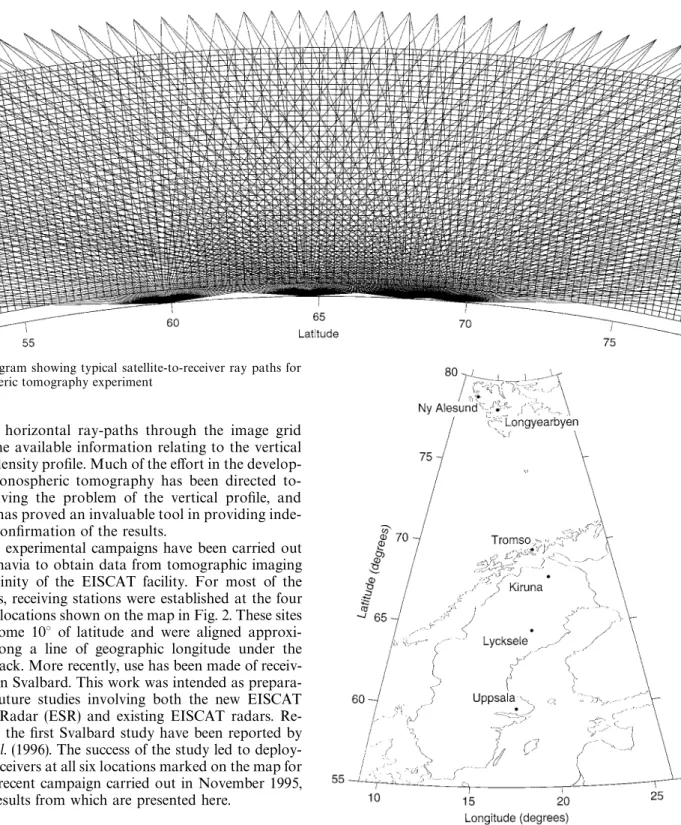
Typical geometry for a tomographic experiment is shown in Fig. 1. The radio transmissions come from satellites in the Navy Navigational Satellite System (NNSS). These satellites are in near-circular polar orbits at an altitude of about 1100 km, transmitting phase-coherent signals on 150 and 400 MHz. The received signals can be used to estimate ionospheric TEC by means of the differential carrier phase technique. Measurements of electron con-tent made at the chain of receiving stations are then combined to reconstruct two-dimensional images of elec-tron density on a latitude-versus-height grid. It is impor-tant to note that a limitation of ionospheric tomography is imposed by the satellite-to-receiver geometry, where
Fig. 1. Diagram showing typical satellite-to-receiver ray paths for an ionospheric tomography experiment
a lack of horizontal ray-paths through the image grid reduces the available information relating to the vertical electron-density profile. Much of the effort in the develop-ment of ionospheric tomography has been directed to-wards solving the problem of the vertical profile, and EISCAT has proved an invaluable tool in providing inde-pendent confirmation of the results.
Several experimental campaigns have been carried out in Scandinavia to obtain data from tomographic imaging in the vicinity of the EISCAT facility. For most of the campaigns, receiving stations were established at the four mainland locations shown on the map in Fig. 2. These sites covered some 10° of latitude and were aligned approxi-mately along a line of geographic longitude under the satellite track. More recently, use has been made of receiv-ing sites on Svalbard. This work was intended as prepara-tion for future studies involving both the new EISCAT Svalbard Radar (ESR) and existing EISCAT radars. Re-sults from the first Svalbard study have been reported by Pryse et al. (1996). The success of the study led to deploy-ment of receivers at all six locations marked on the map for the most recent campaign carried out in November 1995, the first results from which are presented here.
3 EISCAT special program
While the first comparison of radar and tomographic images were made using the CP3f common program, it was appreciated that this meridional scan provided too coarse a picture both temporally and spatially; a special radar program was therefore developed for this purpose. The UK-EISCAT-Special Program TOMO has been de-signed specifically to make measurements to determine the latitudinal and vertical structuring in electron density for use in verification of tomographic images. The
Fig. 2. Map showing the location of receiving stations used in Scandinavia
program uses the UHF radar in a meridional scan, ini-tially with the beam pointing nearly vertical at Tromsø, with subsequent southward motion in 56 steps of 0.125° (&15 km) at 300-km altitude. The complete scan covers some 7° latitude at this height, with height resolution being retained at about 30$8 km through use of three radar controller programs. The cycle time for the
repetition of the scan pattern is 20 min, which is compara-ble with the horizon-to-horizon duration of a satellite pass.
4 Results
The problem of missing horizontal ray paths through the image region in ionospheric tomography has been ad-dressed by supplying an estimate of the background iono-sphere for initialisation of the iterative reconstruction algorithm. The vertical ionisation profile of this back-ground is a key feature in the successful imaging of iono-spheric structures. Raymund et al. (1993) described early attempts at reconstructions using a linear combination of a set of ionospheres produced by the IRI-90 model (Bilitza, 1990) to create a background ionosphere to in-itialise the Multiplicative Algebraic Reconstruction Tech-nique (MART) algorithm. Whilst these first attempts showed broad agreement between horizontal structures produced using tomographic imaging and those observed using EISCAT, it was found that the ionospheric model, and hence the tomographic image, produced unrealistic topside profiles under conditions of high sunspot number. In subsequent work, Kersley et al. (1993) made use of the USU model (Daniell, 1991) which was found to give better representation of the topside ionisation distribution at high latitudes. Whilst improved agreement was found between the tomographic images and corresponding EIS-CAT observations, the results revealed limitations in the sole use of ionospheric models to describe the background ionosphere at high latitudes. It was noted that the models are designed to represent average conditions, which they do with varying degrees of success. However, they are less able to give an accurate description of extreme iono-spheric conditions where the vertical ionisation profile can show significant departures from the average.
In an attempt to overcome these limitations, Kersley
et al. (1993) incorporated ionosonde information, in the
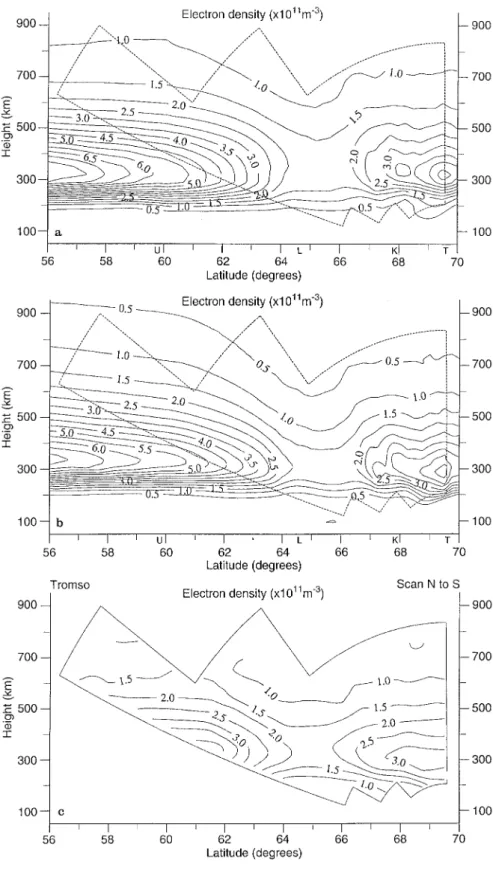
form of maximum electron density and layer peak height, to scale the ionospheric model used to initialise the MART algorithm. A range of topside profiles with peak heights and densities consistent with the ionosonde measurements was created by artificially altering the f 10·7 parameter input to the IRI-90 model. A later development of this approach was reported by Heaton et al. (1995), where the topside shape was no longer model dependent but was selected from a range of possible shapes provided from a large data base of normalised topside profiles, compiled using data from the EISCAT and Malvern inco-herent scatter radars. Once again the MART algorithm was used to generate the reconstuction. The success of this technique is illustrated in Fig. 3, which shows two at-tempts at the imaging of the main trough seen in observa-tions from a satellite pass monitored by the chain of receivers at 1818 UT on 23 March 1992, with the relevant EISCAT observations included for comparison. It should be noted that the start and end times for monitoring of a given satellite pass differ at each receiving site, depen-dent upon the position in the receiving chain. For the purposes of this paper, the time used to identify a satellite
pass is that at which the satellite crossed 65°N, approxim-ately the midpoint of the receiving chain. The image shown in Fig. 3a was produced using the IRI-90 model with ionosonde input for the initial background. Figure 3b shows an image formed using the technique described by Heaton et al. (1995), while Fig. 3c displays the corresponding density measurements made using the UK EISCAT Special Program TOMO. It should be noted that the first image in this example was discussed in detail by Kersley et al. (1993), where attention was drawn to the need to calibrate correctly the TEC measurements made at each receiving site. However, the example has been included again here to illustrate the improvements made in the intervening years to the reconstruction technique.
Comparing a and c in Fig. 3, it can be seen that the first attempt at incorporating ionosonde information with the IRI-90 model gave a reconstruction which correctly re-produced a trough above 65°N; however, it overestimated the densities at the layer peak and on the topside. In the case of Fig. 3b, where ionosonde information and the free range of normalised topside profiles have been used to provide the background, the position of the trough is again accurately reproduced; but now the shape of the topside is much improved when compared to the EISCAT observations (Fig. 3c). However, it can be noted that the vertical gradient on the bottomside in the image is still too sharp, so that the densities at the peak are still overes-timated. The TOMO scan provides power-profile in-formation in addition to the observations plotted in Fig. 3c which can be used to give an indication of relative densities down to about 100 km. These show the presence of significant ionisation in the E-region that may explain the overestimation of peak densities in the reconstruction, since no account of an E-layer was taken in the initialisa-tion of the background.
In a parallel development, attempts have been made to generate images without the use of additional ionosonde data. Under certain circumstances, for example blanket-ing auroral-E, ionosondes are unable to provide max-imum densities and peak heights to scale the ionospheric models. The most successful approach to date involves a three-stage process, which differs significantly from the previous approaches described earlier, where a single-background ionosphere was used to initialise the MART algorithm. In the first stage, a range of possible back-ground ionospheres is generated by inserting Chapman profiles, scaled using the IRI-90 model, across the image grid. This process is repeated for profiles with a range of peak heights and bottomside scale heights to create a large set of possible background ionospheres. For the second stage, a variation of the Algebraic Reconstruction Technique (ART) routine, with weighting along the ray paths, is used to generate a reconstruction for each of the background ionospheres that have been created. By means of a least-squares test on the resultant reconstruc-tions, comparing the relative TEC measurements made at the receiving stations with those found for the same paths through the reconstructed images, it is possible to identify initial best estimates of peak height and peak density for the image. In the third stage of the process, the image is
Fig. 3. a Tomographic image of electron density for a satellite pass at 1818 UT on 23 March 1992 with background ionosphere based on IRI-90 model with ionosonde input (after Kersley et al., 1993); b tomographic image of electron density for the same pass; background ionosphere based on IRI-90 model incorporating ionosonde input, with topside shape selected from a large data base of normalised topside profiles provided by the Malvern and EISCAT incoherent scatter radars; c electron densities measured by EISCAT using SP-UK-TOMO between 1810 and 1829 UT on 23 March 1992
fine tuned by making further reconstructions based on backgrounds created using these best estimates of peak height and density in conjunction with the varying topside profiles described by Heaton et al. (1995) and standard Chapman bottomside profiles. Much smaller variations in the peak height and peak densities are tolerated in this final stage of the process.
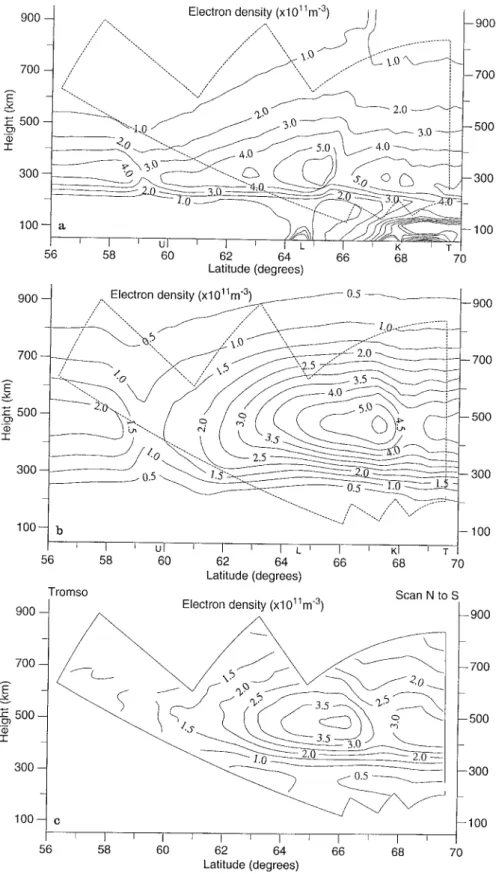
An illustration of the success of this approach can be seen by comparing Fig. 4a, a reconstruction made using only the USU model to initialise the background for the reconstruction, with Fig. 4b, the image produced using the new technique. Figure 4c shows the relevant EISCAT observations made using SP-UK-TOMO. In this example, an unusually high peak height at around 475 km
Fig. 4. a Tomographic image of electron density for a satellite pass at 2058 UT on 23 March 1992 with background iono-sphere based on the USU model (taken from Kersley et al., 1993); b tomographic image of electron density for the same pass with background ionosphere based on latest technique which requires no addi-tional a priori information (see text); c electron densities measured by EISCAT using SP-UK-TOMO between 2050 and 2109 UT on 23 March 1992
was observed by EISCAT. Figure 4a shows that the initial attempt at reconstruction using only the USU model completely failed to reproduce the correct peak height. There appears to be a broad match in the tomographic image and EISCAT plot between the locations of the trough to the south and the density enhancements further north. However, the peak densities yielded by the
recon-struction are significantly higher than those seen using EISCAT. In contrast, the image produced by the new method shown in Fig. 4b has accurately replicated the height of the F-layer peak. This represents a significant step forward in the development of ionospheric to-mographic reconstruction techniques, without recourse to additional data sources for use in the reconstruction. The
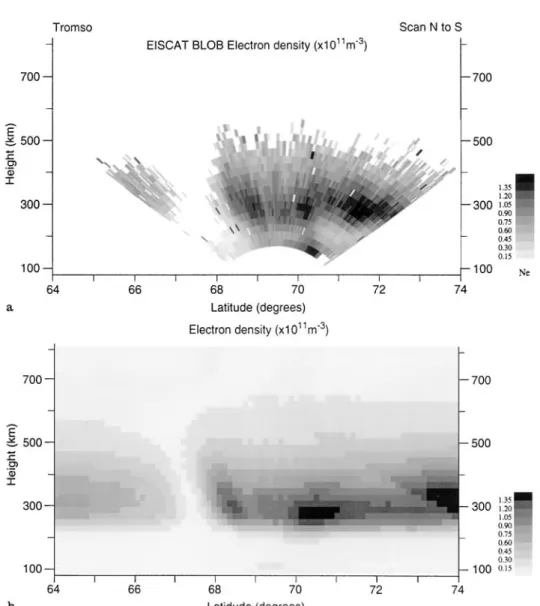
Fig. 5. a Electron-density measure-ments made by EISCAT during a scan of SP-UK-BLOB between 2102 and 2128 UT on 15 October 1993; b tomographic image of elec-tron density for a satellite pass at 2136 UT on 15 October 1993. (after colour plots presented by Mitchell et al., 1995)
locations of the main features in the horizontal structure of the image match reasonably well with the EISCAT obser-vations, but there are still discrepancies between the magni-tudes of the densities, with the reconstructed image again showing higher densities than those observed by EISCAT. Here again the power-profile data showed the presence of significant ionisation in the E-region which had not been taken into account with the initialisation of the background. This may well account for the observed discrepancies.
A second UK EISCAT Special Program (SP-UK-BLOB) has also been used in the verification of tomo-graphic images. The primary aim of this routine is the study of density structures in the auroral F region with transverse scales of the order of tens of kilometres. Full details of BLOB can be found in Pryse et al. (1996). Figure 5a shows the electron-density measurements made by EISCAT during a scan of the BLOB program between 2102 and 2128 UT on 15 October 1993. These data are taken from a 7-h run of the experiment during very quiet geomagnetic conditions, where Kp was about 0#. A trough can be seen at the southern end of the scan. The densities in the trough minimum are so low that the
signal-to-noise ratio measured by the radar was below the threshold for reliable analysis. A steep gradient in electron density forms the poleward wall of the trough, where a region of density enhancement is elongated along the direction of the geomagnetic field. To the north, additional structuring is apparent, with indications of structure at a lower peak height around 70°N and some evidence of auroral-E above this latitude.
The tomographic image from a satellite pass about the time of these observations is shown in Fig. 5b, the satellite crossing 65°N at approximately 2136 UT. Excellent agree-ment can be seen between the image and EISCAT obser-vations, particularly at the poleward wall of the trough with the field-aligned enhancement in density. Further-more, there is also indication of structure at a lower peak height around 70°N. The densities in the trough minimum are determined by the tomographic method, showing clearly the narrow field-aligned structure of the trough in this instance. This probably represents the best experi-mental tomographic reconstruction to date. The pixel size used (approximately 15]20 km at F-region altitudes) is comparable to that of the radar observations and
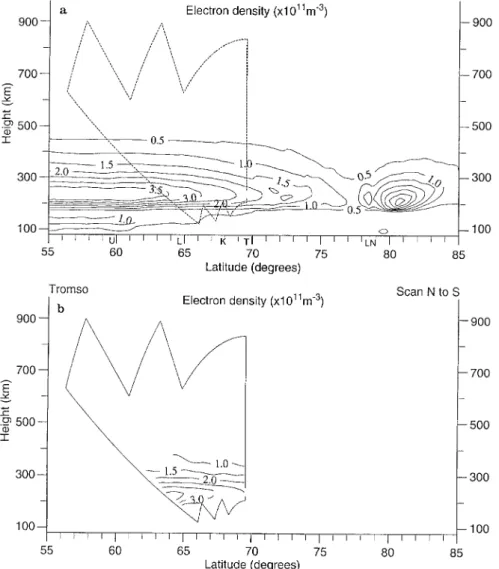
Fig. 6. a Tomographic image of electron density for a satellite pass at 1122 UT on 23 November 1995; b electron densities meas-ured by EISCAT using SP-FI-TOMO be-tween 1116 and 1134 UT on the 23 Novem-ber 1995
is approaching the diffraction limit imposed by phase scintillation that controls the ultimate resolution of the method. Mitchell et al. (1995) have presented power-pro-file data from the radar for this time that give relative electron densities at lower altitudes. These confirm the pres-ence of an auroral-E layer beneath structured enhancements poleward of the trough. By reducing the data separation interval and thereby increasing the number of ray paths in the image grid, these authors were able to begin to form the increased densities to the E-layer in the reconstruction. In an experimental project in November 1995, all six receiving stations marked on the map shown in Fig. 2 were used. This represented the first attempt at imaging the ionosphere over a region extending from mid-latitudes above mainland Scandinavia to polar latitudes over Sval-bard. Figure 6a shows a reconstruction generated using measurements made at all of the sites and covering some 30° of latitude. For comparison, the relevant EISCAT data obtained from a run of the Russian/Finnish Special Program TOMO are shown in Fig. 6b. It can be noted that this special program is a derivative from the UK TOMO program, with scanning taking place in the geomagnetic meridian rather than the geographic plane.
The method employed to generate the reconstruction in-cludes the use of a complete bottomside profile from the Tromsø dynasonde to scale the IRI-90 model that is used to form the background for initialisation of the recon-struction algorithm.
The main features that can be seen in the reconstructed image from a satellite pass at about 1120 UT are the trough-like depletion just above 77°N, with evidence of density structuring polewards of this region and a relative-ly smooth increase in density to the south. Comparison in the viewing area of EISCAT shows that the equatorward gradient has been well replicated in the tomographic im-age, with both the peak height and densities exhibiting good agreement. This agreement, found over a segment of the image, places confidence in the authenticity of the electron densities revealed by the tomographic method over the wider region. Of particular interest in the recon-structed image are the features seen above the receivers on Svalbard (Longyearbyen 78·2°N, Ny As lesund 78·9°N). It is well established that density structuring at high lati-tudes is dominated by the convection flow driven by the solar wind. For observations made at receiving sites on Svalbard, the ionospheric satellite-to-receiver ray-path
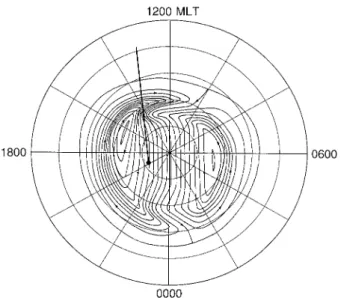
Fig. 7. Geometry of the ray-path intersection at a height of 300 km for the satellite pass at 1122 UT on 23 November 1995 on a geomag-netic latitude (90° to 40°) versus MLT grid. The Heppner and Maynard Model A two-cell convection pattern for B; and B: nega-tive has been superimposed
intersection can encounter markedly different regions in the convection pattern at different times during the pass. Figure 7 shows the relevant ionospheric intersection track for the observations presented as a function of magnetic local time and magnetic latitude. Superimposed on the plot is a schematic representation of a simple two-cell convection pattern for Bz negative taken from Heppner and Maynard (1987). The satellite was moving from high-er to lowhigh-er latitudes, and it can be seen that initially the track might have encountered plasma moving in the anti-sunward flow across the polar cap and then could have gone on to pass through the throat region for this flow. As the satellite moved further south, the track would intersect plasma corotating in winter darkness at high latitudes and finally the sunlit near-noon ionosphere at mid-latitudes. With this in mind, the structures can be interpreted. The enhancement seen above 81°N geographic in the to-mographic image is likely to be a section elongated in the convective flow through a so-called ‘patch’, starting its journey across the polar cap. Similarly, the smaller en-hancement seen above 78·5°N, and possibly field-aligned, is a transverse section in the postmagnetic noon region of the tongue of ionisation, shown by models to feed into the polar cap. It can also be noted that this enhancement might be linked to particle precipitation in the cusp re-gion. Indeed, the reconstruction has formed a small region of E-layer ionisation near 79°N that may be further evid-ence of particle precipitation in this region.
The trough, with minimum between 77°N and 78°N, occurs on flux tubes that have long been in winter dark-ness, either in the return flow of the afternoon cell or co-rotating at high latitude. To the south there is the latitudinal gradient of the sunlit daytime ionosphere. It can be noted that some of the apparent structure at the northern edge of this gradient arises from artefacts in the reconstructed image. It is well understood that spurious
features or ‘wings’ can be produced in an image in regions where ray-path coverage is lost from individual stations. The wide gap between the stations on Svalbard and at Tromsø results in such features that can be seen as an artificial elongation of the 1]1011 el m~3 contour be-tween 75°N and 77°N. This effect is also apparent in the elongation of the northern edge of the ‘patch’ feature at latitudes greater than 81°N. However, in spite of these limitations the reconstruction presented in Fig. 6a demon-strates the potential of the tomographic method for the imaging of large sections of ionospheric electron density.
5 Conclusions
The EISCAT radar has played an important role in the development of the application of tomographic recon-struction techniques to the imaging of the ionospheric electron density. The radar has provided independent measurements of the electron concentration that have been used to assess the performance of various algorithms developed for the inversion of the experimental observa-tions of TEC. Without such independent verification the development of ionospheric tomography is restricted to consideration of modelling studies that are often less than realistic representations of the actual situation encoun-tered in experimental applications. The experimental re-sults given here illustrate some of the progress made in ionospheric tomography using EISCAT comparisons. It can be noted that comparisons have been published relat-ing tomographic images to observations made usrelat-ing the Millstone Hill radar (Foster et al., 1994; Pakula et al., 1995). Recently, Markkanen et al. (1995) have reported a new approach to tomographic inversion in which obser-vations by the EISCAT radar are not used for verification but form an input to the reconstruction process itself. The results presented, particularly those at high latitudes, demonstrate the potential of the tomography method to provide information on ionospheric electron densities over wide spatial regions from observations at a few ground-based locations.
Acknowledgements. This work has been supported by the UK Par-ticle-Physics and Astronomy Research Council. The assistance of the director and staff of the EISCAT Scientific Association, the staff of the Norsk Polarinstitutt at Ny As lesund and the director and staff of the Swedish Institute of Space Physics is gratefully acknowledged. In addition the authors would like to thank Professor Evgeny Tereshchenko of the Polar Geophysical Institute in Mumansk, Rus-sia and Dr Tuomo Nygre´n of the University of Oulu, Finland for provision of data from EISCAT special program time during the November 1995 campaign.
Topical Editor D. Alcayde´ thanks E. J. Fremouw and another referee for their help in evaluating this paper.
References
Austen, J. R., S. J. Franke, and C. H. Liu, Application of com-puterized tomography techniques to ionospheric research, in Radio Beacon Contributions to the Study of Ionization and Dy-namics of the Ionosphere and to Corrections to Geodesy and ¹echnical ¼orkshop, ed. A. Tauriainen, Ouluensis Universitas, Oulu, Finland, Beacon Satellite Symposium, 1986.
Bilitza, D., International Reference Ionosphere 1990, National Space Science Data Center/World Data Center A for Rockets and Satellites 90-22, 1990.
Daniell, R. E., Parameterized Real-¹ime Ionospheric Specification Model: PRISM »ersion 1.0, Phillips Laboratory Technical Re-port, PL-TR-91-2299, Hanscom AFB, MA 01731, USA, 1991. Foster, J. C., M. J. Buonsanto, J. M. Holt, J. A. Klobuchar, P.
Fougere, W. Pakula, T. D. Raymund, V. E. Kunitsyn, E. S. Andreeva, E. D. Tereshchenko, and B. Z. Khudukon, Russian-American Tomography Experiment, Int. J. Image Syst. ¹echnol., 5, 148—159, 1994.
Heaton, J. A. T., S. E. Pryse, and L. Kersley, Improved background representation, ionosonde input and independent verification in experimental ionospheric tomography, Ann. Geophysicae, 13, 1297—1302, 1995.
Heppner, J. P., and N. C. Maynard, Empirical High-Latitude Elec-tric Field Models, J. Geophys. Res., 89, 44467—4489, 1987. Kersley, L., J. A. T. Heaton, S. E. Pryse, and T. D. Raymund,
Experimental ionospheric tomography with ionosonde input and EISCAT verification, Ann. Geophysicae, 11, 1064—1074, 1993.
Markkanen, M., M. Lehtinen, T. Nygre´n, J. Pirttila¨, P. Henelius, E. Vilenius, E. D. Tereshchenko, and B. Z. Khudukon, Bayesian approach to satellite radiotomography with applications in the Scandinavian sector, Ann. Geophysicae, 13, 1277—1287, 1995. Mitchell, C. N., D. G. Jones, L. Kersley, S. E. Pryse, and I. K.
Walker, Imaging of field-aligned structures in the auroral iono-sphere, Ann. Geophysicae, 13, 1311—1319, 1995.
Pakula, W. A., P. F. Fougere, J. A. Klobuchar, H. J. Kuenzler, M. J. Buonsanto, J. M. Roth, J. C. Foster, and R. E. Sheehan, To-mographic reconstruction of the ionosphere over North America with comparisons to ground-based radar, Radio Sci., 30, 89—103, 1995.
Pryse, S. E., and L. Kersley, A preliminary experimental test of ionospheric tomography, J. Atmos. ¹err. Phys., 54, 1007—1012, 1992.
Pryse, S. E., L. Kersley, and I. K. Walker, Blobs and irregularities in the auroral ionosphere, J. Atmos. ¹err. Phys., 58, 205—215, 1996. Raymund, T. D., S. E. Pryse, L. Kersley, and J. A. T. Heaton, Tomographic reconstruction of ionospheric electron density with European incoherent scatter radar verification, Radio Sci., 28, 811—817, 1993.
.