HAL Id: hal-00298102
https://hal.archives-ouvertes.fr/hal-00298102
Submitted on 29 Feb 2008
HAL is a multi-disciplinary open access
archive for the deposit and dissemination of
sci-entific research documents, whether they are
pub-lished or not. The documents may come from
teaching and research institutions in France or
abroad, or from public or private research centers.
L’archive ouverte pluridisciplinaire HAL, est
destinée au dépôt et à la diffusion de documents
scientifiques de niveau recherche, publiés ou non,
émanant des établissements d’enseignement et de
recherche français ou étrangers, des laboratoires
publics ou privés.
response to the 8.2 kyr event
K. Ljung, Siwan Björck, H. Renssen, D. Hammarlund
To cite this version:
K. Ljung, Siwan Björck, H. Renssen, D. Hammarlund. South Atlantic island record reveals a South
Atlantic response to the 8.2 kyr event. Climate of the Past, European Geosciences Union (EGU),
2008, 4 (1), pp.35-45. �hal-00298102�
© Author(s) 2008. This work is distributed under the Creative Commons Attribution 3.0 License.
of the Past
South Atlantic island record reveals a South Atlantic response to the
8.2 kyr event
K. Ljung1, S. Bj¨orck1, H. Renssen2, and D. Hammarlund1
1Geobiosphere Science Centre, Department of Geology, Quaternary Sciences, Lund University, S¨olvegatan 12, 223 62 Lund,
Sweden
2Faculty of Earth and Life Sciences, Vrije Universiteit Amsterdam, De Boelelaan 1085, 1081 HV Amsterdam, The
Netherlands
Received: 24 April 2007 – Published in Clim. Past Discuss.: 10 May 2007
Revised: 10 December 2007 – Accepted: 21 February 2008 – Published: 29 February 2008
Abstract. One of the most distinct climate fluctuations
dur-ing the Holocene is the short and rapid event centred around 8200 years ago, the 8.2 kyr event, which was most likely triggered by glacial melt-water forcing from the receding Laurentide ice-sheet. Evidence for this cooling has primar-ily been reported from sites around the North Atlantic, but an increasing number of observations imply a more wide-spread occurrence. Palaeoclimate archives from the Southern Hemisphere have hitherto failed to uncover a distinct climatic anomaly associated with the 8.2 kyr event. Here we present a lake sediment record from Nightingale Island in the cen-tral South Atlantic showing enhanced precipitation between 8275 and 8025 cal. yrs BP, most likely as a consequence of increased sea surface temperature (SST). We show that this is consistent with climate model projections of a warming of the South Atlantic in response to reduced north-ward energy transport during the 8.2 kyr event.
1 Introduction
The cooling associated with the 8.2 kyr event (Alley et al., 1997) is commonly attributed to a weakening of the North Atlantic Deep Water (NADW) formation by rapid discharge of melt-water from ice-dammed lakes to the North Atlantic Ocean from the margin of the Laurentide Ice Sheet (Barber et al., 1999). Evidence for this cooling has primarily been reported from sites around the North Atlantic, but an increas-ing number of observations imply a more wide-spread occur-rence (Alley and ´Ag´ustsd´ottir, 2005; Wiersma and Renssen,
Correspondence to: K. Ljung
2006; Rohling and P¨alike, 2005). Coupled atmosphere-ocean model results (Renssen et al., 2001, 2002; Bauer et al., 2004; LeGrande et al., 2006) indicate that such fresh-ening of the North Atlantic caused a significant decrease in the north-ward heat transport, leading to heat retention and associated increases in SST and precipitation in the South Atlantic in response to the weakened thermohaline circula-tion (THC). Therefore this is a key region for investigat-ing the climatic signature and extent of the 8.2 kyr event, for testing the climate models, and for exploring a potential Holocene anti-phase behavior of north and south (Crowley, 1992; Stocker et al., 1992), equivalent to the so-called bipo-lar seesaw effect of the last glacial (Broecker, 1998; Stocker, 1998). Although a relationship between seesawing and ice-rafting (IRD episodes) in the North Atlantic has been hy-pothesized, no records with a clear anti-phase response to the 8.2 kyr event, or other IRD episodes, have been found (Mor-rill and Jacobsen, 2005; Broecker, 1998). Marine records from the South Atlantic (Piotrowski et al., 2004) and Tropi-cal Atlantic (Arz et al., 2001) imply a weakening of NADW formation around 8000 cal. yrs BP, without a seesaw effect, while other South Atlantic records show no changes during this time (Nielsen et al., 2004).
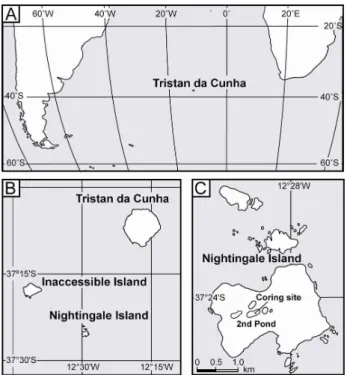
The Tristan da Cunha island group is located at 37◦S in the central South Atlantic (Fig. 1a and b), in the path of the westerlies at the northern limit of the West Wind Drift (H¨oflich, 1984), and has a climate sensitive to atmospheric and oceanographic changes. Mean annual temperature is 14◦C and annual precipitation close to sea level at The Set-tlement is ca. 1500 mm (H¨oflich, 1984), while values three times higher have been indicated for the more elevated parts of the island. Abundant peat and lake deposits on the is-lands provide targets for studies of past hydrological changes (Ljung et al., 2006).
Fig. 1. (A) The position of the Tristan da Cunha island group in
the South Atlantic. (B) The three main islands of the group. (C) Nightingale Island and the position of the coring site, 2nd Pond.
We retrieved a 9.6 m long sediment sequence from the central part of an overgrown lake on the small (3.2 km2) Nightingale Island (Fig. 1c, Fig. 2). This fen, situated at ca. 180 m above sea level, is called 2nd Pond and has a size of ca. 1 ha. It is a distinct basin with no in- or out-lets. Scirpus sp. and Sphagnum sp. dominate the fen vegeta-tion, while thick tussock-grass dominated by Spartina
arun-dinaceae and Poa flabellata cover most of the island. Trees (Phylica arborea), tree ferns (Blechnum palmiforme) and
as-sociated shade-tolerant species (Nertera sp., Polypodiaceae) are restricted to slopes and higher areas.
Here we present a palaeoclimatic reconstruction based on a multi-proxy study, including magnetic susceptibility, pollen analysis, and determination of total carbon (TC), ni-trogen (TN) and sulphur (TS) content, of the lower part of this sequence, which covers the time period 10 700 to 7000 cal. yrs BP (Figs. 2 and 3). The emphasis is on the time around the 8.2 kyr event and any coupling between the South and North Atlantic. We compare our results with a simulation of the 8.2 kyr BP event performed with a coupled atmosphere-ocean climate model.
2 Methods
2.1 Coring, lithological descriptions and correlations The sediment sequence was recovered with a 5 cm Russian chamber corer. All cores were visually described in the field and in detail in the laboratory. Special attention was paid to any signs of potential volcanic ash layers (tephras). Corre-lations between overlapping cores were carried out visually and with the aid of magnetic susceptibility measurements. 2.2 Radiocarbon dating
The chronology is based on 14C measurements performed at the Compact Carbon AMS laboratory in Poznan, Poland, and the Single Stage AMS laboratory in Lund, Sweden. The measurements were obtained on macroscopic plant remains and bulk sediment samples. Radiocarbon ages were con-verted to calibrated ages using the program OxCal v3.10 (Bronk Ramsey, 2001, 1995) and the SHCal04 calibration data-set (McCormac et al., 2004). The age model was con-structed by visual line-fitting through the calibrated radiocar-bon dates, and adjusting sedimentation rate changes accord-ing to the lithology and lithological changes displayed in the sequence.
2.3 Total carbon, nitrogen and sulphur measurements Total carbon, nitrogen and sulphur content data were ob-tained on dried and homogenized samples using a Costech Instruments ECS 4010 elemental analyzer. Measurement ac-curacy is better than ±5% of the reported values based on replicated standard samples. C/N atomic ratios were ob-tained by multiplying by 1.67 (Bengtsson and Enell, 1986).
If no inorganic carbon, i.e carbonates, are present, TC and TN contents are directly related to organic matter content, and the C/N ratio can be used to asses relative changes in ter-restrial versus aquatic organic matter in the sediments (Mey-ers and Teranes, 2001).
2.4 Magnetic susceptibility measurements
Magnetic susceptibility was measured at 4 mm increments using a Bartington Instruments MS2EI magnetic suscepti-bility high-resolution surface scanning sensor coupled to a TAMISCAN automatic logging conveyor. In a volcanic envi-ronment like this, magnetic susceptibility reflects the minero-genic content of the sediments and provides a proxy for in-wash from the catchment (Thompson and Oldfield, 1986). 2.5 Pollen analysis
Pollen samples of ca. 1 cm3were processed following stan-dard method A (Berglund and Ralska-Jasiewiczowa, 1986), with added Lycopodium spores. The counting was made un-der a light microscope at magnifications of ×400 and ×1000.
Fig. 2. Graph of lithology and susceptibility of the full 2nd Pond sediment sequence (to the left), with lithology, radiocarbon dates and
magnetic susceptibility of the lowermost 2.68 m to the right. The assumed age-depth relationship is shown by the line through most of the dates and horizontal error bars denote the double standard deviation. Calendar ages are related to AD 1950.
Pollen grains were identified by the help of published photos (Hafsten, 1960), standard pollen keys (Moore et al., 1991), and a small collection of type slides prepared by U. Hafsten and borrowed from the Botanical Museum in Bergen, Nor-way. The zonation of the pollen diagram is based on the variation of the major taxa and follows the result from the principal component analysis.
2.6 Principal component analysis
Principal component analysis (PCA) was performed in MAT-LAB using the function princomp. Undetermined pollen grains were excluded from the analysis. The percentage data were normalized and standardized prior to analysis. PCA was used to extract the major variation from the pollen fre-quency dataset.
2.7 Climate model and experimental design
We performed the simulation of the 8.2 kyr event with version 2 of the ECBilt-CLIO coupled atmosphere-ocean model. The atmospheric component is ECBilt, an atmo-spheric model (T21 horizontal resolution, three layers) based
on quasi-geostrophic equations (Opsteegh et al., 1998). As an extension to the quasi-geostrophic equations, an estimate of the neglected terms in the vorticity and thermodynamic equations is included as a temporally and spatially varying forcing. This forcing is calculated from the diagnostically derived vertical motion field and leads to a considerable im-provement of the simulation of the Hadley Cell circulation, resulting in a better representation of the strength and posi-tion of the jet stream and transient eddy activity. ECBilt re-solves synoptic variability associated with weather patterns. ECBilt is coupled to CLIO, an oceanic general circulation model (3◦×3◦ latitude-longitude horizontal resolution, 19 layers in the vertical) coupled to a comprehensive dynamic-thermodynamic sea-ice model (Goosse and Fichefet, 1999). The ECBilt-CLIO model reproduces the modern climate (Goosse et al., 2001; Renssen et al., 2002) reasonably well.
The simulation experiment on the 8.2 kyr event was de-signed as follows. First, starting from a modern quasi-equilibrium state, the model was run for 550 years with forcings for 8.5 kyr BP to obtain an early Holocene cli-mate state (Renssen et al., 2002). These forcings are orbital parameters (Berger, 1978), greenhouse gas concentrations
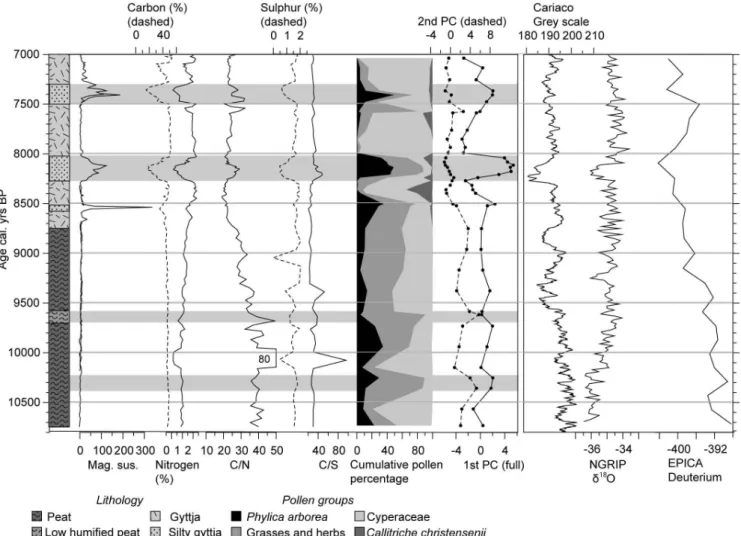
Fig. 3. Graph showing the magnetic susceptibility, content of total carbon (TC) (dashed), total nitrogen (TN), total sulphur content (TS)
(dashed), TC/TN ratios, TC/TS ratios, cumulative pollen percentages of Phylica arborea, grasses and herbs, sedges, and Callitriche
chris-tensenii, and the values of the first two PCA axes of the pollen dataset accounting for 42% of the total variance. All data are related to the age
model shown in Fig. 2. The 8.2 kyr event and the other events discussed in the text are shown by grey shading. In addition to the 2nd Pond data, the updated grayscale record from the Cariaco Basin (Haug et al., 2001), the δ18O record from the NGRIP ice core (Rasmussen et al., 2006), and the deuterium record, averaged over 3.85 m-sections, from the EPICA ice core (Epica Community Members, 2004) are shown. The latter three have independent chronologies based on varve years and ice years BP.
(Raynaud et al., 2000), modified surface albedo in northern Africa to account for a “green” Sahara (Adams and Faur´e, 1997), and modified surface albedo and surface elevation in North America to represent the remnant Laurentide ice-heet (Peltier, 1994). At the end of the 550 years, the trend in the global ocean temperature was only −0.007◦C/century.
Second, this 8.5 kyr BP early Holocene quasi-equilibrium state was perturbed by releasing a freshwater pulse in the Labrador Sea that represents the catastrophic drainage from Lakes Agassiz and Ojibway and the collapse of the Lauren-tide ice-sheet dome over Hudson Bay. Different freshwater volumes and release rates were tested (Renssen et al., 2002). After the introduction of the freshwater perturbations, the ex-periments were continued for at least 500 years. Here we present results from one particular experiment that produced
a climate anomaly that was closest to what is suggested by proxy data on the 8.2 kyr event, both in terms of magnitude and duration (Renssen et al., 2002; Wiersma and Renssen, 2006). In this experiment, we released a constant freshwa-ter flux of 0.75 Sv (1 Sv=1×10⁶m3/s) in the Labrador Sea during 20 years, implying a total volume of 4.67×10¹⁴m3. This freshwater volume is close to the highest estimate for the 8.2 kyr event based on geological data (Von Grafenstein et al., 1999).
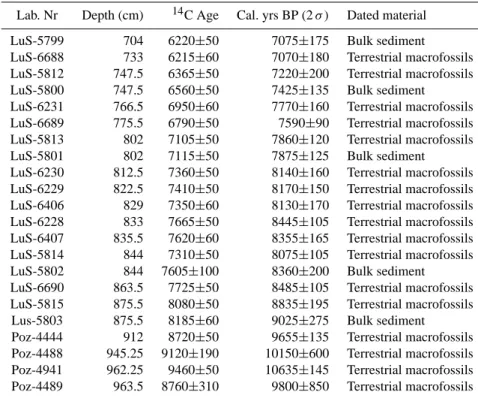
Table 1. Radiocarbon dates from the 2nd Pond sequence between 9.635 and 7.04 m below the fen surface.
Lab. Nr Depth (cm) 14C Age Cal. yrs BP (2 σ ) Dated material
LuS-5799 704 6220±50 7075±175 Bulk sediment
LuS-6688 733 6215±60 7070±180 Terrestrial macrofossils LuS-5812 747.5 6365±50 7220±200 Terrestrial macrofossils LuS-5800 747.5 6560±50 7425±135 Bulk sediment LuS-6231 766.5 6950±60 7770±160 Terrestrial macrofossils LuS-6689 775.5 6790±50 7590±90 Terrestrial macrofossils LuS-5813 802 7105±50 7860±120 Terrestrial macrofossils
LuS-5801 802 7115±50 7875±125 Bulk sediment
LuS-6230 812.5 7360±50 8140±160 Terrestrial macrofossils LuS-6229 822.5 7410±50 8170±150 Terrestrial macrofossils LuS-6406 829 7350±60 8130±170 Terrestrial macrofossils LuS-6228 833 7665±50 8445±105 Terrestrial macrofossils LuS-6407 835.5 7620±60 8355±165 Terrestrial macrofossils LuS-5814 844 7310±50 8075±105 Terrestrial macrofossils
LuS-5802 844 7605±100 8360±200 Bulk sediment
LuS-6690 863.5 7725±50 8485±105 Terrestrial macrofossils LuS-5815 875.5 8080±50 8835±195 Terrestrial macrofossils Lus-5803 875.5 8185±60 9025±275 Bulk sediment Poz-4444 912 8720±50 9655±135 Terrestrial macrofossils Poz-4488 945.25 9120±190 10150±600 Terrestrial macrofossils Poz-4941 962.25 9460±50 10635±145 Terrestrial macrofossils Poz-4489 963.5 8760±310 9800±850 Terrestrial macrofossils
3 Results
3.1 Chronology and climate reconstruction
The depth-age relationship of the lowermost 2.5 m was deter-mined by 2214C measurements (Fig. 2, Table 1). The results from this part of the sequence, covering the time period from 10 750 to 7000 cal. yrs BP, are presented in Figs. 2 and 3. The temporal resolution of the magnetic susceptibility data is ca. 10 years, equivalent to the geochemical data for the period 8300–7500 cal. yrs BP. The rest of the geochemical record has a resolution of ca. 20 years, although the pollen record is of lower resolution (30–60 years at 8600–7400 cal. yrs BP and 70–150 years in the oldest part of the sequence).
When constructing the age depth model, breaks in sed-imentation rate were assumed to take place at lithological changes, and erroneous ages were considered more likely to be too old than the opposite. Generally bulk sediment samples yielded slightly older ages than macrofossil sam-ples, which indicate that the bulk sediment contains some reworked organic material. We estimate that the uncertainty envelope of the age model is at least ±25 years.
The lower part of the sediment sequence consists of fen peat with a variable degree of humification (Fig. 2). The peat is overlain by lacustrine sediments (gyttja) with a low minerogenic content, and this gradual transition at 8.7–8.6 m is dated to 8800–8600 cal. yrs BP. The highly organic gyttja is interrupted by distinct units of silty gyttja at 8.33–8.09 m
and at 7.65–7.55 m. In this volcanic bedrock region the minerogenic content of the sediments is mirrored by the mag-netic susceptibility values, and closely follows the lithologi-cal changes. In the lowermost peat (9.7–8.7 m) the magnetic susceptibility is very low and remains low after the transi-tion to gyttja. The exceptransi-tion is a temporary susceptibility in-crease at ca. 8550 cal. yrs BP (Fig. 3), which is likely related to in-wash processes connected to the fen-to-lake transition. Within the two silty gyttja units at 8.33–8.09 m and 7.65– 7.55 m (Fig. 3), magnetic susceptibility increases markedly. The lower of these units was dated to 8275–8025 cal. yrs BP, making it synchronous with the Northern Hemisphere 8.2 kyr event (Alley et al., 1997). The radiocarbon dates from this unit imply that the sedimentation rate increased, probably as a result of increased deposition of minerogenic and terres-trial organic matter. The upper silty gyttja unit is dated to 7500–7300 cal. yrs BP (Fig. 3).
Total carbon content of the peat and the overlying gyt-tja ranges from 40 to 45%, which corresponds to at least 80–90% organic matter due to absence of inorganic carbon (Fig. 3). During the increase in minerogenic matter at 8275– 8025 cal. yrs BP, total carbon content drops to 16%, and at 7500–7300 cal. yrs BP a minimum of 15% is reached. TC/TN ratios of the fen peat generally exceed 40 with a max-imum above 80, which indicates dominance of terrestrial or-ganic matter (Meyers, 2003). TC/TN ratios in the range of 20–30 characterize the lacustrine part of the sequence, with higher values at 8275–8025 and 7500–7300 cal. yrs BP.
Fig. 4. Graph showing pollen and spore percentage frequencies. Pollen frequencies were calculated in relation to the sum of all pollen types,
while Pteridophyte spore frequencies were based on a combined pollen and spore sum. The pollen zonation is based on the major variation in the full pollen percentage dataset which is clearly expressed in the 1st and 2nd PCA axes. The zonation concurs with major lithological changes shown to the left.
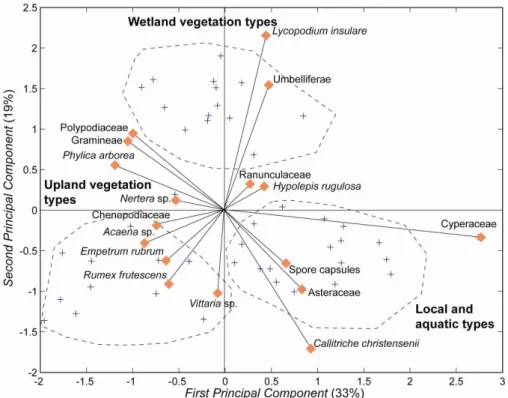
The pollen data show large variations which generally fol-low the lithological changes and variations in the other prox-ies (Fig. 4). The first two PCA axes explain 33% and 19%, respectively of the total variance of the pollen record (Fig. 5). The 1st axis values are primarily determined by Cyperaceae, having the highest scores, and Phylica arborea, Acaena sp., Polypodiaceae, Empetrum rubrum, Gramineae, Chenopodi-aceae and Rumex frutescens, which have the lowest (nega-tive) scores. The 2nd axis values are primarily driven by the high positive scores of Lycopodium insulare and the low neg-ative scores of Callitriche christensenii. These two PCA axes divide the pollen assemblage into different habitat groups: the 1st axis separates local littoral vegetation (Cyperaceae and Callitriche christensenii), dominating pollen zones 2, 4 and 6, from more distal catchment taxa (Phylica arborea,
Empetrum rubrum, Acaena sp., Rumex frutescens and
Poly-podiaceae), dominating pollen zones 3 and 5, whilst the 2nd axis separates the typical wetland species Lycopodium
insu-lare, present in pollen zone 1, from the aquatic species Cal-litriche christensenii, present in pollen zones 2–6. The 1st
axis sample scores are closely correlated with TC content (r=0.8, P <0.001), TN content (r=0.6, P <0.001) and mag-netic susceptibility (r=0.8, p<0.001).
3.2 Model results
In our experiment of the 8.2 kyr event, the THC is signif-icantly weakened by the freshwater perturbation (Renssen et al., 2001, 2002). In the South Atlantic Ocean at 20◦S,
the NADW export is reduced by 3 Sv from 13 Sv to 10 Sv during the perturbation, and the northward heat transport de-creases by 46% from 0.28 to 0.15 PW (1 PW=1×10¹⁵W). In the North Atlantic region this leads to strong surface cooling (locally by more than 10◦C), which is partly due to positive feedbacks (i.e. ice-albedo and ice-insulation feedbacks) re-lated to the sea-ice expansion. The Arctic sea-ice volume
Fig. 5. Biplot of PCA variables (red diamonds), and sample scores (blue crosses). Note that the scores are scaled. Dashed lines indicate
the three major sample score groupings. The variable scores show that, the upper central group is influenced by Lycopodium insulare and Umbeliferae, which represent the wetland vegetation assemblages. The two other groups represent the period of gyttja deposition and separate between deposition of pollen from the local vegetation, samples in the lower right corner mainly influenced by Cyperaceae and
Callitriche christensenii, and deposition of pollen from more distal parts of the catchment during periods of increased erosion, samples in
the lower left corner mainly influenced by Phylica arborea, Polypodiaceae, Acaena sp., Rumex frutescens and Empetrum rubrum.
increases from 16×103km3to 23×103km3(Renssen et al., 2002).
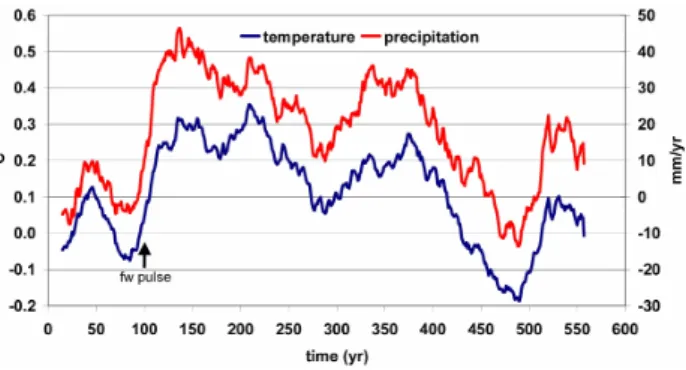
Over the SE Atlantic Ocean there is a clear increase in relative humidity as a response to the North Atlantic THC weakening, as well as higher surface temperatures and pre-cipitation (Fig. 6). This is especially evident during August-October, which is the period with the largest increases in tem-perature and precipitation in the model. A similar response to freshwater perturbations was found in the other 8.2 kyr BP experiments discussed in Renssen et al. (2002), demonstrat-ing that the result shown in Fig. 6 is robust in our model. This confirms that in our model the precipitation increases are re-lated to higher SSTs, following the principle: warmer surface ocean, more evaporation, higher air humidity, more precipi-tation. During the perturbed THC phase (i.e. after year 100 in Fig. 6), the higher levels of SST and precipitation over the SE Atlantic are significantly different (at a 99% level) from the pre-perturbed state, showing that these increases are not due to natural variability inherent in the model.
It should be noted that, when compared to comprehensive coupled GCMs, our model of intermediate complexity sim-ulates a weak response of the hydrological cycle to a THC weakening. We have chosen to use a model of intermedi-ate complexity for our study of the 8.2 kyr event because
this has enabled us to perform a range of multi-centennial runs to test different freshwater scenarios (Renssen et al., 2002). These experiments would not have been feasible with coupled GCMs. As presented in the recent model-intercomparison by Stouffer et al. (2006), coupled GCMs simulate a pronounced southward shift in the ITCZ over the South Atlantic as a response to a THC perturbation, a re-sponse that is underestimated in our model. However, the GCM results show that the precipitation increase that is as-sociated with this southward ITCZ shift is restricted to the latitudinal band ranging from 0 to 30◦S, so considerably north of Nightingale Island (at about 37◦S). However, the coupled GCMs show a secondary precipitation increase over the South Atlantic between 35 and 40◦S as a response to the THC weakening. This secondary precipitation maximum is modest (about +11% in their 1 Sv perturbation runs) com-pared to the primary precipitation maximum associated with the ITCZ shift (up to +100% in the 1 Sv perturbation runs). Stouffer et al. (2006) provide no explanation for this sec-ondary precipitation maximum, but it is noteworthy that in the GCMs the ocean surface also shows considerable warm-ing at this latitude in the South Atlantic, so that it is likely that there is a link between precipitation and SST as is also seen in our model results. Available climate model experiments thus
Fig. 6. Simulation of the 8.2 kyr event over the Southeast
At-lantic (20◦W–10◦E, 40◦S–20◦S), shown by the response in an-nual mean sea surface temperature (left axis) and precipitation (right axis) to a freshwater pulse (fw pulse) in the Labrador Sea (Alley and ´Ag´ustsd´ottir, 2005). Presented are the 30 year running mean anomalies relative to a reference climate in quasi-equilibrium with 8.5 kyr BP forcings (represented by the first 100 years). In the ex-periment, the THC of this 8.5 kyr state was perturbed by a 20 year long freshwater flux with a 0.75 Sv rate in the Labrador Sea, start-ing at year 100 (Alley and ´Ag´ustsd´ottir, 2005;Rohling and P¨alike, 2005). The THC weakening ends at year 420, followed by a ∼100-year long “overshoot” during which the accumulated heat is re-leased in the North Atlantic.
support the suggested mechanism: a weakened THC leads to accumulation of heat in the South Atlantic Ocean through the bipolar seesaw mechanism, leading to a warmer surface ocean, increased evaporation, higher air humidity and ele-vated precipitation levels.
4 Discussion
We believe that the pattern in most of our proxy records can be explained in terms of variations in effective humidity and precipitation. The basal peat indicates an at least 9 m lower water table than at present. The fen-to-lake transition must be the result of significant increase in effective humidity. This implies that a major change of the general circulation pattern took place around 8800 cal. yrs BP, likely reflecting the es-tablishment of the present-day circulation regime, due to a meridional shift of the regional fronts. In fact, marine stud-ies in the Atlantic sector of the Southern Ocean (Nielsen et al., 2004) and land-based studies in South America imply that the westerlies intensified after 9000 cal. yrs BP (Mayr et al., 2007). Temperature reconstructions from Antarctic ice cores show that the Holocene thermal optimum came to an end at about this time (Epica Community Members, 2004; Masson et al., 2000) (Fig. 3), which resulted in expanded sea ice and a steeper meridional temperature gradient in the Southern Ocean. Model studies have shown that changes in sea-ice extent also causes corresponding changes in the po-sition of the westerlies (Hudson and Hewitson, 2001). Thus, it is likely that the westerlies strengthened and shifted
north-wards in the South Atlantic region at the end of the Antarctic thermal optimum around 9000–8500 cal. yrs BP, giving rise to increased precipitation on Nightingale Island. The change from peat growth to gyttja deposition and declining wetland species and the appearance of aquatic species in the pollen diagram represented by lower values on the 2nd PCA axis (Fig. 3), are direct effects of this precipitation increase.
At 8275 cal. yrs BP we note enhanced influx of minero-genic and terrestrial organic matter, and increased deposi-tion of pollen types from more remote parts of the catch-ment. We believe that these simultaneous changes in lithol-ogy, minerogenic content, TC/TN ratio and pollen content (Fig. 3) could only have been caused by increased surface run-off in response to increased precipitation. This led to increased catchment erosion and higher input of terrestrial detritus to the basin. This also explains the increase in pollen from taxa favoured by both open ground, such as Rumex
frutescens, and closed forest species, such as Phylica ar-borea. This pollen assemblage change cannot represent a
true vegetation change since an expansion of forest would limit open ground taxa and vice versa. Therefore we con-clude that the stratigraphic changes at 8275–8025 cal. yrs BP reflect a period of increased precipitation on Nightingale Is-land.
At present, stronger westerlies or higher SSTs are the main agents behind enhanced precipitation in the study area. So, which of these possible mechanisms triggered the changes we see? Intensified westerlies are connected to higher wind speeds, resulting in increased concentrations of sea spray, with sea-salt sulphates as an important marine aerosol com-ponent in coastal areas. We note the low TS values (Fig. 3) at this time, which can be explained either as an effect of low-ered organic content of the sediments or lowlow-ered wind trans-port and deposition of wind-derived sulphur aerosols. Fur-thermore, the higher TC/TS values show that the relative de-cline in TS content was larger than that of TC content. This is a strong indication of that the deposition of sea-salt sulphates at Nightingale Island was not higher, but rather lower, during the period 8275–8025 cal. yrs BP. We therefore hypothesize that the increase in evaporation was caused by higher SST’s. The age of 8275–8025 cal. yrs BP for the inferred precipi-tation increase at 8.33–8.09 m is firmly established by the ra-diocarbon dates and allows for detailed correlation with other climate archives from that period of time. In the light of age error margins of different records, the onset of change is co-eval with the onset of the 8.2 kyr event in the new NGRIP ice core, where it is dated to 8260 cal. yrs BP (Rasmussen et al., 2006), as well as with the shift in the Cariaco Basin grey-scale record (Hughen et al., 2000), dated to 8290 cal. yrs BP (Fig. 3), and with the inferred decline in North At-lantic meridional overturning circulation (MOC) at 8290 cal. yrs BP (Ellison et al., 2006). The inferred increase in pre-cipitation at 8275–8025 cal. yrs BP is consistent with differ-ent model simulations of the 8.2 kyr evdiffer-ent (Renssen et al., 2002, 2001; Bauer et al., 2004; LeGrande et al., 2006). Our
coupled atmosphere-ocean model simulations show statisti-cally significant (at 95% level) increases in SST (by 0.2 to 0.5◦C in annual mean) and precipitation (by 10 to 60 mm/yr
in annual mean) over the South Atlantic as an almost im-mediate response to a freshwater-induced weakening of the THC (Wiersma and Renssen, 2006) (Fig. 6). This lack of a significant time lag between the Greenland 8.2 ka event and the modeled response in the South Atlantic is, in fact, sup-ported by our dating of the event. In the model, the warm-ing is related to reduced northward heat transport in the lantic Ocean, causing heat to accumulate in the South At-lantic, the so-called bipolar seesaw effect, and the warmer surface waters in turn stimulate precipitation in the study re-gion. These model results support our hypothesis that higher SSTs triggered the increased precipitation at our site. Fur-thermore, the increase in precipitation over Nightingale Is-land as a response to a warmer ocean was probably stronger than suggested by the model (Fig. 6), as the local topography of the >300 m high island causes forced lifting of passing air masses, resulting in distinctly higher precipitation than modeled. The model also shows that the westerlies were not strengthened over the South Atlantic during the 8.2 kyr event. Thus, the increase in precipitation around 8200 cal. yrs BP is not only coeval with the 8.2 ka event but also shows the re-sponse predicted by our climate model (Fig. 6). We therefore have reason to believe that this change is the South Atlantic expression of the 8.2 ka event. However, our data do not show any indication of a supposed general climate anomaly starting at 8500 cal. yrs BP and lasting 500–700 years (Keig-win et al., 2005; Rohling and P¨alike, 2005), but only register a more restricted 8.2 kyr event. The duration of the event in our record is approximately 250 years, which is longer than the 160–180 years of the 8.2 kyr event in the NGRIP (Ras-mussen et al., 2006) and Cariaco Basin records (Hughen et al., 2000). The difference is however within the uncertainty of our age model.
The very similar changes in proxy data at 7500–7300 cal. yrs BP compared to those at 8275–8025 kyr BP (Fig. 3) indi-cate that this period was also characterized by increased pre-cipitation. This implies that the period of increased precip-itation associated with the 8.2 kyr event was not unique, but part of a pattern of recurring Holocene climatic perturbations (cf. Ljung and Bj¨orck, 2007). It is therefore noteworthy that our inferred precipitation increase at 7500–7300 kyr BP co-incides with one of the most distinct Holocene North Atlantic IRD peaks/14C production maxima (Bond et al., 2001). Fur-thermore, in spite of a different hydrological regime before 8800 cal. yrs BP, with peat accumulation preceding lacus-trine sedimentation, we note that our pollen data display two peaks in the 2nd axis PCA values (Fig. 3), which are caused by high frequencies of the wetland species Lycopodium
insu-lare. The uppermost of these peaks also coincides with a
pe-riod of decreased peat humification. Thus, these two pepe-riods represent wetter conditions at the peat surface, and are sepa-rated by high Phylica arborea and Polypdiaceae frequencies,
and high content of Blechnum palmiforme remains, which indicates a drier tree-covered peat surface. The two wetter periods are dated to 10 300–10 500 and 9600–9700 cal. yrs BP, respectively, and thus coincide with two cold phases in the North Atlantic region (Bond et al., 2001; Bj¨orck et al., 2001). We also note that several lithological changes similar to the ones at 8275–8025 and 7500–7300 cal. yrs BP occur throughout the rest of the core. This implies that the 8.2 kyr event was not the only period of increased precipitation on Nightingale Island during the Holocene, and it may sug-gest that changes in the MOC was a recurring phenomenon throughout the Holocene, as proposed by Ljung and Bj¨orck (2007).
Since our data imply that there have been several peri-ods of weaker MOC throughout the Holocene this raises the question of whether the precipitation increase we see around 8200 cal. yrs BP is a response to the 8.2 ka event proper or if it is only a coincidence. The pattern differs from that recorded in the Greenland ice cores, where the 8.2 ka event stands out as the most pronounced climatic perturbation dur-ing the Holocene. However, North Atlantic marine records show that variations of the MOC were a recurring feature during the Holocene, and not restricted to the 8.2 ka event (e.g. Oppo et al., 2003). This implies that reduced heat trans-port may have caused several periods of increased SST and precipitation in the South Atlantic, which is also reflected in our dataset. The reason for the pronounced cooling in the North Atlantic region at the 8.2 ka event is the combined ef-fect of massive melt-water discharge and weakening of the ocean circulation. In the South Atlantic, however, only the effect of the weaker circulation is registered. There may also have been more general climatic effects of the 8.2 ka event and its assumed massive fresh-water discharge: the MOC may have been influenced by different processes such as dy-namics in the amount of fresh-water and sea-ice/ice bergs, atmospheric circulation variability and also internal oceanic forcing (Debret et al., 2007), although the end product in the South Atlantic was the same as during later perturba-tions. Another or complementary explanation may be that the 8.2 kyr event was an anomaly with a different trigger-ing mechanism, as compared to most of the other Holocene perturbations, for which solar forcing and related feedbacks have been invoked as major players (Bond et al., 2001).
An alternative hypothesis is to explain the fluctuations in our records by climatic perturbations that were restricted to the South Atlantic Ocean, so without the suggested con-nection to the North Atlantic through the bipolar seesaw. An unambiguous assessment of this possibility requires ad-ditional, equally highly resolved Holocene palaeoclimate records from the region. Although we cannot completely discard this alternative hypothesis, we have two strong ar-guments in favour of the north-south connection. First, the timing of other similar Holocene climatic perturbations registered in the core is similar to the timing of published phases of weakened THC in the North Atlantic. This has
been discussed in detail in a separate paper that provides an overview for the entire Holocene record (Ljung and Bj¨orck, 2007). Second, the response in our records is consistent with the South Atlantic response in climate model experiments in which the THC is perturbed by the release of a realistic fresh-water pulse in the North Atlantic Ocean (as shown in Fig. 6). Thus, the variable NADW formation and strength of the THC whih have been shown for the Holocene, with the weakened THC during the 8.2 kyr event as only one of several similar perturbations (Oppo et al., 2003) is supported by our data.
5 Conclusions
Our island paleoclimate record from the central South At-lantic gives evidence of increased precipitation in response to the North Atlantic 8.2 kyr BP cooling. This was most likely caused by increased SSTs in the surrounding ocean, which is also demonstrated by modelling the coupled atmosphere-ocean response to an 8.2 kyr BP freshwater pulse into the North Atlantic. This is the first clear demonstration of a cli-matic response in the South Atlantic to the 8.2 kyr BP event, and our inter-hemispheric correlation implies that the dis-ruption of NADW formation caused by the drainage of the Laurentide ice-dammed lakes affected the MOC of the entire Atlantic Ocean.
Acknowledgements. This study was supported by the Swedish
Research Council (VR) through grants to SB’s “Atlantis” project (G 5103-20005076/2000). H. Renssen is sponsored by the Netherlands Organization for Scientific Research (N.W.O). We are grateful to the Botanical Museum in Bergen for access to U. Hafsten’s pollen type collection from the islands. We thank O. Bennike, J. Glass and M. Green for field work assistance and James and Felicity Glass and several other Tristan islanders for general logistic support. Edited by: H. Goosse
References
Adams, J. M. and Faur´e, H.: Review and atlas of palaeovegetation: Preliminary land ecosystem maps of the world since the Last Glacial Maximum, Oak Ridge National Laboratory, TN, USA, at: www.esd.ornl.gov/projects/qen, 1997.
Alley, R. B., Mayewski, P. A., Stuiver, M., Taylor, K. C., and Clark, P. U.: Holocene climatic instability: A prominent, widespread event 8200 yr ago, Geology, 25, 483–486, 1997.
Alley, R. B. and ´Ag´ustsd´ottir, A. M.: The 8k event: Cause and consequences of a major Holocene abrupt climate change, Quat. Sci. Rev., 24, 1123–1149, 2005.
Arz, H. W., Gerhardt, S., P¨atzold, J., and R¨ohl, U.: Millennial-scale changes of surface- and deep-water flow in the western tropical Atlantic linked to northern hemisphere high-latitude climate dur-ing the Holocene, Geology, 29, 239–242, 2001.
Barber, D. C., Dyke, A., Hillaire-Marcel, C., Jennings, A. E., An-drews, J. T., Kerwin, M. W., Bilodeau, G., McNeely, R., Southon, J., Morehead, M. D., and Gagnon, J. M.: Forcing of the cold
event of 8,200 years ago by catastrophic drainage of Laurentide Lakes, Nature, 400, 344–348, 1999.
Bauer, E., Ganopolski, A., and Montoya, M.: Simulation of the cold climate event 8200 years ago by meltwater out-burst from Lake Agassiz, Paleoceanography, 19, PA001030, doi:10.1029/2004PA001030, 2004.
Bengtsson, L. and Enell, M.: Chemical analysis, in: Handbook of Holocene palaeoecology and palaeohydrology., edited by: Berglund, B. E., John Wiley & Sons Ldt, Chichester, 423–451, 1986.
Berger, A. L.: Long-term variations of daily insolation and quater-nary climatic changes, J. Atmos. Sci., 35, 2363–2367, 1978. Berglund, B. E. and Ralska-Jasiewiczowa, M.: Pollen analysis and
pollen diagrams, in: Handbook of Holocene palaeoecology and palaeohydrology, edited by: Berglund, B. E., Wiley, Chichester, 455–484, 1986.
Bj¨orck, S., Muscheler, R., Kromer, B., Andresen, C. S., Heinemeier, J., Johnsen, S. J., Conley, D., Koc¸, N., Spurk, M., and Veski, S.: High-resolution analyses of an Early Holocene climate event may imply decreased solar forcing as an important climate trig-ger, Geology, 29, 1107–1110, 2001.
Bond, G., Kromer, B., Beer, J., Muscheler, R., Evans, M. N., Show-ers, W., Hoffman, S., Lotti-Bond, R., Hajdas, I., and Bonani, G.: Persistent solar influence on North Atlantic climate during the Holocene, Science, 294, 2130–2136, 2001.
Broecker, W. S.: Paleocean circulation during the last deglaciation: A bipolar seesaw?, Paleoceanography, 13, 119–121, 1998. Bronk Ramsey, C.: Radiocarbon calibration and analysis of
stratig-raphy: The oxcal program, Radiocarbon, 37, 425–430, 1995. Bronk Ramsey, C.: Development of the radiocarbon program oxcal,
Radiocarbon, 43, 381–389, 2001.
Crowley, T. J.: North Atlantic deep water cools the southern hemi-sphere, Paleoceanography, 7, 489–497, 1992.
Debret, M., Bout-Roumazeilles, V., Grousset, F., Desmet, M., Mc-Manus, J. F., Massei, N., Sebag, D., Petit, J.-R., Copard, Y., and Trentesaux, A.: The origin of the 1500-year cycles in the Holocene North-Atlantic records, Clim. Past, 3, 569–575, 2007, http://www.clim-past.net/3/569/2007/.
Ellison, C. R. W., Chapman, M. R., and Hall, I. R.: Surface and deep ocean interactions during the cold climate event 8200 years ago, Science, 312, 1929–1932, 2006.
Epica Community Members: Eight glacial cycles from an Antarctic ice core, Nature, 429, 623–628, 2004.
Goosse, H. and Fichefet, T.: Importance of ice-ocean interactions for the global ocean circulation: A model study, J. Geophys. Res., 104, 23 337–323 355, 1999.
Goosse, H., Selten, F. M., Haarsma, R. J., and Opsteegh, J. D.: Decadal variability in high northern latitudes as simulated by an intermediate-complexity climate model, Ann. Glaciol., 33, 525– 532, 2001.
Hafsten, U.: Pleistocene development of vegetation and climate in Tristan da Cunha and Gough Island., ˚Arbok Univeristetet i Bergen, Mat.-Naturv. Serie. A, 20, 1–45, 1960.
Haug, G. H., Hughen, K. A., Peterson, L. C., Sigman, D. M., and Rohl, U.: Southward migration of the intertropical convergence zone through the Holocene, Science, 293, 1304–1308, 2001. Hudson, D. A. and Hewitson, B. C.: The atmospheric response to
a reduction in summer Antarctic sea-ice extent., Clim. Res., 16, 76–99, 2001.
Hughen, K. A., Southon, J. R., Lehman, S., and Overpeck, J.: Syn-chronous radiocarbon and climate shifts during the last deglacia-tion, Science, 290, 1951–1955, 2000.
H¨oflich, O.: Climate of South Atlantic Ocean., in: World survey of climatology, edited by: van Loon, H., Elsevier, Oxford, 195, 1984.
Keigwin, L. D., Sachs, J. P., Rosenthal, Y., and Boyle, E. A.: The 8200 year B.P. event in the slope water system, west-ern subpolar North Atlantic, Paleoceanography, 20, PA001074, doi:10.1029/2004PA001074, 2005.
LeGrande, A. N., Schmidt, G. A., Shindell, D. T., Field, C. V., Miller, R. L., Koch, D. M., Faluvegi, G., and Hoffman, G.: Con-sistent simulations of multiple proxy responses to an abrupt cli-mate change event, PNAS, 103, 837–842, 2006.
Ljung, K., Bj¨orck, S., Hammarlund, D., and Barnekow, L.: Late Holocene multi-proxy records of environmental change on the South Atlantic island Tristan da Cunha, Palaeogeog., Palaeo-clim., Palaeoecol., 241, 539–560, 2006.
Ljung, K. and Bj¨orck, S.: Holocene climate and vegetation dynam-ics on Nightingale Island, South Atlantic – an apparent inter-glacial bipolar seesaw in action?, Quat. Sci. Rev., 26, 3150–3166 2007.
Masson, V., Vimeux, F., Jouzel, J., Morgan, V., Delmotte, M., Ciais, P., Hammer, C., Johnsen, S., Lipenkov, V. Y., Mosley-Thompson, E., Petit, J.-R., Steig, E. J., Stievenard, M., and Vaikmae, R.: Holocene climate variability in Antarctica based on 11 ice-core isotopic records, Quat. Res., 54, 348–358, 2000.
Mayr, C., Wille, M., Haberzettl, T., Fey, M., Janssen, S., L¨ucke, A., Ohlendorf, C., Oliva, G., Sch¨abitz, F., Schleser, G. H., and Zolittschka, B.: Holocene variability of the southern hemisphere westerlies in Argentinean Patagonia (52s), Quat. Sci. Rev., 26, 579–584, doi:10.1016/j.quascirev.2006.11.013, 2007.
McCormac, F. G., Hogg, A. G., Blackwell, P. G., Buck, C. E., Higham, T. F. G., and Reimer, P. J.: Shcal04 southern hemi-sphere calibration, 0 - 11 kyr cal BP, Radiocarbon, 46, 1087– 1092, 2004.
Meyers, P. A. and Teranes, J. L.: Sediment organic matter, in: Tracking environmental change using lake sediments, edited by: Last, W. M. and Smol, J. P., Kluwer Academic Publishers, Dor-drecht, 239–269, 2001.
Meyers, P. A.: Applications of organic geochemistry to paleolimno-logical reconstructions: A summary of examples from the Lau-rentian Great Lakes, Org. Geochem., 34, 261–289, 2003. Moore, P. D., Webb, J. A., and Collinson, M. E.: Pollen analysis,
2nd ed., Blackwell Scientific, Oxford, 216 pp., 1991.
Morrill, C. and Jacobsen, R. M.: How widespread were the climate anomalies 8200 years ago?, Geophys. Res. Lett., 32, L19701, doi:10.1029/2005GL023536, 2005.
Nielsen, S. H. H., Koc, N., and Crosta, X.: Holocene climate in the Atlantic sector of the southern ocean: Controlled by insolation or oceanic circulation?, Geology, 32, 317–320, 2004.
Oppo, D. W., McManus, J. F., and Cullen, J. L.: Deepwater vari-ability in the Holocene epoch, Nature, 422, 277–279, 2003. Opsteegh, J. D., Haarsma, R. J., Selten, F. M., and Kattenberg, A.:
Ecbilt: A dynamic alternative to mixed boundary conditions in ocean models, Tellus, 50A, 348–367, 1998.
Peltier, W. R.: Ice age paleotopography, Science, 265, 195–201, 1994.
Piotrowski, A. M., Goldstein, S. L., Hemming, S. R., and Fairbanks, R. G.: Intensification and variability of ocean thermohaline cir-culation through the last deglaciation, Earth Planet. Sci. Lett., 225, 205–220, 2004.
Rasmussen, S. O., Andersen, K. K., Svensson, A. M., Steffensen, J. P., Vinther, B. M., Clausen, H. B., Siggaard-Andersen, M.-L., Johnsen, S. J., B., L. M.-L., Dahl-Jensen, D., Bigler, M., R¨othlisberger, R., Fischer, H., Goto-Azuma, K., Hansson, M. E., and Ruth, U.: A new Greenland ice core chronology for the last glacial termination, J. Geophys. Res., 111, D06102, doi:10.1029/2005JD006079, 2006.
Raynaud, D., Barnola, J.-M., Chappellaz, J., Blunier, T., In-derm¨uhle, A., and Stauffer, B.: The ice record of greenhouse gases: A view in the context of future changes, Quat. Sci. Rev., 19, 9–17, 2000.
Renssen, H., Goosse, H., Fichefet, T., and Campin, J.-M.: The 8.2 kyr event simulated by a global atmosphere-sea-ice-ocean model, Geophys. Res. Lett., 28, 1567–1570, 2001.
Renssen, H., Goosse, H., and Fichefet, T.: Modelling the effect of freshwater pulses on the early Holocene climate: The in-fluence of high-frequency climate variability, Paleoceanography, 17, PA000649, doi:10.1029/2001PA000649, 2002.
Rohling, E. J. and P¨alike, H.: Centennial-scale climate cooling with a sudden cold event around 8,200 years ago, Nature, 434, 975– 979, 2005.
Stocker, T. F., Wright, D. G., and Mysak, L. A.: A zonally aver-aged, coupled ocean-atmosphere model for paleoclimate studies, J. Climate, 5, 773–797, 1992.
Stocker, T. F.: The seesaw effect, Science, 282, 61–62, 1998. Stouffer, R. J.: Investigating the causes of the response of the
ther-mohaline circulation to past and future climate changes, J. Cli-mate, 19, 1365–1387, 2006.
Thompson, R. and Oldfield, F.: Environmental magnetism, Allen & Unwin, London, 227 pp., 1986.
Wiersma, A. P. and Renssen, H.: Model-data comparison for the 8.2 ka BP event: Confirmation of a forcing mechanism by catas-trophic drainage of Laurentide Lakes, Quat. Sci. Rev., 25, 63–88, 2006.
Von Grafenstein, U., Erlenkeuser, H., Brauer, A., Jouzel, J., and Johnsen, S. J.: A Mid-European decadal isotope-climate record from 15,500 to 5000 years B.P, Science, 284, 1654–1657, 1999.