HAL Id: hal-02878541
https://hal.sorbonne-universite.fr/hal-02878541
Submitted on 23 Jun 2020
HAL is a multi-disciplinary open access
archive for the deposit and dissemination of
sci-entific research documents, whether they are
pub-lished or not. The documents may come from
teaching and research institutions in France or
abroad, or from public or private research centers.
L’archive ouverte pluridisciplinaire HAL, est
destinée au dépôt et à la diffusion de documents
scientifiques de niveau recherche, publiés ou non,
émanant des établissements d’enseignement et de
recherche français ou étrangers, des laboratoires
publics ou privés.
Dwarf Galaxies: From the Epoch of Peak Star
Formation to the Epoch of Reionization
Hakim Atek
To cite this version:
Hakim Atek. Dwarf Galaxies: From the Epoch of Peak Star Formation to the Epoch of Reionization.
Symposium- International Astronomical Union, Kluwer, 2018. �hal-02878541�
Dwarfs Galaxies: From the Deep Universe to the Present Proceedings IAU Symposium No. 344, 2018
A.C. Editor, B.D. Editor & C.E. Editor, eds.
⃝
DOI: 00.0000/X000000000000000X
Dwarf Galaxies: From the Epoch of Peak
Star Formation to the Epoch of Reionization
Hakim Atek1
1Institut d’astrophysique de Paris, CNRS UMR7095, Sorbonne Universit´e, 98bis Boulevard
Arago, F-75014, Paris, France email: [email protected] Abstract.
Dwarf galaxies represent the dominant population at high redshift and they most likely con-tributed in great part to star formation history of the Universe and cosmic reionization. The importance of dwarf galaxies at high redshift has been mostly recognized in the last decade due to large progress in observing facilities allowing deep galaxy surveys to identify low-mass galaxies. This population appear to have extreme emission lines and ionizing properties that challenge stellar population models. Star formation follows a stochastic process in these galax-ies, which has important implication on the ionizing photon production and its escape fraction whose measurements are challenging for both simulations and observations. Outstanding ques-tions include: what are the physical properties at the origin of such extreme properties ? What are the smallest dark matter halos that host star formation ? Are dwarf galaxies responsible for cosmic reionization ?
Keywords.galaxies: high-redshift, galaxies: formation, galaxies: evolution, galaxies: dwarf, (cos-mology:) early universe
1. Introduction
The importance of dwarf galaxies is related to two of the most important periods in the history of the Universe. Firstly, the galaxy ultraviolet (UV) luminosity function (LF) at z ∼ 1 − 3 shows that faint galaxies are the main contributors to the UV emission (e.g. Alavi et al. 2016), hence to the star formation density. This redshift range corresponds to the most efficient epoch in terms of star formation, where most of the stellar mass known today was formed (Madau & Dickinson 2014). Secondly, the UV LF at z > 6 and their ionizing properties show that dwarf galaxies most likely produced most of the ionizing emission responsible for cosmic reionization.
Overall, recent progress in observational facilities has allowed us to identify low-mass galaxies at high redshift, revealing their prevalence and their extreme properties com-pared to local galaxies and the massive counterparts. Dwarf galaxies are not the excep-tion. They are the dominant population at high redshift. They are representative of the galaxy population and are therefore the best targets to understand the galaxy formation and evolution across cosmic time and the process of cosmic reionization.
2. Detecting Low-mass Galaxies at High Redshift
Until recently, our knowledge on the physical properties and the evolution of galax-ies at high redshift was essentially based on samples of relatively massive galaxgalax-ies. The photometric selection techniques used in deep galaxy surveys are biased towards bright-continuum galaxies. While narrow-band or spectroscopic surveys of the rest-frame ul-traviolet (UV) domain have produced large samples of Lyman-alpha emitters at z > 2
2 Hakim Atek
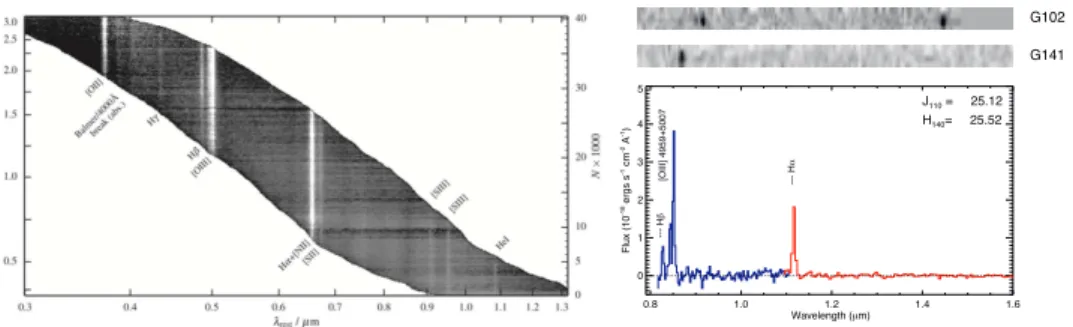
(e.g. Drake et al. 2017, Sobral et al. 2018), their physical properties remain elusive due to the lack of rest-frame optical emission lines which are redshifted to the near-infrared (NIR) window at high redshift. In order to overcome the strong atmospheric NIR air-glow, several space-based spectroscopic programs have been conducted during the last decade, utilizing the powerful capabilities of the Wide Field Camera 3 (WFC3) onboard the Hubble Space Telescope (HST). The WFC3 NIR grisms slitless spectrocopy has been extensively used by the 3DHST survey (Brammer et al. 2012, Momcheva et al. 2016, Figure 1) and the pure-parallel program WISPS (Atek et al. 2010; see also Straughn et al. 2011). Such observations enabled the detection of pure emission lines (cf. Figure 1), regardless of their stellar continua, which led to the discovery of extremely strong emission line galaxies (e.g., Atek et al. 2011, Shim et al. 2011, see also Van der Wel et al.
2011) with equivalent widths reaching EW=1500 ˚A and stellar masses down to 108
M⊙.
While they remain relatively rare in the local Universe, such extreme objects are much more numerous at z ∼ 2 and their prevalence seem to increase with redshift (Atek et al. 2011, Shim et al. 2011, Fumagalli et al. 2012, Stark et al. 2013, Schenker et al. 2013b, Smit et al. 2014). More recently, combining high sensitivity and high multiplexing, the multi-unit spectroscopic explorer (MUSE) on the VLT reached unprecedented discovery space, identifying emission lines galaxies that show no detection in the deepest HST images (e.g. Bacon et al. 2015, Maseda et al. 2018).
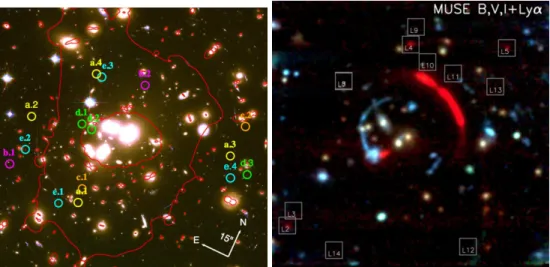
The strong gravitational lensing offered by massive galaxy clusters is a powerful tool to push further down the detection limits of current observing facilities. An important sample of ultra-faint dwarf galaxies has been detected at z = 1−3 behind lensing clusters,
down to unprecedented magnitude limits of MUV∼ −13 mag (Alavi et al. 2016) using
deep HST imaging in the UV. Similarly, the Frontier Fields Initiative (HFF) extended the galaxy UV luminosity function at z ∼ 6 nearly three magnitudes deeper than the deepest HST observations of blank fields (Atek et al. 2015, Bouwens et al. 2017, Livermore et al. 2017, Ishigaki et al. 2018). Space- and ground-based spectroscopic observations of lensing clusters also allowed spatially-resolved studies of the physical properties of low-mass galaxies at high-redshift (Jones et al. 2015, Smit et al. 2017).
0.8 1.0 1.2 1.4 1.6 Wavelength (!m) 0 1 2 3 4 5 Flux (10 -18 ergs s -1 cm -2 A -1) [OIII] 4959+5007 --- H ! --- H " J110 = 25.12 H140= 25.52 G141 G102
Figure 1.Slitless spectroscopy using the HST/WFC3 infrared grisms. Left: a montage of 1D spectra from Momcheva et al. (2016) shows the wavelength coverage of the G141 grism and the optical emission lines available as a function of redshift in the 3DHST survey. Right: 1D and 2D spectra from the WSIP survey (Atek et al. 2010) using both G102 and G141 grisms showing the detection of an extreme emission line galaxy with undetected stellar continuum.
Dwarf Galaxies at High Redshift 3
Figure 2.Lensing-assisted observations of dwarf galaxies at high redshift. Left: Multiple images of dwarf galaxies at z ∼ 1 − 3 behind the massive galaxy cluster Abell 1689 from Alavi et al. (2016). The red curve denotes the critical line at z = 2.5. Right: A giant lensing arc of a galaxy at z = 4.88, behind the massive cluster RCS 0224, observed in Lyα with VLT/MUSE (Smit et al. 2017).
3. A New Look at Scaling Relations
The great progress in observing capabilities and strategies now shed a new light on some of the fundamental galaxy scaling relations. A tight correlation between the SFR and stellar mass at a given redshift has been observed at low and high redshift (e.g. Brinchmann et al. 2004, Noeske et al. 2007, Karim et al. 2011, Whitaker et al. 2012, Speagle et al. 2014, Ilbert et al. 2014, Santini et al. 2017, Bisigello et al. 2018) describ-ing a linear mass buildup in galaxies refereed to as the “main sequence”. The slope,
the normalisation, and the scatter of the SFR-M⋆relation carry important information
regarding the different processes that shape galaxies such as the gas accretion rate and the stochasticity of star formation activity. For this reason, various hydrodynamical sim-ulations (Dav´e et al. 2011a, Torrey et al. 2014, Sparre et al. 2015, Tacchella et al. 2016, Matthee et al. 2018) and semi-analytical models (e.g., Dekel et al. 2013) attempted to reproduce the parameters of the main sequence but failed to fit the normalization and
its evolution with redshift. Most of the constraints obtained on the SFR-M⋆relation are
restricted to the high-mass end and suffer from inconsistent measurements of the SFR. Such studies also rely on photometric redshifts due to the lack of spectroscopic informa-tion. Recent spectroscopic programs enables the exploration of larger dynamical range in
stellar masses going down to M⋆∼ 107M⊙and direct measurements of the SFR using the
Hα emission line. Figure 3 shows the SFR-M⋆relation for EELGs and how they compare
to the rest of emission-line galaxies and how they show a large offset from the “main sequence”, which denotes the starbursting nature of these low-mass galaxies (Atek et al. 2014c). During each starburst episode the galaxy departs from the main sequence. Hy-drodynamical simulations of dwarf galaxies have successfully reproduced the stochastic star formation, showing in particular that each star formation episode is triggered by gas accretion before supernova outflows deplete the central region of gas. A succession of gas accretion from the halo leads to a highly stochastic star formation activity (Governato et al. 2012, Shen et al. 2014, Madau et al. 2014, Sparre et al. 2017). A direct consequence of this burstiness is a larger dispersion in the observed SFR indicators, such as the Hα line,
4 Hakim Atek
in lower-mass galaxies. Therefore, galaxy surveys targeting the Hα equivalent width, will miss a significant fraction of star-forming dwarfs (Dominguez et al. 2015).
Figure 3.The star formation rate and stellar mass relation. Left: SFR-M⋆for EELGs compared
to star-forming galaxies at four different redshifts (Amorin et al. 2015). The solid and dashed lines represent the main sequence at the corresponding redshifts from Whitaker et al. 2012. Right:The specific SFR vs stellar mass for grism-selected EELGs from z = 0.3 to z = 2.5 from Atek et al. (2014c).
The stellar mass buildup in galaxies also leads to chemical enrichment of their interstel-lar medium (ISM). Therefore, the relation between the gas phase metallicity and the SFR or stellar mass is an important test for galaxy evolution models (Peeples & Shankar 2011, Lilly et al. 2013, Chisholm et al. 2018, ) as it describes the interplay between neutral gas accretion, which dilutes metals, and the outflowing metal-rich gas. On the observational side, the oxygen abundance is found to correlate with the stellar mass (MZR) and its normalization also evolves with redshift (Tremonti et al. 2004, Maiolino et al. 2008, Berg et al. 2012, Troncoso et al. 2014, Zahid et al. 2014). However, extending the MZR to
lower stellar masses (below 109
M⊙) at high redshift is challenging, and the slope or the
normalization are still poorly constrained (Henry et al. 2013, Whitaker et al. 2014, Salim et al. 2014). Recently, the gas-phase metallicity has been measured in a sample of low-mass EELGs at z ∼ 3 and shows a strong evolution towards low metallicities compared to more massive galaxies at similar redshifts (Amorin et al. 2017). If the burst episodes in these dwarfs is fuelled by gas accretion, then their large offset from the MZR can be explained by the inflow of metal-poor gas. HST imaging of these galaxies also reveal very small sizes, hence very high SFR surface densities. Spectroscopic observations of a similar population of galaxies at 1.3 < z < 2.3 show a high star formation efficiency with a mass growth scale of ∼ 10 Myr (Maseda et al. 2014, Atek et al. 2014).
4. Dwarf Galaxies at the Epoch of Reionization
Cosmic reionization is one of the most important transitions in the history of the Universe. It corresponds to the global ionization of the neutral hydrogen in the Universe by the first sources of light that happened between z ∼ 6 and z ∼ 10 (Fan et al. 2006, Becker & Bolton 2013, Planck collaboration 2016). Identifying the sources responsible for cosmic reionization remains a major challenge in observational cosmology. While there is still no consensus on the nature of these sources, most recent studies point towards early star-forming galaxies as the main sources of the UV emission, hence most likely
Dwarf Galaxies at High Redshift 5 the ionizing emission (e.g. Robertson et al. 2015, Bouwens et al. 2015, Finkelstein et al. 2015). In order to assess the exact contribution of galaxies to the ionizing background, one needs to measure three main quantities: the non-ionizing UV luminosity density, the ionizing photon production efficiency relative the UV emission, and the escape fraction of ionizing radiation from galaxies. The integrated UV luminosity density depends on the shape of the UV luminosity function of galaxies, particularly at the faint end where it becomes vey steep, and where it reaches the smellest galaxies even formed, i.e. the faint integration limit. Galaxy deep blank fields surveys with HST have put strong constraints on the overall shape of the UV LF with more than a thousand of galaxies identified at
z >6 (Bunker et al. 2010; Oesch et al. 2010, Bouwens et al. 2011, Finkelstein et al. 2012,
McLure et al. 2013, Schenker et al. 2013a, Bouwens et al. 2015). The very steep faint-end slope of the UV LF (α ∼ −2) clearly demonstrates that dwarf galaxies are likely the dominant contributor to the total UV emission. However, the integrated UV luminosity density falls short of the required threshold to maintain The IGM ionized, which calls for a contribution for fainter galaxies beyond the detection limits of blank field surveys
around MU V ∼ −17 AB.
The strong gravitational lensing offered by massive galaxy clusters offer a unique op-portunity to push the detection limits of current instrumentation by amplifying the flux of distant background sources (Kneib & Natarajan 2011, Sharon et al. 2012, Postman et al. 2012, Richard et al. 2014, Salmon et al. 2017). The Hubble Frontier Fields program (Lotz et al. 2017), which consists of deep multi-band imaging of six massive clusters, has enabled the identification of extremely faint galaxies and constraints on the UV LF more than two magnitudes deeper than previous studies (Atek et al. 2014b, 2015a,b, Ishigaki et al. 2014, Zheng et al. 2014, Yue et al. 2014, Castellano et al. 2016; Laporte et al. 2016, Bouwens et al. 2017, Livermore et al. 2017, Kawamata et al. 2018). These results
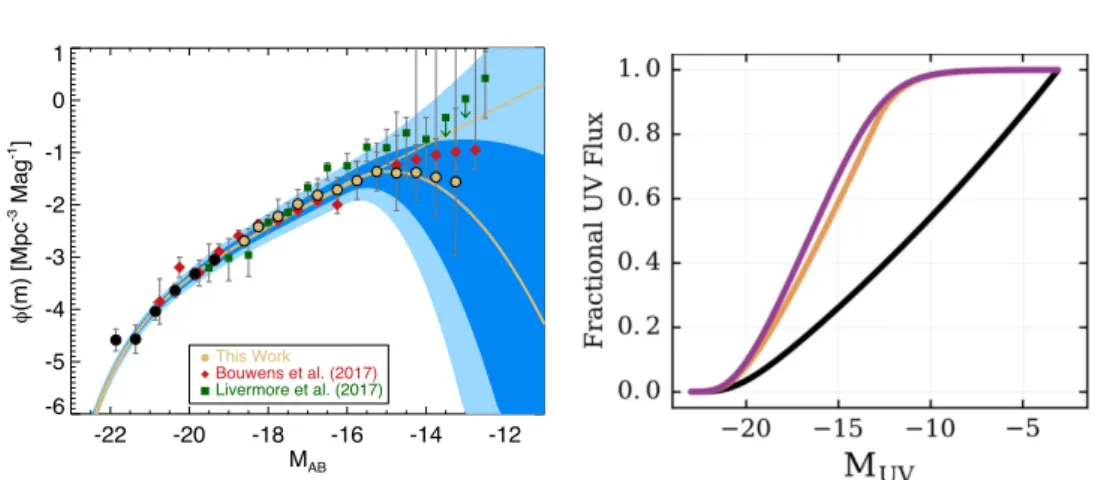
confirm a steep faint-end slope of α ∼ −2 down to an intrinsic magnitude of MUV∼ −15
(see Figure 4, left). Beyond this limit, uncertainties become too important to reliably identify a rollover at the faint end of the UV LF, as the discrepancies observed between different studies reveal. The right panel of Figure 4 shows the cumulative contribution of galaxies as a function of their intrinsic magnitude (Weisz et al. 2017). In the case of a steep faint-end slope, the contribution of fainter galaxies keep increasing with more than
60% of the UV emission coming from galaxies fainter than MUV= -15. When the UV LF
rolls over around MUV= -13, the contribution of these ultra-faint galaxies is only about
30%.
Also regarding the faint end of the UV LF, near-field studies have produced inde-pendent constraints by local dwarfs as fossils of high-redshift galaxies. Combining their star formation histories with stellar population models offer another perspective on their progenitors at early times, predicting a steep faint-end slope out to z ∼ 5 (Weisz et al. 2015). The most notable result of of such studies shows that there should be a turnover
in the UV LF at z ∼ 6 approximately around MUV= -13 (Boylan-Kolchin et al. 2015).
A steep faint-end slope that extend to magnitudes fainter than MUV =-13 would lead to
an overproduction of dwarf galaxies in the local Universe.
Assuming canonical values for the ionizing radiation efficiency and escape fraction (log
fescξion = 24.53), The derived UV luminosity density at z ∼ 6 in the Frontier Fields
results, although lower than previous determinations due to the potential turnover, is still in agreement with the required emissivity to maintain reionization. However, the precise measurement of the ionizing efficiency and its escape fraction of the dominant population of dwarf galaxies are necessary to determine their contribution to the ionizing background. The stochastic nature of star formation in low-mass galaxies have important implications on these parameters. Hydrodynamical simulations show that the bursty star
6 Hakim Atek -22 -20 -18 -16 -14 -12 MAB -6 -5 -4 -3 -2 -1 0 1 φ (m) [Mpc -3 Mag -1] Livermore et al. (2017) Bouwens et al. (2017) This Work
Figure 4.The galaxy UV luminosity function at z ∼ 6 using gravitational lensing. Left: The UV LF from the Frontier Fields observations and the best fit using a modified form of the Schechter function allowing for a rollover at the fain end (Atek et al. 2018). The dark and light regions show the significant uncertainties on the shape of the UV LF beyond MU V ∼ −15 AB. Right:The cumulative contribution of galaxies as a function of their absolute UV magnitude in the case of a steep faint-end slope (black line) and in the case of a turnover around MU V = −13
AB (orange and purple lines) from Weisz et al. (2017).
formation lead to strong variations on a short timescale of the ionizing emissivity (e.g. Dominguez et al. 2015). The average ratio between the ionizing and the non-ionizing
continuum luminosities Lν(900 ˚A)/Lν1500 ˚A becomes significantly higher than the
con-stant value of 7 usually assumed for a concon-stant star formation (Figure 5). High-resolution simulations also show that each burst episode is followed by supernova-driven outflows that clear the ISM and facilitates the escape of ionizing radiation (Trebitsch et al. 2017). The knowledge of the duty cycle and the physical properties regulating the production and the escape of ionizing radiation is still challenging in hydro zoom-in simulations but
also in observations. Indirect measurements of ξion at z ∼ 4 − 5 have been recently been
reported using IRAC flux excess to derive the Hα flux and infer the ionizing photon production rate (Bouwens et al. 2016). More direct spectroscopic measurements at z ∼ 2
show higher ξion values in galaxies with a blue UV slope similar to z > 6 galaxies,
al-though with a large scatter (Shivaei et al. 2018). Large spectroscopic surveys combined with deep UV observations are needed to make progress regarding these two important parameters.
References
Amor´ın, R., Fontana, A., P´erez-Montero, E., et al. 2017, Nature Astronomy, 1, 0052 Amor´ın, R., P´erez-Montero, E., Contini, T., et al. 2015, A&A, 578, A105
Atek, H., Richard, J., Kneib, J.-P., & Schaerer, D. 2018, MNRAS, 479, 5184 Atek, H., Richard, J., Jauzac, M., et al. 2015, ApJ, 814, 69
Atek, H., Richard, J., Kneib, J.-P., et al. 2015, ApJ, 800, 18 Atek, H., Kneib, J.-P., Pacifici, C., et al. 2014, ApJ, 789, 96 Atek, H., Richard, J., Kneib, J.-P., et al. 2014, ApJ, 786, 60 Atek, H., Siana, B., Scarlata, C., et al. 2011, ApJ, 743, 121 Atek, H., Malkan, M., McCarthy, P., et al. 2010, ApJ, 723, 104 Becker, G. D., & Bolton, J. S. 2013, MNRAS, 436, 1023
Bisigello, L., Caputi, K. I., Grogin, N., & Koekemoer, A. 2018, A&A, 609, A82 Bacon, R., Brinchmann, J., Richard, J., et al. 2015, A&A, 575, A75
Dwarf Galaxies at High Redshift 7
Figure 5.The ionizing emissivity of dwarf galaxies. Left: The ionizing efficiency of three simu-lated dwarf galaxies with stellar masses log(M⋆/M⊙)=7 (blue line), 8.5 (green line), and 10 (red
line) from Dominguez et al. (2014). The stasr formation stochasticity on the low-mass galaxy leads to large variation in the ionizing efficiency, with an average value significantly higher than other galaxies. Right: evolution of the escape fraction of ionizing radiation compared to the star formation and the outflows rates in simulated galaxies from Trebitsch et al. (2017). After each SF burst episode the escape fraction increases following the outflow rate.
Boylan-Kolchin, M., Weisz, D. R., Johnson, B. D., et al. 2015, MNRAS, 453, 1503
Bouwens, R. J., Oesch, P. A., Illingworth, G. D., Ellis, R. S., & Stefanon, M. 2017, ApJ, 843, 129
Bouwens, R. J., Smit, R., Labb´e, I., et al. 2016, ApJ, 831, 176
Bouwens, R. J., Illingworth, G. D., Oesch, P. A., et al. 2015, ApJ, 811, 140 Bouwens, R. J., Illingworth, G. D., Oesch, P. A., et al. 2011, ApJ, 737, 90 Brammer, G. B., van Dokkum, P. G., Franx, M., et al. 2012, ApJS, 200, 13 Brinchmann, J., Charlot, S., White, S. D. M., et al. 2004, MNRAS, 351, 1151 Bunker, A. J., Wilkins, S., Ellis, R. S., et al. 2010, MNRAS, 409, 855 Castellano, M., Yue, B., Ferrara, A., et al. 2016, ApJL, 823, L40 Chisholm, J., Tremonti, C., & Leitherer, C. 2018, MNRAS,
Dav´e, R., Oppenheimer, B. D., & Finlator, K. 2011, MNRAS, 415, 11 Dav´e, R., Finlator, K., & Oppenheimer, B. D. 2011, MNRAS, 416, 1354 Dom´ınguez, A., Siana, B., Brooks, A. M., et al. 2015, MNRAS, 451, 839 Drake, A. B., Garel, T., Wisotzki, L., et al. 2017, A&A, 608, A6 Fan, X., Strauss, M. A., Becker, R. H., et al. 2006, AJ, 132, 117
Finkelstein, S. L., Ryan, R. E., Jr., Papovich, C., et al. 2015, ApJ, 810, 71 Finkelstein, S. L., Papovich, C., Salmon, B., et al. 2012, ApJ, 756, 164 Fumagalli, M., Patel, S. G., Franx, M., et al. 2012, ApJL, 757, L22 Governato, F., Zolotov, A., Pontzen, A., et al. 2012, MNRAS, 422, 1231 Ilbert, O., Arnouts, S., Le Floc’h, E., et al. 2015, A&A, 579, A2 Ishigaki, M., Kawamata, R., Ouchi, M., et al. 2018, ApJ, 854, 73 Jones, T., Wang, X., Schmidt, K. B., et al. 2015, AJ, 149, 107 Kawamata, R., Ishigaki, M., Shimasaku, K., et al. 2018, ApJ, 855, 4 Kneib, J.-P., & Natarajan, P. 2011, A&ARv, 19, 47
Karim, A., Schinnerer, E., Mart´ınez-Sansigre, A., et al. 2011, ApJ, 730, 61 Kurczynski, P., Gawiser, E., Acquaviva, V., et al. 2016, ApJL, 820, L1 Laporte, N., Infante, L., Troncoso Iribarren, P., et al. 2016, ApJ, 820, 98
Lilly, S. J., Carollo, C. M., Pipino, A., Renzini, A., & Peng, Y. 2013, ApJ, 772, 119 Livermore, R. C., Finkelstein, S. L., & Lotz, J. M. 2017, ApJ, 835, 113
Lotz, J. M., Koekemoer, A., Coe, D., et al. 2017, ApJ, 837, 97 Madau, P., Weisz, D. R., & Conroy, C. 2014, ApJL, 790, L17 Madau, P., & Dickinson, M. 2014, ARA&A, 52, 415
8 Hakim Atek
Maseda, M. V., van der Wel, A., Rix, H.-W., et al. 2014, ApJ, 791, 17 Matthee, J., & Schaye, J. 2018, arXiv:1805.05956
Momcheva, I. G., Brammer, G. B., van Dokkum, P. G., et al. 2016, ApJS, 225, 27 McLure, R. J., Dunlop, J. S., Bowler, R. A. A., et al. 2013, MNRAS, 432, 2696 Noeske, K. G., Weiner, B. J., Faber, S. M., et al. 2007, ApJL, 660, L43 Oesch, P. A., Bouwens, R. J., Illingworth, G. D., et al. 2010, ApJL, 709, L16 Peeples, M. S., & Shankar, F. 2011, MNRAS, 417, 2962
Pirzkal, N., Malhotra, S., Ryan, R. E., et al. 2017, ApJ, 846, 84
Planck Collaboration, Adam, R., Aghanim, N., et al. 2016, A&A, 596, A108 Postman, M., Coe, D., Ben´ıtez, N., et al. 2012, ApJS, 199, 25
Richard, J., Jauzac, M., Limousin, M., et al. 2014, MNRAS, 444, 268
Robertson, B. E., Ellis, R. S., Furlanetto, S. R., & Dunlop, J. S. 2015, ApJL, 802, L19 Salmon, B., Coe, D., Bradley, L., et al. 2017, arXiv:1710.08930
Santini, P., Fontana, A., Castellano, M., et al. 2017, ApJ, 847, 76
Shen, S., Madau, P., Conroy, C., Governato, F., & Mayer, L. 2014, ApJ, 792, 99 Shim, H., Chary, R.-R., Dickinson, M., et al. 2011, ApJ, 738, 69
Sobral, D., Santos, S., Matthee, J., et al. 2018, MNRAS, 476, 4725
Schenker, M. A., Ellis, R. S., Konidaris, N. P., & Stark, D. P. 2013, ApJ, 777, 67 Schenker, M. A., Robertson, B. E., Ellis, R. S., et al. 2013, ApJ, 768, 196 Schmidt, K. B., Treu, T., Brammer, G. B., et al. 2014, ApJL, 782, L36 Sharon, K., Gladders, M. D., Rigby, J. R., et al. 2012, ApJ, 746, 161 Smit, R., Bouwens, R. J., Labb´e, I., et al. 2014, ApJ, 784, 58
Sparre, M., Hayward, C. C., Feldmann, R., et al. 2017, MNRAS, 466, 88 Sparre, M., Hayward, C. C., Springel, V., et al. 2015, MNRAS, 447, 3548
Speagle, J. S., Steinhardt, C. L., Capak, P. L., & Silverman, J. D. 2014, ApJS, 214, 15 Stark, D. P., Schenker, M. A., Ellis, R., et al. 2013, ApJ, 763, 129
Straughn, A. N., Kuntschner, H., K¨ummel, M., et al. 2011, AJ, 141, 14 Tacchella, S., Dekel, A., Carollo, C. M., et al. 2016, MNRAS, 457, 2790 Torrey, P., Vogelsberger, M., Genel, S., et al. 2014, MNRAS, 438, 1985
Trebitsch, M., Blaizot, J., Rosdahl, J., Devriendt, J., & Slyz, A. 2017, MNRAS, 470, 224 Weisz, D. R., & Boylan-Kolchin, M. 2017, MNRAS, 469, L83
Weisz, D. R., Dolphin, A. E., Skillman, E. D., et al. 2014, ApJ, 789, 148 Weisz, D. R., Johnson, B. D., & Conroy, C. 2014, ApJL, 794, L3
Whitaker, K. E., van Dokkum, P. G., Brammer, G., & Franx, M. 2012, ApJL, 754, L29 Yue, B., Ferrara, A., Vanzella, E., & Salvaterra, R. 2014, MNRAS, 443, L20