HAL Id: hal-00298879
https://hal.archives-ouvertes.fr/hal-00298879
Submitted on 11 Sep 2007HAL is a multi-disciplinary open access
archive for the deposit and dissemination of sci-entific research documents, whether they are pub-lished or not. The documents may come from teaching and research institutions in France or abroad, or from public or private research centers.
L’archive ouverte pluridisciplinaire HAL, est destinée au dépôt et à la diffusion de documents scientifiques de niveau recherche, publiés ou non, émanant des établissements d’enseignement et de recherche français ou étrangers, des laboratoires publics ou privés.
The decreasing importance of acidification episodes with
recovery from acidification: an analysis of the 30-year
record from Birkenes, Norway
R. F. Wright
To cite this version:
R. F. Wright. The decreasing importance of acidification episodes with recovery from acidification: an analysis of the 30-year record from Birkenes, Norway. Hydrology and Earth System Sciences Discussions, European Geosciences Union, 2007, 4 (5), pp.2945-2973. �hal-00298879�
HESSD
4, 2945–2973, 2007 Acid episodes at Birkenes, Norway R. F. Wright Title Page Abstract Introduction Conclusions References Tables Figures ◭ ◮ ◭ ◮ Back CloseFull Screen / Esc
Printer-friendly Version Interactive Discussion
EGU
Hydrol. Earth Syst. Sci. Discuss., 4, 2945–2973, 2007 www.hydrol-earth-syst-sci-discuss.net/4/2945/2007/ © Author(s) 2007. This work is licensed
under a Creative Commons License.
Hydrology and Earth System Sciences Discussions
Papers published in Hydrology and Earth System Sciences Discussions are under open-access review for the journal Hydrology and Earth System Sciences
The decreasing importance of
acidification episodes with recovery from
acidification: an analysis of the 30-year
record from Birkenes, Norway
R. F. Wright
Norwegian Institute for Water Research, Gaustadall `een 21, 0349 Oslo, Norway
Received: 23 October 2006 – Accepted: 25 February 2007 – Published: 11 September 2007 Correspondence to: R. F. Wright ([email protected])
HESSD
4, 2945–2973, 2007 Acid episodes at Birkenes, Norway R. F. Wright Title Page Abstract Introduction Conclusions References Tables Figures ◭ ◮ ◭ ◮ Back CloseFull Screen / Esc
Printer-friendly Version Interactive Discussion
EGU Abstract
The 30-year record 1975–2004 of weekly samples of streamwater chemistry from Birkenes, Norway, shows 106 acid episodes below the threshold of ANC –50 µeq l−1.
The frequency, severity and duration of episodes have diminished since about 1990 due to chemical recovery following reduced deposition of sulphur. In particular SO4
-5
driven episodes in the first runoff following drought have become less intense and less frequent, whereas episodes driven by climate (wind, high flow) continue. The data show significant empirical relationships between strength of the driver, degree of chemical recovery, and severity of ANC depression.
1 Introduction
10
Long-term deposition of sulphur and nitrogen compounds from the atmosphere has caused widespread acidification of sensitive freshwaters (Overrein et al., 1980). Acid-ification is often characterised by chronic low pH and acid neutralising capacity (ANC) with elevated concentrations of inorganic aluminium species (Aln+). Superimposed on the chronic acidification are acid episodes, often defined as short-term decrease of pH
15
or ANC (Wigington et al., 1992). The acid episodes are of particular interest as they can cause acute biological damage, especially in streams. Episodes in lakes are less prominent because the volume of water in the lake damps the response to episodic inputs.
In Norway investigations of the causes of acid episodes began in the 1970s prompted
20
by a fish kill in association with snowmelt in 1975 (Leivestad and Muniz, 1976). Stud-ies were made of episodes caused by snowmelt (Skartveit and Gjessing, 1979; Jo-hannessen et al., 1980). Acid episodes during snowmelt have also been extensively investigated in streams in northern Sweden (Laudon and Bishop, 1999). Acid runoff fol-lowing summer drought has been studied in Norway (Christophersen et al., 1982) and
25
HESSD
4, 2945–2973, 2007 Acid episodes at Birkenes, Norway R. F. Wright Title Page Abstract Introduction Conclusions References Tables Figures ◭ ◮ ◭ ◮ Back CloseFull Screen / Esc
Printer-friendly Version Interactive Discussion
EGU
driven by seasalt deposition (Skartveit, 1982; Hindar et al., 1994). High discharge can also cause acid episodes (Mulder et al., 1995). In the late 1980s the United States En-vironmental Protection Agency (US EPA) conducted a comprehensive project (Episodic Response Project) on acid episodes in 13 streams in the northeastern United States (Wigington et al., 1996).
5
Since the mid-1980s deposition of S and N (mostly S) has decreased substantially in most parts of Europe and eastern North America as a result of national measures and international agreements to reduce the emissions of acid precursors (UNECE, 1999). Surface waters in these regions have begun to recover; chemical conditions have improved and in some cases biological recovery has been observed (Evans et
10
al., 2001; Skjelkv ˚ale et al., 2003).
The goals of this work are to (1) determine the dominant causes of acid episodes at Birkenes, (2) assess the role of climate as a driver of acid episodes, and (3) assess the changes in frequency, severity and duration of episodes during the process of recovery. The aim is to search for simple empirical relationships that can be used to predict the
15
severity and duration of episodes as the catchment recovers from acidification in the future. The analysis was carried out for the small catchment at Birkenes, Norway, which has a 30-year record of streamwater discharge and chemistry, bulk deposition volume and chemistry, and meteorological data from nearby stations.
2 Materials and methods
20
Birkenes is a 0.41-km2 coniferous-forested catchment located about 20 km from the south coast of Norway. The site is characterised by thin podsols and brown earth soils developed on patchy moraine of granitic mineralogy overlying biotite granite. The climate at Birkenes is maritime, with annual precipitation about 1400 mm and runoff about 1200 mm. Winters are often characterised by frequent snowmelt periods.
Depo-25
sition of seasalts at Birkenes is relatively high (1974–2004 mean bulk deposition of Cl 94 meq m−2yr−1) due to the proximity to the coast.
HESSD
4, 2945–2973, 2007 Acid episodes at Birkenes, Norway R. F. Wright Title Page Abstract Introduction Conclusions References Tables Figures ◭ ◮ ◭ ◮ Back CloseFull Screen / Esc
Printer-friendly Version Interactive Discussion
EGU
Birkenes has been a research and monitoring site since 1972 and is part of the Norwegian programme for monitoring long-range transported air pollution (SFT, 2006). Discharge is measured by the Norwegian Water Resources and Electricity Board with a level recorder and a V-notch weir and reduced to mean daily discharge. Starting July 1972 samples for determination of chemical composition of runoff have been taken
5
weekly (daily until December 1974) by the Norwegian Institute for Water Research (NIVA). No samples were collected in 1979 and 1984. Samples were analysed at NIVA for major ions using routine, accredited methods (SFT, 2006). Prior to May 1974 only pH, Ca, SO4and NO3plus either Na or Cl were determined, and thus ANC cannot be calculated for these samples. The record from July 1972–December 2004 comprises
10
2293 water chemistry samples.
Samples for volume and chemical composition of bulk precipitation and air were col-lected daily beginning July 1972 by the Norwegian Institute for Air Research (NILU) (Aas et al., 2004). Samples were analysed at NILU for major ions using routine, ac-credited methods. During the first years not all major ions were measured; Ca
mea-15
surements began in 1974, Na and K in 1986, and Cl in 1980.
Meteorological data came from nearby stations operated by the Norwegian Meteoro-logical Institute. Daily data for precipitation amount come from station 38450 Herefoss and for temperature from 39690 Byglandsfjord. These stations are located <20 km dis-tant and at approximately the same elevation as Birkenes. Derived parameters such as
20
Palmer drought index were kindly provided by the Norwegian Meteorological Institute. The ability of the weekly sampling interval to capture episodes was evaluated on the basis of the 2-year record of daily water chemistry determinations for several param-eters (July 1972–November 1974). The autocorrelation was computed for time lags of 1–30 days. Also the extreme value of each parameter (2nd or 98th percentile) was
25
calculated for subsets of the data comprising samples collected at 1–14 day intervals. ANC was used as the measure of acidification. ANC is a calculated parameter de-fined as the equivalent difference between sum of base cations (Ca+Mg+Na+K) minus sum of strong acid anions (SO4+Cl+ NO3) (Reuss and Johnson 1986). Changes in
HESSD
4, 2945–2973, 2007 Acid episodes at Birkenes, Norway R. F. Wright Title Page Abstract Introduction Conclusions References Tables Figures ◭ ◮ ◭ ◮ Back CloseFull Screen / Esc
Printer-friendly Version Interactive Discussion
EGU
ANC can thus be readily assigned to changes in concentrations of specific ions (Wig-ington et al., 1996). The concentrations of the various ions, especially the strong acid anions, are closely related to key sources and biogeochemical processes operating in soil and surface waters.
Relationships between ANC and discharge were based on daily mean discharge
5
measurement for the day of the chemical sample (generally once a week). Results were grouped into 5-year periods beginning with 1975. Because no samples were collected in 1979 and 1984, the periods 1975–1979 and 1980–1984 had data for only 4 years.
Acid episode was defined as a short-term decrease in ANC (Wigington et al., 1996).
10
This definition requires specification of an ANC threshold below which the episode oc-curs. A threshold of ANC <–50 µeq l−1 was used as the criterion for an episode at
Birkenes. This level was chosen such that the majority of the samples were above the threshold; it has no inherent biological significance. The operational definition of Wig-ington et al. (1996) was used to identify episodes relative to this threshold. Namely, the
15
start of an episode was taken as the date at which the ANC fell below –50 µeq l−1, the
duration as the number of weeks during which the ANC remained below –50 µeq l−1,
and the end of the episode as the date at which the last sample had ANC below – 50 µeq l−1. The severity of the episodes was classed relative to two further thresholds,
ANC <–75 and <–100 µeq l−1. The difference in ANC between the sample before the
20
episode and the minimum reached during the episode is termed “delta ANC”. Episodes with delta ANC <–5 µeq l−1were excluded.
Assignment of the major ion driver causing each episode was based on the differ-ence in concentration of major ions in the sample with minimum ANC measured during the episode minus the concentration in the sample collected immediately prior to the
25
onset of the episode. By definition a decrease in ANC must be due to decrease in one or more base cation or increase in one or more strong acid anion, or a combination of both. The individual ion contribution to each episode was calculated as a percentage. Each episode was assigned to one of four main drivers: direct influence of precipitation
HESSD
4, 2945–2973, 2007 Acid episodes at Birkenes, Norway R. F. Wright Title Page Abstract Introduction Conclusions References Tables Figures ◭ ◮ ◭ ◮ Back CloseFull Screen / Esc
Printer-friendly Version Interactive Discussion
EGU
(termed here “hydrology” and indicated by decrease in base cation concentrations, due mostly to a dilution of Ca), summer drought (SO4peak), snowmelt (SO4+ NO3peaks), and seasalt deposition (Cl peak). Much of the analysis followed the procedures used by (Evans et al., 2007).
3 Results
5
Autocorrelation with time lag of 1–30 days for the water samples collected daily in 1972–1974 showed that for the parameters pH, H+, SO4, NO3, and Ca the concen-trations were significantly correlated (95% confidence bounds) at time steps less than about 18 days. Discharge, on the other hand, was significantly autocorrelated only at time lags less than 5 days. For a 7-day time lag the correlation coefficients ranged
10
from 0.54 for H+ to 0.67 for SO4 and Ca, whereas only 0.13 for discharge. Also the 98th percentile concentration varied by less than 5% for sampling intervals of 14 days or less. These results indicate that weekly sampling is sufficient to capture episodes at Birkenes, and in particular the severe episodes of several weeks duration with large delta ANC. Weekly sampling, of course, is insufficient to detect the absolute minimum
15
ANC (or pH) during an episode.
The time series of ANC in runoff at Birkenes shows marked and at times frequent episodes of low ANC concurrent with peaks in the major four drivers (Fig. 1). The record also shows clear improvement in water quality from about 1990, with decreas-ing concentrations of SO4 and increasing ANC (Fig. 2). The minimum ANC recorded
20
during episodes has gradually increased in parallel with the general increase in mean ANC (Fig. 3). October 1993 was the last time ANC decreased to below –100 µeq l−1,
and November 2000 was the last time ANC decreased to below –75 µeq l−1. Over the
period 1975–2004 a total of 106 episodes with ANC <–50 µeq l−1 were identified, of
which 54 reached ANC <–75 µeq l−1 and 14 reached ANC <–100 µeq l−1.
25
High flow episodes. ANC typically drops during high discharge events. These episodes are characterised by dilution of base cations, mainly Ca. Ca comes
princi-HESSD
4, 2945–2973, 2007 Acid episodes at Birkenes, Norway R. F. Wright Title Page Abstract Introduction Conclusions References Tables Figures ◭ ◮ ◭ ◮ Back CloseFull Screen / Esc
Printer-friendly Version Interactive Discussion
EGU
pally from weathering of soil minerals and secondarily from atmospheric deposition; the volume-weighted mean concentration of Ca in runoff 1975–2003 was 45 µeq l−1,
whereas bulk precipitation had only 8 µeq l−1. The hypothesised mechanism is that
soil solution in the upper mostly organic soil layers has lower concentrations of base cations because of lower rates of chemical weathering relative to soil solution in the
5
lower mineral soil. At high flow a larger proportion of runoff comes from the base-cation poor upper soil, and in addition is diluted by Ca-poor precipitation (Christophersen et al., 1982).
Regressions of ANC on discharge for samples collected during 5-year time blocks yield significant relationships (p<0.001), with lower ANC at high flow (Table 1). The
10
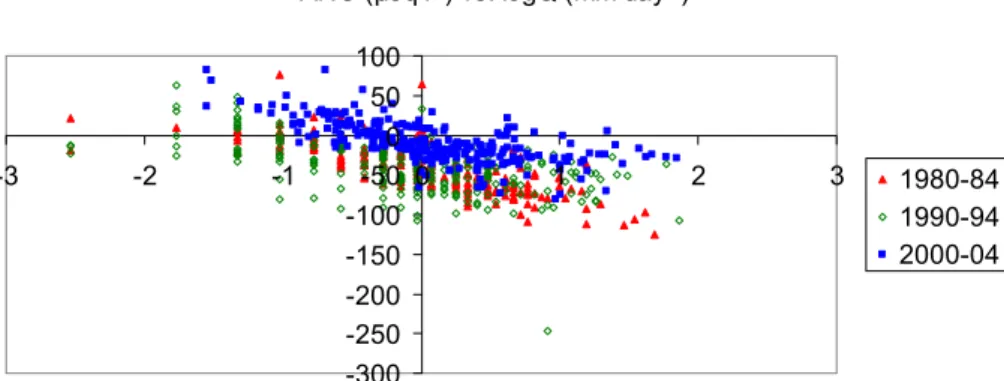
regression lines for successive 5-year blocks are roughly parallel but at slightly higher ANC (Fig. 4). ANC at high flow (98th-percentile) is higher in the period 2000–2004 relative to earlier periods (Fig. 5). The trend over time in ANC at high flow reflects the general recovery trend for annual volume-weighted mean ANC in runoff at Birkenes.
Grouping of the samples into those at low flow (Q below 25th percentile) and those at
15
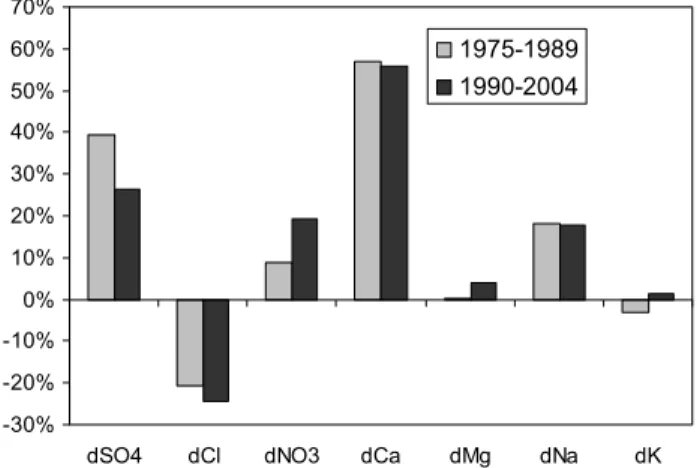
high flow (Q above 75th percentile) indicates that the lower ANC at high flow is mainly due to dilution; about half of the decrease can be accounted for by lower concentrations of Ca at high flow (Table 2, Fig. 6). This has apparently not changed significantly over time, although the role of SO4 is diminished in the later period because of lower concentrations of SO4in deposition and runoff.
20
Summer drought episodes. The first runoff following summer drought consistently has an elevated concentration of SO4 and a markedly lower ANC. The mechanism is probably the reduction of SO4 and storage as reduced S in anoxic parts of the soil during dry periods with the subsequent re-oxidation and flushing out of SO4 with the first runoff (Dillon et al., 1997). Acid cations (H+ and Aln+) comprise a fraction of the
25
accompanying cations and thus ANC decreases. At Birkenes the onset of autumn rain has been late August or September in most years.
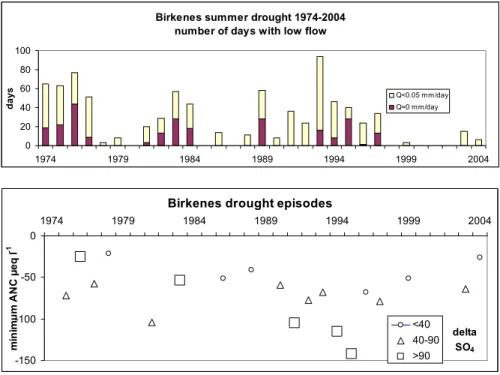
The discharge record for Birkenes shows three general periods of pronounced sum-mer drought: 1974–1977, 1981–1984, and 1989–1997 (Fig. 6). There have been no
HESSD
4, 2945–2973, 2007 Acid episodes at Birkenes, Norway R. F. Wright Title Page Abstract Introduction Conclusions References Tables Figures ◭ ◮ ◭ ◮ Back CloseFull Screen / Esc
Printer-friendly Version Interactive Discussion
EGU
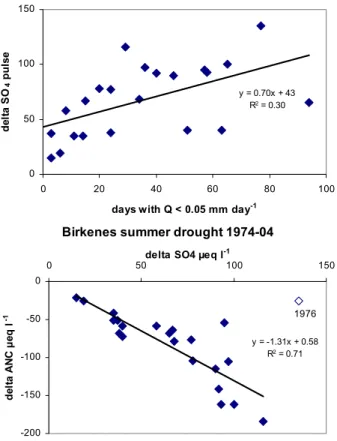
major droughts during the last 7 years of the record (1998–2004). The Palmer drought index for the nearby meteorological station also shows these three general periods of summer drought. The increase in SO4concentration in first runoff following the drought is a function of the severity of the drought (as indicated by the number of days with low flow). A linear least-squares regression model explains about 25% of the variance.
5
The decrease in ANC is correlated to the increase in SO4(Fig. 7).
The mean annual SO4concentration has decreased dramatically since about 1990. Whereas the severe droughts in the 1970s led to increase in SO4concentration in first runoff of 100–150 µeq l−1, droughts of similar magnitude in the 1990s led to increase
of only 40–60 µeq l−1. It is expected that with the continued decline in mean annual
10
SO4 concentration a severe drought in recent years would cause even less of a peak in SO4, but there have been no major droughts since 1997 and thus this could not be tested.
Snowmelt episodes. In many streams spring snowmelt is often the time of lowest ANC. The first meltwater contains a greatly disproportionate fraction of the dissolved
15
constituents stored in the snowpack (Johannessen and Henriksen, 1978). At sites receiving acid deposition, the first meltwater thus contains high concentrations of SO4 and to a lesser extent NO3. The subsequent phases of snowmelt cause dilution of runoff, especially of base cations derived from the soil such as Ca. Chemical changes during spring snowmelt have been extensively studied in northern Sweden (Laudon
20
and Bishop, 1999).
Because Birkenes lies near the south coast and experiences mild winters (for Nor-way). Mid-winter melting is usual, and thus development of a long-lasting snowpack rarely occurs. Over the 30-year period major spring snowmelt episodes occurred only 4 years. Mid-winter melting episodes were more common, but with much less
pro-25
nounced in chemical changes in runoff. The most pronounced spring snowmelt oc-curred in 1985 with peak in SO4and NO3concentrations in the first runoff followed by strong dilution as indicated by decrease in Ca concentration.
HESSD
4, 2945–2973, 2007 Acid episodes at Birkenes, Norway R. F. Wright Title Page Abstract Introduction Conclusions References Tables Figures ◭ ◮ ◭ ◮ Back CloseFull Screen / Esc
Printer-friendly Version Interactive Discussion
EGU
high deposition of seasalts to near coastal areas. Subsequent runoff has marked in-creases in concentrations of Cl and drop in ANC. The response is due to the differential mobility of Cl and Na, the major accompanying base cation. While Cl is quite mobile, Na participates in cation exchange reactions in the soil. A fraction of the Na (and also Mg) is exchanged for acid cations H+and Aln+ on the soil ion-exchange sites.
5
Due to its proximity to the coast, Birkenes is strongly influenced by seasalt deposi-tion. Volume-weighted mean concentration of Cl in runoff over the period 1974–2004 was 130 µeq l−1. Seasalt deposition is larger during the winter, due to higher frequency
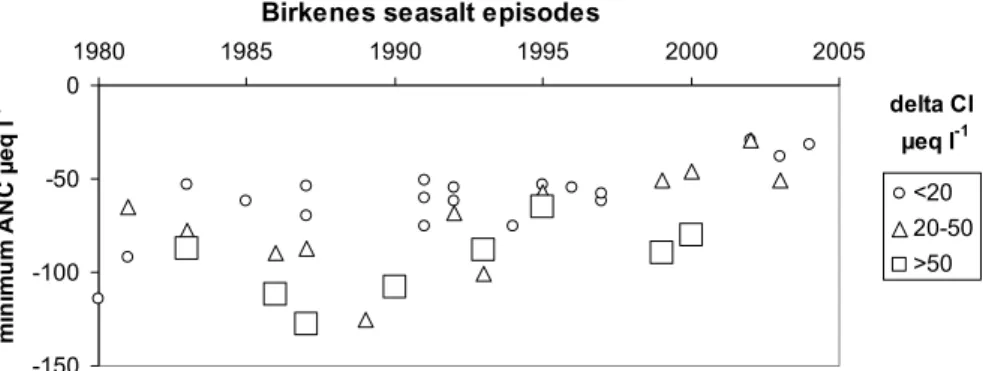
of storms. Seasalt deposition caused 34 of the 93 episodes in which ANC fell below the threshold of –50 µeq l−1 during the period 1980–2004. Particularly large seasalt
10
episodes occurred in October 1990, November 1990, January 1993 and November 2000. January 1993 had the highest deposition of seasalt of any month over the entire record from 1975–2004. At each of these four large seasalt episodes Cl concentrations in runoff increased by >80 µeq l−1.
During seasalt episodes the decrease in ANC is a function of the increase in Cl
15
(Fig. 9). Since the general ANC level has increased due to recovery since 1990, a seasalt episode of a given magnitude does not cause ANC to decrease to as low value as early in the record; relative to the ANC threshold of –50 µeq l−1 seasalt episodes
have become less severe (Fig. 9).
Summary of episode frequency, severity and cause. With the threshold of ANC
20
<–50 µeq l−1 there were 106 episodes during the period 1975–2004. The mean
num-ber of episodes per year was highest in the early 1980s (>6 per year) and since the mid-1990s has declined dramatically to <1 per year (Fig. 10). Also the severity and duration of the episodes has declined. The role of SO4in driving ANC depressions has diminished substantially since 1980 (Fig. 11).
HESSD
4, 2945–2973, 2007 Acid episodes at Birkenes, Norway R. F. Wright Title Page Abstract Introduction Conclusions References Tables Figures ◭ ◮ ◭ ◮ Back CloseFull Screen / Esc
Printer-friendly Version Interactive Discussion
EGU
4 Discussion
The data from Birkenes show that during periods of high flow streamwater is more acidic with lower ANC and higher concentrations of Aln+. The common explanation is that during periods of high flow a larger portion of runoff comes from the upper soil horizons, which have lower stores of base cations and thus lower ANC. In addition
5
high amounts of base cation-poor precipitation cause dilution of base cations in soil water, and the resulting runoff has lower ANC relative to baseflow. At Birkenes this was first modelled in the form of two soil boxes (Christophersen et al., 1982) and later interpreted as mixing of two end-members (precipitation and soil water) with differing water chemistry (Christophersen et al., 1990). A similar conclusion was reached by
10
(Laudon and Bishop 1999) for streams in northern Sweden. A review of acid episodes in Europe conducted by (Davies et al., 1992) concluded that changing flowpaths during hydrological-driven events are of overwhelming importance in determining the chemical character of runoff during episodes.
Acid pulses caused by peaks in SO4concentrations in the first runoff following
sum-15
mer drought were identified at Birkenes already in the 1970s, and readily simulated by a simple 2-box model (Christophersen and Wright, 1981). The mechanism was thought to be desorption of SO4in the upper soil horizons. Investigations of SO4 pulses after summer drought in eastern Ontario, Canada, however, showed that the phenomenon is likely caused by reduction of SO4in anoxic zones of wet soils and peatlands during
20
drought followed by oxidation and flushing of previously-reduced sulphur compounds in the first runoff (Dillon et al., 1997). Measurements of the stable isotope ratios of δ34S and δ18O in SO4 confirm that the SO4 released is from previously reduced S (Schiff et al., 2005). Further, at Plastic Lake in Ontario the wetland pool of reduced S has ap-parently not been depleted by droughts and is sufficient to cause drought-related SO4
25
events in the future (Eimers et al., 2006). This is apparently not the case at Birkenes, as the magnitude of the SO4 pulse following drought has diminished in recent years. The stored pool of reduced S is presumably smaller at Birkenes because most of the
HESSD
4, 2945–2973, 2007 Acid episodes at Birkenes, Norway R. F. Wright Title Page Abstract Introduction Conclusions References Tables Figures ◭ ◮ ◭ ◮ Back CloseFull Screen / Esc
Printer-friendly Version Interactive Discussion
EGU
catchment is comprised of well-drained forest soils. Drought-induced SO4 episodes have also been reported from northern Sweden (Laudon and Bishop, 2002).
Snowmelt commonly causes acid episodes in streams and lakes and spring snowmelt is usually the time of the year during which minimum pH levels are observed. Low pH and ANC are the result of first the preferential loss of pollutants from the
snow-5
pack in the first phases of melt (Johannessen and Henriksen, 1978; Johannessen et al., 1980) and then dilution by the ion-poor meltwater (Johannessen et al., 1980; Laudon and Bishop, 1999; Laudon et al.m 2000). Predicting the severity of snowmelt episodes is difficult, although factors such as the amount of acid pollutants stored in the snowpack, rapidity of the melting process and enhancement by rain on snow clear
10
exacerbate the acid depression (Johannessen et al., 1980; Laudon et al., 2000). Due to its proximity to the coast and low elevation, winters at Birkenes are relatively mild, with frequent mid-winter melting. Only during unusually cold winters does a deep and persistent snowpack accumulate. Over the 30-year period 1974–2004 a snowpack with major snowmelt in April occurred only in the mid-1980s. Midwinter melting, however,
15
caused ANC depression to <–50 µeq l−11–2 times a year during the 1980s and 1990s,
but since 2000 only 1 such episode has occurred.
Seasalt deposition is a major driver of episodic ANC depression at Birkenes. Ap-proximately one-third of all the ANC <50 µeq l−1episodes during the period 1980-2004
were driven primarily by seasalts (Fig. 10). A dramatic seasalt episode in January 1993
20
caused fish kill in several rivers in southernmost Norway (Hindar et al., 1994). Seasalt-driven acid episodes have been reported from coastal areas of eastern North America (Heath et al., 1992), Scotland (Langan, 1989) and Wales (Neal et al., 1988), and the cation-exchange mechanism has been experimentally demonstrated at the catchment scale (Wright et al., 1988).
25
In response to decreasing levels of sulphur and to a lesser extent nitrogen deposi-tion since the mid-1980s, the general level of acidificadeposi-tion at Birkenes has decreased. Volume-weighted annual average ANC levels have increased from <–70 µeq l−1to >–
HESSD
4, 2945–2973, 2007 Acid episodes at Birkenes, Norway R. F. Wright Title Page Abstract Introduction Conclusions References Tables Figures ◭ ◮ ◭ ◮ Back CloseFull Screen / Esc
Printer-friendly Version Interactive Discussion
EGU
Whereas in the early 1980s the majority of samples had ANC <–50 µeq l−1, since 2000
most of the samples have ANC >–25 µeq l−1(Fig. 1). SO
4is diminishing in importance
as a driver of acid episodes at Birkenes, in a similar fashion as found in northern Swe-den (Laudon and Bishop, 2002). The drivers high flow and seasalts, however, have not diminished in intensity, and thus caused acid episodes throughout the record, also in
5
recent years.
Several of the causes of acid episodes at Birkenes are clearly related to climate and independent of deposition of S and N compounds. Future changes in climate can affect the frequency and severity of episodes. The declining rate of SO4 deposition
presumably means that the pool of reduced S in the soil has decreased during recent
10
years and thus now there is a smaller pool available for oxidation during drought. But there has not been a major drought at Birkenes since 1997. Reduced S might be accumulating in the catchment and a severe acid episode might occur after the next major drought.
Seasalt deposition and seasalt-induced acid episodes are also clearly related to
cli-15
mate. Skartveit (1982) showed that the production rate of seaspray aerosols doubles with each 2 m s−1increase in surface wind. Future climate change may entail increased
frequency and severity of storms with both high wind and high amounts of precipitation. The statistical relationship between flow (Q) and minimum ANC can be used to pre-dict ANC depression given mean ANC and Q (Fig. 5). If future climate entails increased
20
frequency of storms with high precipitation, then high flow acid episodes can be ex-pected to become more frequent.
The role of NO3. A major source of major uncertainty seems to be NO3. During the 30-year record at Birkenes its role has apparently not changed. N deposition has not changed much, mean NO3 concentrations show no clear time trend (Fig. 1), and
25
the catchment retains >90% of the incoming N. Over the 30-years there have been several NO3peaks as large as 100 µeq l−1, certainly more than sufficient to drive ANC
depression well below the threshold of –50 µeq l−1. The NO
3 peaks were associated
HESSD
4, 2945–2973, 2007 Acid episodes at Birkenes, Norway R. F. Wright Title Page Abstract Introduction Conclusions References Tables Figures ◭ ◮ ◭ ◮ Back CloseFull Screen / Esc
Printer-friendly Version Interactive Discussion
EGU
such that runoff achieves mean ANC >0 µeq l−1, NO
3-driven episodes could potentially
cause ANC depressions below the threshold for biological damage. Furthermore, if future climate change entails a warmer climate, potentially stored N in the catchment soils could be released due to increased mineralisation of soil organic matter, as was found in the CLIMEX experiment conducted at Risdalsheia, about 10 km from Birkenes
5
(van Breemen et al., 1998; Wright, 1998).
Biological relevance. This analysis of episodes at Birkenes used the threshold of ANC –50 µeq l−1. This value was chosen simply to illustrate the effect of recovery
on the frequency and causes of episodes in the 30-year record. To have biological relevance the threshold must be much higher. A sustainable population of brown trout
10
in the Birkenes stream probably requires yearly ANC >0 µeq l−1. A survey of brown
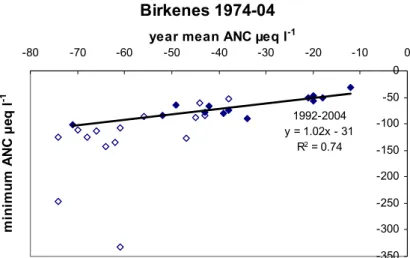
trout population status and ANC in about 1000 Norwegian lakes showed that at ANC 0 the probability of a sparse or good population was about 50% (Lien et al., 1996). The relationship between minimum ANC and mean ANC (Fig. 3) indicates that the threshold for biologically-damaging episodes at Birkenes probably should be above –30 µeq l−1.
15
Acknowledgements. This work was supported in part by the Eurolimpacs project (the
Commis-sion of European Communities GOCE-CT-2003-505540), the Research Council of Norway, the Norwegian State Pollution Control Authority, and the Norwegian Institute for Water Research. I thank Chris Evans (CEH) for inspiring this analysis, my colleagues at NIVA T. Larssen, J. Moe, B. L. Skjelkv ˚ale, and H. de Wit for helpful discussion, and T. Høg ˚asen (NIVA) for work with the
20
database.
Edited by: P. Dillon and R. F. Wright
References
25
Aas, W., Solberg, S., Berg, T., Manø, S., and Yttri, K. E.: Overv ˚aking av langtransportert forurenset luft og nedbør. Atmosfærisk tilførsel 2003. 903/2004, Statens forurensningstilsyn, Oslo, Norge, 2004.
HESSD
4, 2945–2973, 2007 Acid episodes at Birkenes, Norway R. F. Wright Title Page Abstract Introduction Conclusions References Tables Figures ◭ ◮ ◭ ◮ Back CloseFull Screen / Esc
Printer-friendly Version Interactive Discussion
EGU
Christophersen, N., Neal, C., Hooper, R. P., Vogt, R. D., and Andersen, S.: Modelling streamwa-ter chemistry as a mixture of soil wastreamwa-ter end-members; A step towards second generation acidification models, J. Hydrol., 116, 307–320, 1990.
Christophersen, N., Seip, H. M., and Wright, R. F.: A model for streamwater chemistry at Birkenes, Norway, Water Resour. Res., 18, 977–996, 1982
5
Christophersen, N. and Wright, R. F.: Sulfate budget and a model for sulfate concentrations in streamwater at Birkenes, a small forested catchment in southernmost Norway, Water Resour. Res., 17, 377–389, 1981.
Davies, T. D., Tranter, M., Wigington, P. J., and Eshleman, K. N..: “Acidic episodes” in surface waters in Europe, J. Hydrol., 132, 25–69, 1992.
10
Dillon, P. J., Molot, L. A., and Futter, M.: The effect of El Nino-related drought on the recovery of acidified lakes, Environ. Monit. Assess.t, 46, 105–111, 1997.
Eimers, M. C., Watmough, S. A., Buttle, J. M., and Dillon, P. J.: Drought-induced sulphate release from a wetland in south-central Ontario, Environ. Monit. Assess., 127, 399–407, 2007, 2007.
15
Evans, C., Reynolds, B., Hinton, C., Hughes, S., Norris, D., Grant, G., and Williams, B.: Effects of decreasing acid deposition and climate change on acid extremes in an upland stream, Hydrol. Earth Syst. Sci. Discuss., in press, 2007.
Evans, C. D., Cullen, J., Alewell, C., Kop ´acek, J., Marchetto, A., Moldan, F., Prechtel, A., Rogora, M., Vesel´y, J., and Wright, R. F.: Recovery from acidification in European surface
20
waters, Hydrol. Earth Syst. Sci., 5, 283–298, 2001,
http://www.hydrol-earth-syst-sci.net/5/283/2001/.
Heath, R. H., Kahl, J. S., Norton, S. A., and Fernandez, I. J.: Episodic acidification caused by the seasalt effect in coastal Maine streams, Water Resour. Res., 28, 1081–1088, 1992. Hindar, A., Henriksen, A., Tørseth, K., and Semb, A.: Acid water and fish death, Nature, 372,
25
327–328, 1994.
Johannessen, M. and Henriksen, A.: Chemistry of snowmelt water: changes in concentration during melting, Water Resour. Res., 14, 615–619, 1978.
Johannessen, M., Skartveit, A., and Wright, R. F.: Streamwater chemistry before, during and after snowmelt, 224–225, in: Ecological Impact of Acid Precipitation, edited by: Drabløs, D.
30
and Tollan, A., SNSF project, ˚As, Norway, 1980.
Langan, S. J.: Sea-salt induced streamwater acidification, Hydrol. Processes, 3, 25–41, 1989. Laudon, H. and Bishop, K.: Episodic stream water pH decline during autumn storms following
HESSD
4, 2945–2973, 2007 Acid episodes at Birkenes, Norway R. F. Wright Title Page Abstract Introduction Conclusions References Tables Figures ◭ ◮ ◭ ◮ Back CloseFull Screen / Esc
Printer-friendly Version Interactive Discussion
EGU
a summer drought in northern Sweden, Hydrol. Processes, 16, 1725–1733, 2000.
Laudon, H. and Bishop, K. H.: Quantifying sources of acid neutralisation capacity depression during spring flood episodes in northern Sweden, Environ. Pollut., 105, 427–435, 1999. Laudon, H. and Bishop, K. H.: The rapid and extensive recovery from episodic acidification
in northern Sweden due to declines in SO4-2 deposition, Geophys. Res. Lett., 29, 1594,
5
doi:10.1029/2001GL014211, 2002.
Laudon, H., Westling, O., and Bishop, K. H.: Cause of pH decline in stream water during spring melt runoff in northern Sweden, Can. J. Fisheries Aquatic Sci., 57, 1888–1900, 2000. Leivestad, H. and Muniz, I. P.: Fish kill at low pH in a Norwegian river, Nature, 259, 391–392,
1976.
10
Lien, L., Raddum, G. G., Fjellheim, A., and Henriksen, A.: A critical limit for acid neutraliz-ing capacity in Norwegian surface waters, based on new analyses of fish and invertebrate responses, Sci. Total Environ., 177, 173–193, 1996.
Mulder, J., Christophersen, N., Kopperud, K., and Fjeldal, P. H.: Water flow paths and the spatial distribution of soils as a key to understanding differences in streamwater chemistry
15
between three catchments (Norway), Water, Soil Air Pollut., 81, 67–91, 1995.
Neal, C., Christophersen, N., Neal, R., Smith, C. J., Whitehead, P. G., and Reynolds, B.: Chlo-ride in precipitation and streamwater for the upland catchment of river Severn, mid-Wale; some consequences for hydrochemical models, Hydrol. Processes, 2, 155–165, 1988. Overrein, L., Seip, H. M., and Tollan, A.: Acid precipitation - Effects on forest and fish. Final
20
report of the SNSF-project 1972–1980. FR 19-80, SNSF project, ˚As, Norway, 1980.
Reuss, J. O., and Johnson, D. W.: Acid Deposition and the Acidification of Soils and Waters. Springer Verlag, New York, 1986.
Schiff, S. L., Spoelstra, J., Semkin, R. G., and Jeffries, D. S.: Drought induced pulses of SO2−4
from a Canadian shield wetland: use of δ34S and δ18O in SO2−4 to determine sources of
25
sulfur, Appl. Geochem., 20, 691–700, 2005.
SFT: The Norwegian monitoring programme for long-range transported air pollutants. Annual report – Effects 2005. TA-2205/2006, The Norwegian Pollution Control Authority (SFT), Oslo, 2006.
Skartveit, A.: Wet scavenging of sea-salts and acid compounds in a rainy coastal area, Atmos.
30
Environ., 16, 2715–2724, 1982.
Skartveit, A. and Gjessing, Y. T.: Chemical budgets and chemical quality of snow and runoff during spring snowmelt, Nordic Hydrol., 10, 141–154, 1979.
HESSD
4, 2945–2973, 2007 Acid episodes at Birkenes, Norway R. F. Wright Title Page Abstract Introduction Conclusions References Tables Figures ◭ ◮ ◭ ◮ Back CloseFull Screen / Esc
Printer-friendly Version Interactive Discussion
EGU
Skjelkv ˚ale, B. L., Evans, C. D., Larssen, T., Hindar, A., and Raddum, G. G.: Recovery from acidification in European surface waters: A view to the future, Ambio, 30, 170–175, 2003. UNECE: The 1999 Protocol to Abate Acidification, Eutrophication and Ground-level Ozone.
Document ECE/EB.AIR, United nations Economic Commission for Europe, New York and Geneva, 1999.
5
van Breemen, N., Jenkins, A., Wright, R. F., Arp, W. J., Beerling, D. J., Berendse, F., Beier, C., Collins, R., van Dam, D., Rasmussen, L., Verburg, P. S. J., and Wills, M. A.: Impacts of elevated carbon dioxide and temperature on a boreal forest ecosystem (CLIMEX project), Ecosystems, 1, 345–351, 1998.
Wigington, P. J., Davies, T. D., Tranter, M., and Eshleman, K. N.: Comparison of episodic
10
acidification in Canada, Europe and the United States, Environ. Pollut., 78, 29–35, 1992 Wigington, P. J., DeWalle, D. R., Murdoch, P. S., Kretser, W. A., Simonin, H. A., Van Sickle, J.,
and Baker, J. P.: Episodic acidification of small streams in the northeastern United States: ionic controls of episodes, Ecol. Appl., 6, 389–407, 1996.
Wright, R. F.: Effect of increased CO2and temperature on runoff chemistry at a forested
catch-15
ment in southern Norway (CLIMEX project), Ecosystems, 1, 216–225, 1998.
Wright, R. F., Norton, S. A., Brakke, D. F., and Frogner, T.: Experimental verification of episodic acidification of freshwaters by sea salts, Nature, 334, 422–424, 1998.
HESSD
4, 2945–2973, 2007 Acid episodes at Birkenes, Norway R. F. Wright Title Page Abstract Introduction Conclusions References Tables Figures ◭ ◮ ◭ ◮ Back CloseFull Screen / Esc
Printer-friendly Version Interactive Discussion
EGU
Table 1. Linear regression of ANC (µeq l−1) on log discharge (mm/day) for samples collected
during 5-year time blocks at Birkenes. n = number of samples. All regressions are significant at p<0.001 level.
period n slope intercept r2 1975-79 215 –21.4 –23.2 0.32 19801984 190 –35.9 –37.4 0.37 1985–1989 238 –28.1 –40.2 0.23 1990–1994 245 –23.2 –42.9 0.32 1995–1999 257 –19.3 –24.2 0.25 2000–2003 210 –29.1 –7.5 0.45
HESSD
4, 2945–2973, 2007 Acid episodes at Birkenes, Norway R. F. Wright Title Page Abstract Introduction Conclusions References Tables Figures ◭ ◮ ◭ ◮ Back CloseFull Screen / Esc
Printer-friendly Version Interactive Discussion
EGU
Table 2.Arithmetic mean concentrations of ions (µeq l−1) contributing to ANC in runoff samples
at low flow (<25th percentile) and high flow (>75th percentile) collected at Birkenes. The data are split into two periods: 1975–1989 and 1990–2003.
SO4 Cl NO3 Ca Mg Na K ANC
Mean chemistry (all data)
1975–1989 130.9 117.7 8.4 68.8 36.4 116.5 6.7 –28.7 1990–2003 88.8 136.4 8.5 50.3 27.0 128.9 3.9 –23.5 Mean low flow chemistry
1975–1989 120.6 122.4 5.7 82.9 36.1 120.8 6.9 –2.0 1990–2003 78.1 140.0 3.7 63.6 27.6 132.1 4.4 5.8 Mean high flow chemistry
1975–1989 139.0 112.7 9.9 56.3 35.9 112.3 8.5 –48.6 1990–2003 89.7 130.7 11.4 38.7 25.6 123.6 4.0 –39.9 Mean high flow minus low flow chemistry
∆SO4 ∆Cl ∆NO3 ∆Ca ∆Mg ∆Na ∆K ∆ANC
1975–1989 18.4 –9.7 4.2 –26.6 –0.2 –8.5 1.5 –46.7 1990–2003 11.6 –9.3 7.7 –24.8 –2.0 –8.5 –0.4 –45.7
HESSD
4, 2945–2973, 2007 Acid episodes at Birkenes, Norway R. F. Wright Title Page Abstract Introduction Conclusions References Tables Figures ◭ ◮ ◭ ◮ Back CloseFull Screen / Esc
Printer-friendly Version Interactive Discussion EGU -150 -100 -50 0 50 100 72 77 82 88 93 99 04 µ e q l -1 ANC 0 50 100 150 200 250 300 72 77 82 88 93 99 04 µ e q l -1 SO4 0 20 40 60 80 100 120 72 77 82 88 93 99 04 µ e q l -1 NO3 0 50 100 150 200 250 300 350 72 77 82 88 93 99 04 µ e q l -1 Cl 0 10 20 30 40 50 60 70 80 72 77 82 88 93 99 04 m m d a y -1 discharge 439 440
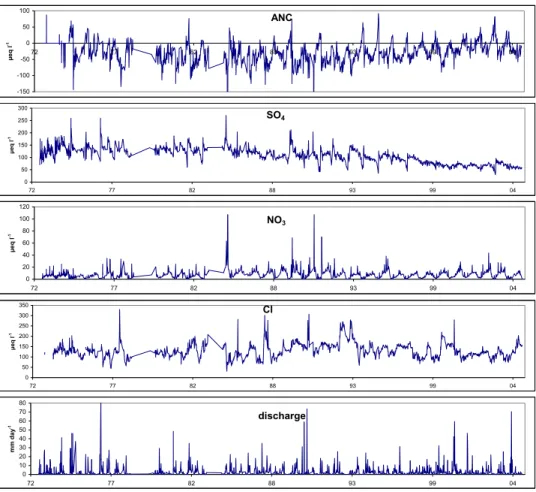
441 Figure 1. ANC, concentrations of SO , NO , and Cl and discharge of streamwater at
Fig. 1. ANC, concentrations of SO4, NO3, and Cl and discharge of streamwater at Birkenes,
Norway, over the period 1972–2004. Data for the years 1979 and 1984 are lacking; measure-ments for several of the major ions are lacking for samples collected prior to 1975.
HESSD
4, 2945–2973, 2007 Acid episodes at Birkenes, Norway R. F. Wright Title Page Abstract Introduction Conclusions References Tables Figures ◭ ◮ ◭ ◮ Back CloseFull Screen / Esc
Printer-friendly Version Interactive Discussion
EGU
Birkenes streamwater ANC
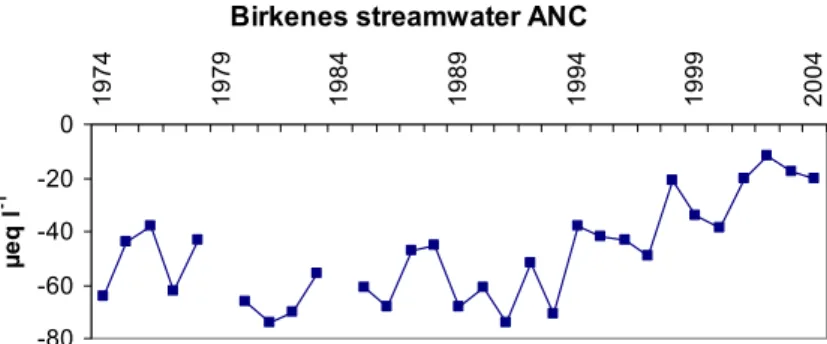
-80 -60 -40 -20 0 1 9 7 4 1 9 7 9 1 9 8 4 1 9 8 9 1 9 9 4 1 9 9 9 2 0 0 4 µ e q l -1 445
446 Figure 2. Volume-weighted annual average ANC (µeq l-1) in runoff at Birkenes 1974-2004.
HESSD
4, 2945–2973, 2007 Acid episodes at Birkenes, Norway R. F. Wright Title Page Abstract Introduction Conclusions References Tables Figures ◭ ◮ ◭ ◮ Back CloseFull Screen / Esc
Printer-friendly Version Interactive Discussion EGU Birkenes 1974-04 1992-2004 y = 1.02x - 31 R2 = 0.74 -350 -300 -250 -200 -150 -100 -50 0 -80 -70 -60 -50 -40 -30 -20 -10 0
year mean ANC µeq l-1
m in im u m A N C µ e q l -1
Fig. 3.Relationship between mean volume-weighted yearly ANC and minimum ANC (µeq l−1)
HESSD
4, 2945–2973, 2007 Acid episodes at Birkenes, Norway R. F. Wright Title Page Abstract Introduction Conclusions References Tables Figures ◭ ◮ ◭ ◮ Back CloseFull Screen / Esc
Printer-friendly Version Interactive Discussion
EGU
ANC (µeq l-1) vs. logQ (mm day-1)
-300 -250 -200 -150 -100 -50 0 50 100 -3 -2 -1 0 1 2 3 1980-84 1990-94 2000-04 453
Fig. 4.Scatter plot of ANC (µeq l−1) on log discharge (mm day−1) for samples from three 5-year
HESSD
4, 2945–2973, 2007 Acid episodes at Birkenes, Norway R. F. Wright Title Page Abstract Introduction Conclusions References Tables Figures ◭ ◮ ◭ ◮ Back CloseFull Screen / Esc
Printer-friendly Version Interactive Discussion
EGU
Birkenes ANC at extreme flow
-100 -80 -60 -40 -20 0 20 40 75-79 80-84 85-89 90-94 95-99 00-04 A N C µ e q l -1 Flow 10th Flow 25th Flow 50th Flow 75th Flow 90th Flow 98th 458
Fig. 5.ANC at various levels of discharge (percentiles of distribution of Q) for samples collected
during 5-year intervals at Birkenes. Shown are values obtained from linear regressions of ANC on log Q. Bold line indicates ANC expected at high flow (98th percentile).
HESSD
4, 2945–2973, 2007 Acid episodes at Birkenes, Norway R. F. Wright Title Page Abstract Introduction Conclusions References Tables Figures ◭ ◮ ◭ ◮ Back CloseFull Screen / Esc
Printer-friendly Version Interactive Discussion EGU -30% -20% -10% 0% 10% 20% 30% 40% 50% 60% 70%
dSO4 dCl dNO3 dCa dMg dNa dK
1975-1989 1990-2004
Fig. 6.Contribution of individual ions to decrease in ANC between low flow and high flow (25th
and 75th percentile, respectively) in runoff samples collected in 1975–1989 and 1990–2004 at Birkenes.
HESSD
4, 2945–2973, 2007 Acid episodes at Birkenes, Norway R. F. Wright Title Page Abstract Introduction Conclusions References Tables Figures ◭ ◮ ◭ ◮ Back CloseFull Screen / Esc
Printer-friendly Version Interactive Discussion
EGU Birkenes summer drought 1974-2004
number of days with low flow
0 20 40 60 80 100 1974 1979 1984 1989 1994 1999 2004 d a y s Q<0.05 mm/day Q=0 mm/day 470
Birkenes drought episodes
-150 -100 -50 0 1974 1979 1984 1989 1994 1999 2004 m in im u m A N C µ e q l -1 <40 40-90 >90 delta SO4 471
472 Figure 7. Birkenes summer droughts. Upper panel: number of days with low flow each year.
Fig. 7. Birkenes summer droughts. Upper panel: number of days with low flow each year.
Dark colour: 0 mm/day; light colour: <0.05 mm/day. Mean daily discharge is about 3.3 mm/day. Lower panel: Minimum ANC reached in the first runoff following drought, grouped by change in SO4concentration (delta = after – before). The size and shape of the symbols denote the magnitude of SO4increase.
HESSD
4, 2945–2973, 2007 Acid episodes at Birkenes, Norway R. F. Wright Title Page Abstract Introduction Conclusions References Tables Figures ◭ ◮ ◭ ◮ Back CloseFull Screen / Esc
Printer-friendly Version Interactive Discussion
EGU
Birkenes drought episodes 1974-04
y = 0.70x + 43 R2 = 0.30 0 50 100 150 0 20 40 60 80 100
days with Q < 0.05 mm day-1
d e lt a S O 4 p u ls e
478
00Birkenes summer drought 1974-04
y = -1.31x + 0.58 R2 = 0.71 -200 -150 -100 -50 0 0 50 100 150
delta SO4 µeq l-1
d e lt a A N C µ e q l -1 1976
Fig. 8. Summer drought episodes at Birkenes (one per year, but not all years experienced
drought). Left panel: Magnitude of the increase in SO4 concentration in first runoff following
drought (delta SO4pulse) in relation to the severity of the drought (indicated by number of days
with flow <0.05 mm/day). Right panel: Magnitude of the decrease in ANC in relation to the increase in SO4(year 1976 is excluded from the regression).
HESSD
4, 2945–2973, 2007 Acid episodes at Birkenes, Norway R. F. Wright Title Page Abstract Introduction Conclusions References Tables Figures ◭ ◮ ◭ ◮ Back CloseFull Screen / Esc
Printer-friendly Version Interactive Discussion
EGU
Birkenes seasalt episodes
-150 -100 -50 0 1980 1985 1990 1995 2000 2005 m in im u m A N C µ e q l -1 <20 20-50 >50 delta Cl µeq l-1
Fig. 9. Seasalt episodes at Birkenes 1980–2004 showing minimum ANC reached during the
episodes, grouped by change in Cl concentration (delta = after – before). The size and shape of the symbols denote the magnitude of Cl increase.
HESSD
4, 2945–2973, 2007 Acid episodes at Birkenes, Norway R. F. Wright Title Page Abstract Introduction Conclusions References Tables Figures ◭ ◮ ◭ ◮ Back CloseFull Screen / Esc
Printer-friendly Version Interactive Discussion
EGU Birkenes frequency of episodes
0 1 2 3 4 5 6 7 1975-79 1980-84 1985-89 1990-94 1995-99 2000-04 n u m b e r p e r y e a r < -50 < -75 < -100 ANC µeq l-1
493 Birkenes mean duration of episodes
0 1 2 3 4 5 6 7 8 1975-79 1980-84 1985-89 1990-94 1995-99 2000-04 w e e k s < -50 < -75 < -100 ANC µeq l-1
494 Birkenes mean number of weeks per year below threshold
0 2 4 6 8 10 12 14 1975-79 1980-84 1985-89 1990-94 1995-99 2000-04 w e e k s < -50 < -75 < -100 ANC µeq l-1 495
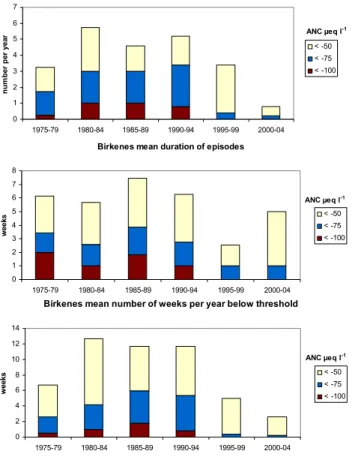
Fig. 10. Summary of episodes with threshold ANC <–50 µeq l−1 at Birkenes 1975–2004 by
5-year period. Upper panel: mean frequency of episodes; middle panel: mean duration of episode; lower panel: mean number of weeks per year below threshold.
HESSD
4, 2945–2973, 2007 Acid episodes at Birkenes, Norway R. F. Wright Title Page Abstract Introduction Conclusions References Tables Figures ◭ ◮ ◭ ◮ Back CloseFull Screen / Esc
Printer-friendly Version Interactive Discussion
EGU
Birkenes main driver of episodes ANC < -50 µeq l-1
0 2 4 6 8 10 12 14 1975-79 1980-84 1985-89 1990-94 1995-99 2000-04 n u m b e r in p e ri o d drought seasalts nitrogen high flow 500