HAL Id: hal-01829384
https://hal.archives-ouvertes.fr/hal-01829384
Submitted on 4 Jul 2018
HAL is a multi-disciplinary open access
archive for the deposit and dissemination of
sci-entific research documents, whether they are
pub-lished or not. The documents may come from
teaching and research institutions in France or
abroad, or from public or private research centers.
L’archive ouverte pluridisciplinaire HAL, est
destinée au dépôt et à la diffusion de documents
scientifiques de niveau recherche, publiés ou non,
émanant des établissements d’enseignement et de
recherche français ou étrangers, des laboratoires
publics ou privés.
South Pacific
Nicholas Bock, France van Wambeke, Moïra Dion, Solange Duhamel
To cite this version:
Nicholas Bock, France van Wambeke, Moïra Dion, Solange Duhamel. Microbial community structure
in the western tropical South Pacific. Biogeosciences, European Geosciences Union, 2018, 15 (12),
pp.3909-3925. �10.5194/bg-15-3909-2018�. �hal-01829384�
https://doi.org/10.5194/bg-15-3909-2018 © Author(s) 2018. This work is distributed under the Creative Commons Attribution 4.0 License.
Microbial community structure in the western
tropical South Pacific
Nicholas Bock1, France Van Wambeke2, Moïra Dion3, and Solange Duhamel1
1Lamont-Doherty Earth Observatory, Division of Biology and Paleo Environment, Columbia University,
P.O. Box 1000, 61 Route 9W, Palisades, New York 10964, USA
2Aix-Marseille Université, CNRS, Université de Toulon, IRD, OSU Pythéas, Mediterranean Institute of
Oceanography (MIO), UM110, 13288, Marseille, France
3Département de biochimie, de microbiologie et de bio-informatique, Faculté des sciences et de génie,
Université Laval, 2325, rue de l’Université, Québec (QC), G1V 0A6, Canada Correspondence: Nicholas Bock ([email protected])
Received: 29 December 2017 – Discussion started: 7 February 2018 Revised: 10 May 2018 – Accepted: 8 June 2018 – Published: 29 June 2018
Abstract. Oligotrophic regions play a central role in global biogeochemical cycles, with microbial communities in these areas representing an important term in global carbon bud-gets. While the general structure of microbial communities has been well documented in the global ocean, some remote regions such as the western tropical South Pacific (WTSP) remain fundamentally unexplored. Moreover, the biotic and abiotic factors constraining microbial abundances and dis-tribution remain not well resolved. In this study, we quanti-fied the spatial (vertical and horizontal) distribution of ma-jor microbial plankton groups along a transect through the WTSP during the austral summer of 2015, capturing impor-tant autotrophic and heterotrophic assemblages including cy-tometrically determined abundances of non-pigmented pro-tists (also called flagellates). Using environmental parame-ters (e.g., nutrients and light availability) as well as statistical analyses, we estimated the role of bottom–up and top–down controls in constraining the structure of the WTSP microbial communities in biogeochemically distinct regions. At the most general level, we found a “typical tropical structure”, characterized by a shallow mixed layer, a clear deep chloro-phyll maximum at all sampling sites, and a deep nitracline. Prochlorococcuswas especially abundant along the transect, accounting for 68 ± 10.6 % of depth-integrated phytoplank-ton biomass. Despite their relatively low abundances, pico-phytoeukaryotes (PPE) accounted for up to 26 ± 11.6 % of depth-integrated phytoplankton biomass, while Synechococ-cusaccounted for only 6 ± 6.9 %. Our results show that the
microbial community structure of the WTSP is typical of highly stratified regions, and underline the significant con-tribution to total biomass by PPE populations. Strong re-lationships between N2 fixation rates and plankton
abun-dances demonstrate the central role of N2 fixation in
reg-ulating ecosystem processes in the WTSP, while compara-tive analyses of abundance data suggest microbial commu-nity structure to be increasingly regulated by bottom–up pro-cesses under nutrient limitation, possibly in response to shifts in abundances of high nucleic acid bacteria (HNA).
1 Introduction
Subtropical oligotrophic gyres, accounting for 45 % of global ocean area, represent one of the earth’s largest biomes (Sarmiento et al., 2004). Despite reduced productivity com-pared to coastal regions, these nutrient-limited ecosystems are estimated to account for nearly one-quarter of annual net marine primary production (Field, 1998). Therefore, it is of central importance to understand the factors shaping microbial communities in these regions, and to account for how these factors might vary seasonally and geographically between the ocean’s major oligotrophic regions. There has been a great deal of progress toward this goal over the last three decades. The groups of phytoplankton that numerically dominate the open ocean – Prochlorococcus, Synechococcus, and picophytoeukaryotes (PPE) – are of a small size,
gener-ally < 2 µm, with the most abundant group, Prochlorococcus, identified in the late 1980s (Chisholm et al., 1988). Since then, the widespread use of flow cytometry to characterize microbial communities has led to the publication of numer-ous studies documenting the distribution of these organisms (Veldhuis and Kraay, 2000). Especially over the last 10 years, molecular methodologies have allowed for the characteriza-tion of these groups at the taxon or species level, revealing enormous diversity across all trophic levels of marine micro-bial communities and identifying numerous ecotypes occu-pying distinct ecological niches (Carlson et al., 2007; Venter et al., 2004). More recently, environmental sequencing has revealed a surprising diversity of small-sized PPE and new eukaryotic lineages continue to be discovered and character-ized (Kashtan et al., 2014; Kim et al., 2016; Lepère et al., 2009; Rii et al., 2016a), while also revealing the importance of viruses in regulating phytoplankton communities (Brum et al., 2015; Huang et al., 2015).
However, the role of physical and biogeochemical pro-cesses in shaping microbial communities in the oligotrophic ocean remains unclear. While some general in situ trends are apparent – for example the predominance of Synechococ-cusand PPE in nutrient-rich waters and the predominance of Prochlorococcus in nutrient-depleted regions – spatial and temporal variability provides significant challenges to the generalization of these patterns at a global level (Fuhrman, 2009). And while there are accounts of microbial commu-nity structure in oligotrophic regions of the North Atlantic (Partensky et al., 1996) and North Pacific (Campbell and Vaulot, 1993; Karl, 1999), as well as for the Mediterranean (Denis et al., 2010) and Arabian (Campbell et al., 1998) seas, the South Pacific remains less well documented. Al-though there are three reports on the distribution of bac-teria, Prochlorococcus, Synechococcus and PPE abundance and biomass in the oligotrophic subtropical southeastern Pa-cific (Grob et al., 2007a, b; Lepère et al., 2009), and two papers describing cell abundance distribution of Prochloro-coccus, Synechococcus and PPE in the southwestern Pacific near New Caledonia (Blanchot and Rodier, 1996; Tenório et al., 2018), there are no reports on community structure in the oligotrophic regions of the western tropical South Pacific (WTSP). Moreover, despite their crucial role as grazers of microbial plankton, small-sized heterotrophic protists (i.e., non-pigmented cells between ∼ 2 and 5 µm, hereafter HNF), also called flagellates, have received little attention (Chris-taki et al., 2011). Although there have been an increasing number of reports focusing on their role as predators over the last couple of decades, HNF are not routinely measured and their distribution relative to other microbial groups is not well constrained (Christaki et al., 2011).
In this study, we present an account of microbial plankton community structure during late austral summer in distinct biogeochemical regions of the WTSP, ranging from mesotro-phy to ultraoligotromesotro-phy. Our primary goal is to document the microbial community structure in the region, based on
flow cytometry data capturing bacterioplankton (low-DNA content, LNA, and high-DNA content, HNA), phytoplank-ton (Prochlorococcus, Synechococcus and PPE) and HNF groups. In addition, we describe the dominant biogeochemi-cal gradients observed along the cruise transect, and attempt to identify the physical and ecological variables influencing the abundance and distribution of plankton groups in the re-gion. We also compare several previously published empir-ical models that make use of bacteria and HNF abundances to evaluate trophic interactions between populations of het-erotrophic plankton groups.
2 Material and methods 2.1 Field sampling
A zonal characterization of the biogeochemistry and biolog-ical diversity of the western tropbiolog-ical South Pacific (WTSP) was conducted along trophic gradients during the OUTPACE cruise (Oligotrophy to UlTra-oligotrophy PACific Exper-iment, https://doi.org/10.17600/15000900, RV L’Atalante, February–April 2015) between New Caledonia and Tahiti (Moutin et al., 2017). To describe the longitudinal and ver-tical distribution of different groups of pico- and nano-plankton, we sampled 15 short-duration stations (SD1 to SD15, occupied during 8 h, Fig. 1). Three long-duration sta-tions (LDA, LDB, and LDC, occupied during 7 days), cho-sen for their contrasted biogeochemical conditions (Table 1), were sampled in Lagrangian mode (de Verneil et al., 2017). In keeping with Moutin et al. (2017), stations sampling the waters of the Melanesian Archipelago (SD1 to SD12 and LDA) were classified as MA, while stations sampling the western South Pacific Gyre (SD13 to SD15 and LDC) were classified as GY. Long-duration station B was in the late stages of a phytoplankton bloom at the time of sampling (de Verneil et al., 2018). As such, the station was analyzed independently of other stations on the transect, and is simply referred to as LDB. All stations were sampled at 12 different depths from the surface down to 200 m for microbial char-acterization of the extended photic layer. The photic layer Ze(m) is defined as the sunlit layer of the water column
be-tween the surface and the depth where irradiance is reduced to 0.1 % of its surface value.
2.2 Pico- and nano-plankton analyses
For cell enumeration, duplicate 1.8 mL samples were fixed (0.25 % electron microscopy grade paraformaldehyde, w/v) for 10–15 min at room temperature and in the dark, flash-frozen in liquid nitrogen and stored at −80◦C for later anal-ysis using a BD Influx flow cytometer (BD Biosciences, San Jose, CA, USA). Pigmented groups, Prochlorococcus, Synechococcusand PPE, were enumerated in unstained sam-ples for 5 min at ∼ 61 µL min−1. Bacteria were discriminated in a sample aliquot stained with SYBR Green I DNA dye
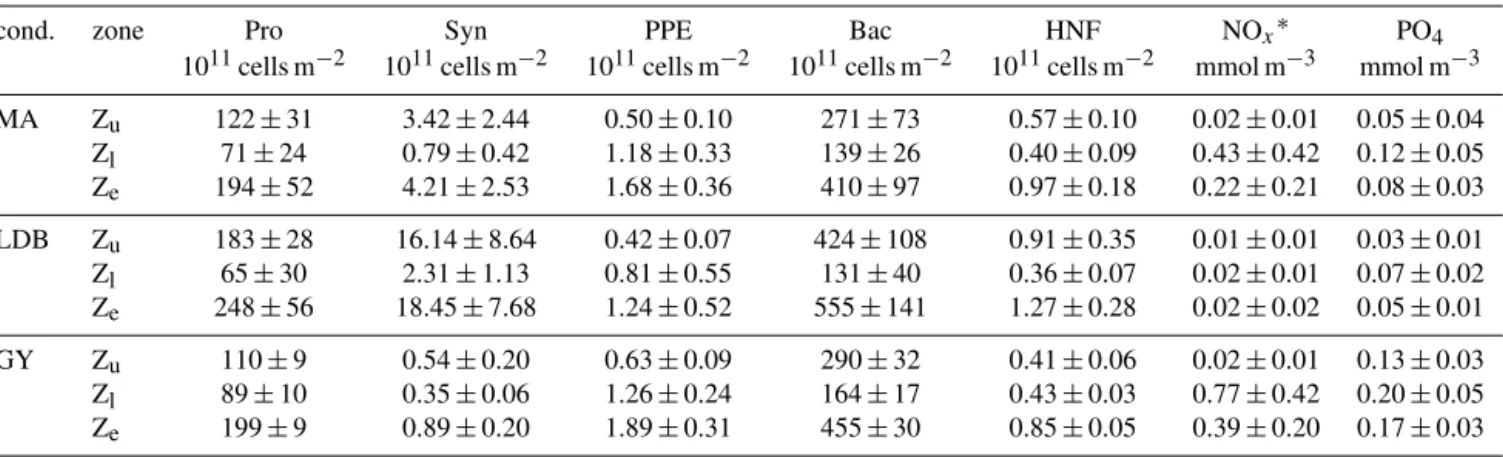
Table 1. Summary of average depth-integrated abundances for Prochlorococcus (Pro), Synechococcus (Syn), picophytoeukaryotes (PPE), and bacteria (Bac), in addition to depth-normalized values of nutrient concentrations (NOxand PO4), for different vertical zones (Zu, Zland
Ze) and for individual biogeochemical conditions (cond.: MA, LDB, and GY).∗NO2+NO3.
cond. zone Pro Syn PPE Bac HNF NOx∗ PO4
1011cells m−2 1011cells m−2 1011cells m−2 1011cells m−2 1011cells m−2 mmol m−3 mmol m−3 MA Zu 122 ± 31 3.42 ± 2.44 0.50 ± 0.10 271 ± 73 0.57 ± 0.10 0.02 ± 0.01 0.05 ± 0.04 Zl 71 ± 24 0.79 ± 0.42 1.18 ± 0.33 139 ± 26 0.40 ± 0.09 0.43 ± 0.42 0.12 ± 0.05 Ze 194 ± 52 4.21 ± 2.53 1.68 ± 0.36 410 ± 97 0.97 ± 0.18 0.22 ± 0.21 0.08 ± 0.03 LDB Zu 183 ± 28 16.14 ± 8.64 0.42 ± 0.07 424 ± 108 0.91 ± 0.35 0.01 ± 0.01 0.03 ± 0.01 Zl 65 ± 30 2.31 ± 1.13 0.81 ± 0.55 131 ± 40 0.36 ± 0.07 0.02 ± 0.01 0.07 ± 0.02 Ze 248 ± 56 18.45 ± 7.68 1.24 ± 0.52 555 ± 141 1.27 ± 0.28 0.02 ± 0.02 0.05 ± 0.01 GY Zu 110 ± 9 0.54 ± 0.20 0.63 ± 0.09 290 ± 32 0.41 ± 0.06 0.02 ± 0.01 0.13 ± 0.03 Zl 89 ± 10 0.35 ± 0.06 1.26 ± 0.24 164 ± 17 0.43 ± 0.03 0.77 ± 0.42 0.20 ± 0.05 Ze 199 ± 9 0.89 ± 0.20 1.89 ± 0.31 455 ± 30 0.85 ± 0.05 0.39 ± 0.20 0.17 ± 0.03
Figure 1. Quasi-Lagrangian surface chlorophyll-a concentration (mg m−3) in the sampling region. Data represent the mean chlorophyll-a concentration in March 2015. The white line iden-tifies the track of the OUTPACE cruise, with the sampled stations marked 1 to 15 (x) and the long-duration stations marked A, B and C (+).
(1 : 10 000 final) and enumerated for 1 min at ∼ 65 µL min−1. HNF were analyzed for 8 min at ∼ 193 µL min−1in a sample stained with SYBR Green I at 1 : 5000 final concentration (Christaki et al., 2011; Zubkov et al., 2007). Particles were excited at 488 nm (plus 457 nm for unstained samples). For-ward (< 15◦) scatter (FSC), side (90◦) scatter (SSC), green fluorescence (530/40 nm), orange fluorescence (580/30 nm) and red fluorescence (> 650 nm) emissions were measured. Pigmented groups were identified and enumerated based on their chlorophyll (red) fluorescence and FSC (size) signa-tures. The high phycoerythrin (orange) signal in Synechococ-cuswas used to distinguish them from Prochlorococcus and PPE. Using a FSC detector with a small particle option and focusing a 488 plus a 457 nm (200 and 300 mW solid state, respectively) laser into the same pinhole greatly improved the resolution of dim surface Prochlorococcus population from background noise (Duhamel et al., 2014). LNA and HNA bacteria were discriminated based on their low and high green fluorescence, respectively, in an SSC vs. green fluores-cence plot (Vazquez-Dominguez et al., 1999; Van Wambeke et al., 2011). In samples from the upper euphotic layer, where the Prochlorococcus signal at times overlapped with that of HNA in SSC or FSC vs. green fluorescence plots,
Prochloro-coccus abundance counted in unstained samples was sub-tracted from the HNA abundance enumerated in a larger gate. “Total bacteria” refers to the sum of LNA and HNA abundances. Reference beads (Fluoresbrite, YG, 1 µm) were added to each sample and red fluorescence from chlorophyll and FSC values are presented relative to the reference beads (arbitrary units, A.U.).
N2 fixation rates were measured in triplicate at all
sta-tions (except SD13) using the 15N2 isotopic tracer
tech-nique (adapted from Montoya et al. 1996). Briefly, seawater samples were collected in HCl-washed, sample-rinsed (3×) light-transparent polycarbonate 2.3 L bottles from six depths (75, 50, 20, 10, 1, and 0.1 % surface irradiance levels), sealed with caps fitted with silicon septa and amended with 2 mL of 98.9 at. %15N2(Cambridge isotopes). Incubation bottles
were incubated in on-deck incubators equipped with circu-lating seawater at the specified irradiances using blue screen-ing. Incubations were stopped by filtration of the entire sam-ple onto precombusted 25 mm GF/F glass fiber (Whatman, 0.7 µm nominal pore size) filters, which were then analyzed for 15N /14N ratios and PON concentrations using an ele-mental analyzer coupled to a mass spectrometer (EA-IRMS, Integra CN, SerCon Ltd) as described in Bonnet et al. (2018). 2.3 Data analyses and statistics
All data analyses were performed using R Studio (R Core Team, 2016). All figures were prepared using the ggplot2 package (Wickham, 2009), with the exception of the contour plots presented in Fig. 2, which were prepared using Ocean Data View 4.7.10 (Schlitzer, 2017).
Chlorophyll fluorescence of microbial groups was calcu-lated as the ratio of mean red fluorescence of each cell pop-ulation to that of the reference beads, based on flow cytome-try results. Per-cell biomass was calculated using previously published conversion factors: 29 fg C per Prochlorococcus cell, 100 fg C per Synechococcus cell, 11.5 fg C per
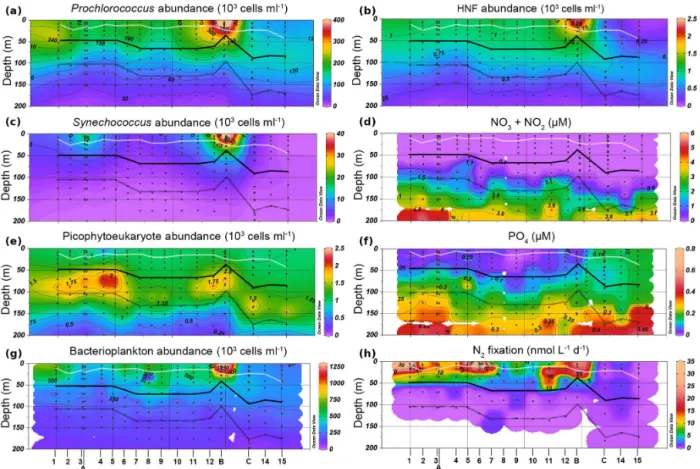
bacte-Figure 2. Contour plots depicting plankton abundances (a, b, c, d, e), nutrient concentrations (f, g) and N2fixation (h) distributions along
the OUTPACE transect. White line represents the mixed layer depth. The black solid line represents the PAR2.7depth. Grey line represents
PAR0.1.
rial cell, and 1500 fg C per PPE cell (Zubkov et al., 2000). Biomass contributions of different phytoplankton groups were estimated by multiplying cell abundances by the con-version factors above and integrating by depth across the euphotic zone. To account for larger eukaryotes not cap-tured by cytometry, we used the method described in Vidussi et al. (2001) to estimate the relative biomass contributions of diatoms and dinoflagellates based on concentrations of fu-coxanthin and peridinin relative to those of total diagnos-tic pigments: zeaxanthin, dv chl a, T chl b, 190 hexanoy-loxyfucoxanthin (190-HF), 190butanoyloxyfucoxanthin (190 -BF), alloxanthin, fucoxanthin, and peridinin. Pigment con-centrations were measured via high-performance liquid chro-matography, as described elsewhere (Ras et al., 2008).
Concentrations of PO4, NO2, and NO3were measured
us-ing a SEAL AA3 HR auto-analyzer (SEAL Analytical, UK), as described by Moutin et al. (2018). Abundances, biomass, and nutrient values are reported as either depth-integrated to-tals or as depth-normalized averages calculated by dividing depth-integrated totals by the depth of integration. In order to account for large vertical gradients in both abundances and nutrient concentrations within the Ze, integrations were
performed across two depth ranges: the upper photic zone
(Zu), integrating from the surface to the recorded 2.7 %
isol-ume (hereafter PAR2.7) and the lower euphotic zone (Zl),
in-tegrating from PAR2.7 to the recorded 0.1 % isolume
(here-after PAR0.1). The mixed layer depth was measured
contin-uously along the transect, as described by de Verneil et al. (2017). The mixed layer was entirely within Zu at all
sta-tions (Fig. 2), while the nitracline, defined as the depth where measurements of NO2+NO3 (hereafter NOx) first exceed
0.1 µM, occurred within Zl at all stations (Fig. 2f).
Attenu-ation coefficients, k (m−1), were calculated by using PAR measurements from conductivity, temperature, depth (CTD) sensors to solve the Beer–Lambert equation between surface PAR and that corresponding to PAR0.1.
To maximize the power of statistical tests, depth-integrated values were calculated for individual casts, without averag-ing results from long-duration stations. Because each cast was made on a different day of occupation, doing so did not violate assumptions of independence during subsequent sta-tistical analyses. Integration results were then assigned cate-gorical variables corresponding to biogeochemical condition or euphotic zone layer, with two-way ANOVA being used to identify statistical relationships between parameters accord-ing to these variables (Table 2). Tukey’s honest significant
Table 2. Summary table of two-way ANOVA results for parameters analyzed in this study. Row 1 (euphotic layer) tests for significant differences between mean parameter values across different layers of the euphotic layer (Zuor Zl) on mean parameter values. Row 2
(area) tests for significant differences between mean parameter values across different biogeochemical areas (MA, LDB, and GY). Row 3 (interaction) tests for differences between mean parameter values across both euphotic layer and biogeochemical condition. Relationships for Pro, Bac, HNF, NOx, and PO4calculated from depth-integrated abundances; relationships for %HNA calculated from raw values.
Pro Syn PPE Bac %HNA HNF NOx PO4
DF f p f p f p f p f p f p f p f p
Layer 1 49.2 <0.01 23.3 <0.01 68.1 <0.01 88.3 <0.01 5.4 0.02 24.7 <0.01 42.4 <0.01 40.6 <0.01 Area 2 2.9 0.1 25.9 <0.01 3.2 0.1 4.6 0.2 16.9 <0.01 6.0 0.01 12.6 <0.01 113.2 <0.01 Int. 2 7.0 <0.01 15.8 <0.01 0.9 0.4 6.0 0.01 0.7 0.50 11.3 <0.01 11.9 <0.01 3.01 0.1
difference post hoc test was used to compare group means when two-way ANOVA indicated significant between-group differences. To ensure that data met the requirements for ANOVA (i.e., normally distributed, and with equal variance between groups), values were log-transformed before per-forming statistical tests. In the case of nutrient data and N2
fixation rates, which were often skewed by large occurrences of small values, data were transformed using the formula data = log (data×100 + 1). Bivariate comparisons between biogeochemical parameters were performed using Pearson’s correlation. The Shapiro–Wilk test was used to assess nor-mality, while Levene’s test was used to confirm homogeneity of variance.
3 Results
3.1 Physico-chemical characteristics of the studied area Stations along the transect were characterized by warm sea surface temperatures (mean 29.4 ± 0.4◦C). The water
column was strongly stratified along the entire transect, with mixed layer depths ranging from 21 ± 5 m for MA to 25 ± 8 m for GY (Fig. 2). Conversely, there was a signifi-cant west to east decrease in light attenuation (k), ranging from 0.059 ± 0.006 m−1 for MA to 0.044 ± 0.005 m−1 for GY. An exception to this trend was found at LDB, where k increased to 0.078 ± 0.021. Corresponding to these changes in k, PAR0.1 deepened from west to east, ranging from
113 ± 13 m for MA to 178 ± 5 m for GY. Again, LDB pre-sented an exception to this general trend, where PAR0.1 was
recorded at 83 ± 5 m.
All stations across the transect featured a prominent deep chlorophyll maximum (DCM). Mirroring changes in k, the DCM showed a general increase in depth from west to east, ranging from 85 ± 20 to 133 ± 20 m from MA to GY, re-spectively. The DCM depth at LDB was also an excep-tion, decreasing to 50 ± 19 m. The concentration of dissolved oxygen was near equilibrium with the atmosphere near the surface, becoming slightly oversaturated below the mixed layer. This subsurface maximum occurred at a mean depth of 55 ± 18 m and was weakly correlated with the depth of the DCM (Pearson’s r = 0.44, p < 0.01). Oxygen levels within
Ze were above 158.31 mol kg−1 across the entire transect,
with there being no suboxic regions at any of the stations sampled. The nitracline generally tracked the DCM, occur-ring at depths ranging from 93 ± 17 m for MA to 127 ± 13 m for GY. The nitracline was decoupled from the DCM at LDB, where it occurred at 108 ± 22 m.
NOx concentrations were depleted in Zu across all
bio-geochemical conditions. While depth-normalized NOx
con-centrations were significantly elevated in Zlfor MA and GY
(ANOVA, p < 0.01), no significant difference was encoun-tered between Zuand Zlat LDB (Table 1). Depth-normalized
phosphate (PO4) concentrations in Zuwere significantly
el-evated at GY relative to other stations (ANOVA, p < 0.01), although no significant differences were identified between MA and LDB.
3.2 Phytoplankton community structure
Prochlorococcus dominated phytoplankton abundances at all sampling sites, with average Ze-integrated abundances
being 2 orders of magnitude greater than those of Syne-chococcus and PPE (Table 1). Ze-integrated
Prochloro-coccus abundances ranged from 135 × 1011 at SD3 to 283 × 1011cells m−2at SD1, while those for Synechococcus ranged from 0.65 × 10¹¹ at SD15 to 18.62 × 10¹¹cells m−2 at LDB. PPE abundances ranged from 1.40 × 10¹¹ to 2.60 × 10¹¹cells m−2at SD3 and SD12, respectively. There were no significant differences in Ze-integrated
abun-dances of these groups across biogeochemical conditions, except for those of Synechococcus, which were signifi-cantly greater at LDB compared to MA or GY (ANOVA, p <0.01). Transect-wide, Prochlorococcus accounted for approximately 97 ± 2 % of total phytoplankton cells enumer-ated by flow cytometry. Synechococcus and PPE accounted for 2 ± 2 and 0.8 ± 0.2 % of total phytoplankton abundance, respectively. Pooling all data, statistically significant corre-lations were identified between all pairs of plankton groups (Pearson’s R, p < 0.01).
Based on Ze-integrated abundances, relative
contribu-tions of different phytoplankton groups to total phytoplank-ton abundance showed considerable longitudinal variation. Synechococcus accounted for 0.4 ± 0.1 % of phytoplank-ton cells at GY, 2.4 ± 1.9 % at MA, and 7.4 ± 4.4 % at
LDB. Prochlorococcus abundances, by contrast, represented 92.1 ± 4.3 % of phytoplankton cells at LDB, 96.7 ± 2.0 % at MA, and 98.6 ± 0.2 % at GY. Ratios of Ze-integrated
abundances of Prochlorococcus to Synechococcus varied sig-nificantly (ANOVA, p < 0.01) between GY (235.7 ± 65.1) and LDB (16.2 ± 10). PPE abundances showed less vari-ability, with relative abundances ranging from 0.4 ± 0.1 to 0.9 ± 0.1 % of phytoplankton cells at LDB and GY, respec-tively. Differences in the relative abundance of PPE be-tween biogeochemical conditions were not statistically sig-nificant. Statistically significant negative correlations were found between concentrations of NOxand PO4and all
plank-ton groups (Pearson’s R, p < 0.01), while significant pos-itive correlations were identified between N2 fixation rates
and abundances of Prochlorococcus and heterotrophic bac-teria (Pearson’s R, p < 0.01). These correlations persisted when subsetting data to include mixed layer values alone (Pearson’s R, p < 0.01), with the exception of correlations between NOxand plankton groups.
Most stations were characterized by a well-defined two-tier distribution of phytoplankton within the Ze(Fig. 3), with
depth-integrated abundances of Prochlorococcus and Syne-chococcus being greatest in the Zu, and PPE abundances
being greatest in Zl (Table 1). These differences between
Zuand Zl abundances were found to be statistically
signif-icant for Prochlorococcus across all conditions. Differences were significant for Synechococcus at MA, and for PPE at MA and GY (ANOVA, p < 0.01). Prochlorococcus and PPE abundances showed subsurface maxima at both MA and GY. Averaging across the transect, Prochlorococcus abundance maxima occurred at depths corresponding to 24.2 ± 24.4 % PAR, while PPE maxima occurred at depths corresponding to 0.6 ± 0.4 % PAR. Depths of these maxima showed a west to east increase, and were significantly deeper at GY than at MA for all phytoplankton groups (ANOVA, p < 0.01).
There was no significant variation in Ze-integrated
biomass between different conditions, although Zu
-integrated biomass was significantly greater (p < 0.01) at LDB compared to MA and GY stations (Fig. 4). In keeping with relative abundances, Prochlorococcus cells represented the greatest fraction of Zebiomass, accounting for an average
of 77.1 ± 5.5 % across the transect. By comparison, PPE ac-counted for an average of 18.7 ± 5.4 % of Zebiomass, while
Synechococcus accounted for 3.9 ± 4.3 %. However, there was considerable vertical and longitudinal variation in these trends, especially in contributions to total biomass by PPE and Synechococcus populations (Fig. 4). PPE accounted for 29 ± 14 % of phytoplankton biomass considering Zl
alone, and up to 64 % of Zlbiomass at SD4. Synechococcus
accounted for up to 13 % of Zu phytoplankton biomass at
LDB.
3.3 Distributions of bacterioplankton and HNF
Ze-integrated bacterial abundances ranged from 417 × 1011
to 661 × 1011cells m−2at LDA and LDB, respectively (Ta-ble 1). Despite this range, there was relatively little variation when comparing biogeochemical regions; while average Ze
-integrated abundances at GY were somewhat elevated com-pared to those for MA, and while those at LDB were amongst the highest on the transect, these differences were not sta-tistically significant. Examining HNA and LNA subpopu-lations, Ze-integrated abundances for HNA bacteria ranged
from 115 × 1011 to 291 × 1011cells m−2 at SD3 and SD9, respectively, while values for LNA ranged from 155 × 1011 at SD3 to 298 × 1011cells m−2 at SD8. As with total bac-teria, there were no statistically significant longitudinal dif-ferences in Ze-integrated HNA or LNA abundances when
comparing different biogeochemical regions. The fraction of HNA to total bacteria (%HNA) ranged from 41.1 ± 2.1 to 48.0 ± 4.9 % between GY and LDB, respectively. Values for %HNA were significantly greater at LDB relative to MA and GY (ANOVA, p < 0.01) and at MA relative to GY (ANOVA, p <0.01). Bacterial abundances showed less variability with depth than did phytoplankton groups, with there being no sig-nificant differences in depth-integrated abundances between Zu and Zl for total bacteria, HNA, or LNA. Depth profiles
of %HNA, however, were more variable than those for total bacteria. %HNA increased from the surface to PAR0.1across
all biogeochemical regions, and distinct local minima were apparent near the DCM at MA and GY (Fig. 5).
Mean HNF abundances in Zuranged from 0.38 × 10³to
2.3 × 10³cells mL−1 at SD 15 and LDB, respectively. Ze
-integrated abundances at LDB were significantly greater than those at GY (ANOVA, p < 0.01), although no significant differences were found between other conditions. Depth-integrated abundances of HNF were significantly greater in Zuthan Zlat MA and GY (ANOVA, p < 0.01), while there
was no significant change in HNF abundances with depth at LDB.
3.4 Bottom–up vs. top–down control of microbial communities
In order to assess the roles of top–down and bottom–up con-trol over microbial group abundances along the transect, we used a combination of approaches based on previously pub-lished models. The model described by Gasol (1994) was used to assess top–down vs. bottom–up control of HNF abun-dance (Fig. 6). Specifically, this approach compares observed ratios of bacteria to HNF with HNF abundance maxima es-timated from empirical data and theoretical interactions be-tween bacteria and HNF. The main assumption of the model is that bacteria to HNF ratios nearer to theoretical max-ima imply increased bottom–up control of HNF by bacterial abundance. This difference is quantified with the parameter d, which is calculated as the difference between theoretical
Figure 3. Abundance profiles for Prochlorococcus (a), Synechococcus (b), and PPE (c). Color-coded lines represent average cell abundance; grey lines represent the relative fluorescence for each group, based on cytometry data. Color-coded points represent original observations for biogeochemical region (MA, LDB, and GY) with shading representing standard error. Dotted and dashed horizontal lines represent average PAR2.7and PAR0.1depths, respectively.
and observed HNF abundances. Small values of d are thus interpreted as being indicative of top–down control on bacte-rial populations by HNF, or by a significant use of resources other than bacteria by HNF. Large values of d are interpreted as being indicative of a decoupling between the two groups, and/or a top–down control of HNF by their predators, like cil-iates. Average Zuvalues for d were 0.59 ± 0.11, 0.62 ± 0.19,
and 0.80 ± 0.09 for MA, LDB, and GY, respectively. By con-trast, average Zlvalues for d were 0.46 ± 0.14, 0.43 ± 0.08,
and 0.45 ± 0.10 for MA, LDB, and GY, respectively. Zu
Val-ues for d were significantly elevated at GY relative to MA
and LDB (ANOVA, p < 0.01). No significant differences in dwere identified between biogeochemical regions in Zl.
Regressions between abundances of bacteria and HNF were measured for Zuand Zl across biogeochemical
condi-tions (data not shown). The variability in HNF abundances explained by bacteria abundance was generally greater in Zl
compared to Zu. Zubacterial abundances explained 24, 30,
and 30 % of variability in HNF abundance at MA, LDB, and GY, respectively. In Zl, bacterial abundances explained
57 and 72 % of variability at MA and GY stations, respec-tively, while this relationship was not statistically significant
Figure 4. Contribution of different plankton groups (heterotrophic bacteria (Bac, blue), Synechococcus (Syn, green), Prochlorococ-cus(Pro, orange), and picophytoeukaryotes (PPE, red)) to depth-integrated biomass, averaged by biogeochemical region (MA, LDB, GY). The y axis corresponds to a layer of the euphotic zone, with “total” representing integrations from surface to PAR0.1, “upper”
representing integrations from surface to PAR2.7, and “lower” re-ferring to depths between PAR2.7and PAR0.1.
at LDB. Repeating this procedure for HNA bacteria alone, Zu
HNA abundances were found to explain 15, 29, and 73 % of variability in HNF abundance at MA, LDB, and GY, respec-tively. Zlbacteria abundances were found to explain 61 % of
variability in HNF populations at GY, while relationships at MA and LDB were insignificant. Zuvalues for %HNA
ex-plained 73 % of variability in HNF abundances at GY, while this relationship was weak and insignificant at MA and LDB. Using the ciliate abundances collected by Dolan et al. (2016) during the OUTPACE cruise, ratios of depth-integrated abundances of ciliates to HNF (with HNF abun-dances multiplied by 1011 for readability) were found to range from 2.8 in the upper euphotic zone at LDB to 17.6 in the lower euphotic zone at LDC (Fig. 2e). In the upper eu-photic zone, this ratio increased from 2.9 at LDB to 10.0 at LDC and 10.9 at LDA. The lower euphotic zone showed a slightly different pattern, with the ratio increasing from 9.0 at LDA to 9.6 at LDB and 17.5 at LDC. Because data avail-able were limited to one set of measurements at each of those three stations, it was not possible to determine whether dif-ferences in these results were statistically significant. How-ever, comparing differences between biogeochemical condi-tions based on observacondi-tions at individual depths, rather than depth-integrated values, indicated the ratio of ciliates to HNF to be significantly lower at LDB compared to LDC (ANOVA, p <0.01). Differences between other biogeochemical con-ditions, however, were statistically insignificant. No signif-icant vertical or longitudinal differences were identified for ratios of HNF to cyanobacteria, nor for ratios of bacteria to cyanobacteria.
3.5 Distribution of pigments and photo acclimation in different phytoplankton groups
Phytoplankton group-specific relative fluorescence values obtained by flow cytometry for Prochlorococcus, Syne-chococcus, and PPE showed significant (t -test, p < 0.01) increases with depth across all biogeochemical conditions (Fig. 3). Phytoplankton relative fluorescence for all groups showed little variation within the Zu, although marked
in-creases occurred in the region of PAR2.7. Prochlorococcus
relative fluorescence showed a continuous increase to 200 m at MA and GY, and an increase to 150 m at LDB. Syne-chococcusand PPE showed clear maxima near or just below PAR0.1, although PPE relative fluorescence showed a
contin-uous increase to 200 m at GY.
Analysis of HPLC pigment data using the approach de-scribed in Vidussi et al. (2001) largely mirrored our flow cy-tometry results. Transect-wide, zeaxanthin and chlorophyll b pigments corresponding to cyanobacteria and prochloro-phytes dominated in Zu, accounting for 80 ± 5.1 % of total
diagnostic pigments. Fucoxanthin and peridinin, diagnostic of diatoms and dinoflagellates, accounted for 3.8 ± 1.0 %. Concentrations of 190HF and 190BF – diagnostic pigments typically used to assess abundances of prymnesiophytes and chrysophytes/pelagophytes, respectively (Wright and Jeffrey, 2006) – showed significant horizontal and verti-cal variability (Table 3). Absolute concentrations of both pigments showed significant increases with depth at MA and GY (ANOVA, p < 0.01), although increases at LDB were not statistically significant. Ratios of 190HF : Chl a were significantly greater than those of 190BF : Chl a across all biogeochemical conditions (t -test, p < 0.01). Ratios of 190HF : Chl a showed significant increases with depth at MA (ANOVA, p < 0.01), although increases at GY and LDB were not statistically significant. Ratios of 190BF : T Chl a showed significant increases at MA and GY (ANOVA, p <0.01), while increases at LDB were insignificant. Zl
ra-tios of 190HF : 190BF were significantly elevated at LDB compared to MA (ANOVA, p < 0.01). That no similar such difference was observed in comparing LDB to GY is likely the result of the reduced number of samples avail-able for making this comparison. Indeed, the difference was nearly significant (ANOVA, p = 0.03), while Zl ratios of
190HF : 190BF at MA were remarkably similar (ANOVA, p =0.99). A moderately strong relationship was identified between carotenoid concentrations and PPE abundances, with variability in PPE accounting for 46 % of variability in 190BF + 190HF (p < 0.01).
Figure 5. Percent of total bacteria accounted for by HNA, by biogeochemical region: MA, LDB, and GY. Trendline calculated using LOESS regression. Shading represents the standard error of samples at each depth. The dashed line represents the average PAR2.7depth. The dotted
line represents the average PAR0.1depth.
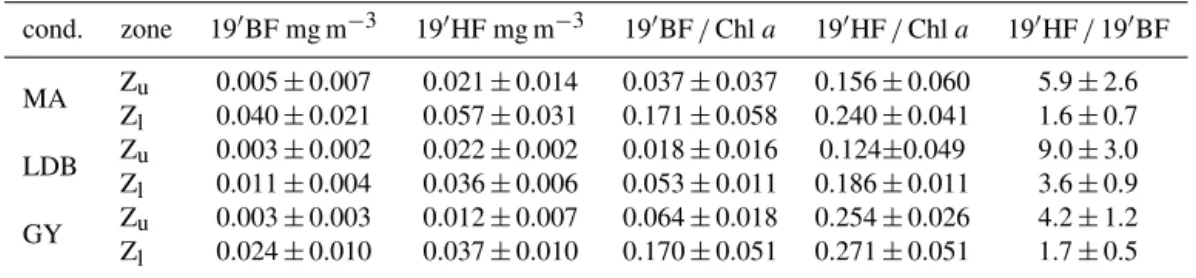
Table 3. Average depth-integrated concentrations of 190-hexanoyloxyfucoxanthin (190HF) and 190-butanoyloxyfucoxanthin (190BF). Ratios of these pigments to Chl a calculated using HPLC values for T Chl a.
cond. zone 190BF mg m−3 190HF mg m−3 190BF / Chl a 190HF / Chl a 190HF / 190BF MA Zu 0.005 ± 0.007 0.021 ± 0.014 0.037 ± 0.037 0.156 ± 0.060 5.9 ± 2.6 Zl 0.040 ± 0.021 0.057 ± 0.031 0.171 ± 0.058 0.240 ± 0.041 1.6 ± 0.7 LDB Zu 0.003 ± 0.002 0.022 ± 0.002 0.018 ± 0.016 0.124±0.049 9.0 ± 3.0 Zl 0.011 ± 0.004 0.036 ± 0.006 0.053 ± 0.011 0.186 ± 0.011 3.6 ± 0.9 GY Zu 0.003 ± 0.003 0.012 ± 0.007 0.064 ± 0.018 0.254 ± 0.026 4.2 ± 1.2 Zl 0.024 ± 0.010 0.037 ± 0.010 0.170 ± 0.051 0.271 ± 0.051 1.7 ± 0.5 4 Discussion
4.1 Distribution of phytoplankton populations in the WTSP and relative contribution to biomass
Transect-wide biogeochemical conditions captured by our data were similar to those of the “typical tropical structure” described by Herbland and Voituriez (1979), featuring large abundances of pico-sized organisms in Zu, a deep nitracline,
and a prominent DCM in Zl. Differences in relative
abun-dances of phytoplankton groups between Zuand Zl showed
a clear two-tiered vertical niche partition, with Prochloro-coccus and Synechococcus reaching maximum abundances in the Zuand PPE achieving maximum abundances in the Zl.
This vertical distribution has been well documented in other regions, and is thought to be characteristic of highly stratified oligotrophic systems (Dore et al., 2008; Painter et al., 2014; Partensky et al., 1996). Based on estimates from HPLC data, larger organisms such as diatoms and dinoflagellates were present in very low abundance along the transect, in compar-ison to small-sized phytoplankton.
Although the use of different conversion factors for esti-mating per-cell carbon makes it difficult to compare between different studies, our biomass estimates largely agree with those reported for other oligotrophic regions (Grob et al., 2007b; Partensky et al., 1996; Pérez et al., 2006; Zubkov et al., 2000). Prochlorococcus accounted for the large
ma-jority of phytoplankton biomass in the Zu, with
Synechococ-cusand PPE only making relatively minor contributions. In Zl, by contrast, PPE accounted for a more sizeable and
oc-casionally dominant share of phytoplankton biomass. This effect was particularly pronounced at GY, where increases in ZlPPE biomass compensated for reductions in Zu
Prochloro-coccusbiomass, resulting in Zebiomass totals being similar
to those at MA.
To compare our results to those from other ocean basins, we conducted a meta-analysis of datasets report-ing Prochlorococcus, Synechococcus, and PPE abundances alongside Chl a concentrations. Mean depth-integrated abun-dances of Synechococcus and PPE measured along the OUT-PACE transect were similar to those reported elsewhere, as were those of Prochlorococcus at MA and GY (Table 4). However, mean depth-integrated abundances of Prochloro-coccusat LDB were considerably higher than mean values for other regions. Some of this variation may result from the instrumentation used, with earlier cytometers generally be-ing thought to underestimate weakly fluorescent Prochloro-coccuscells near the surface. Regardless, with Ze-integrated
Prochlorococcusabundances at LDB being greater than any others encountered in the literature, these results highlight the importance of transient, localized blooms to cyanobacte-rial abundance in the region.
Table 4. Mean normalized abundances for Prochlorococcus (Pro), Synechococcus (Syn), picophytoeukaryotes (PPE), and depth-integrated concentration of Chl a. %pro calculated as pro/(pro+syn+ppe). Values for different biogeochemical conditions sampled during the OUTPACE transect in bold. Depth-normalized values provided to account for differences in the depth of integration between sampling sites (data not shown). OUTPACE Chl a values correspond to discrete fluorometric data collected at each station of the transect, with the exception of SD 1–3. Chl a values from other datasets correspond to discrete fluorometric or HPLC data.
area n Chl a mg m−3 Pro × 1011m−3 Syn × 1011m−3 PPE × 1011m−3 % Pro source LDB 3 0.34 ± 0.06 2.23 ± 0.90 0.16 ± 0.07 0.01 ± 0.00 92 This study Indian Ocean 28 0.26 ± 0.05 0.12 ± 0.21 0.08 ± 0.06 0.02 ± 0.01 25 JGOFS1 MA 10 0.23 ± 0.05 1.20 ± 0.34 0.02 ± 0.02 0.01 ± 0.00 97 This study Arabian Sea 82 0.18 ± 0.07 0.47 ± 0.46 0.23 ± 0.17 0.03 ±0.02 53 JGOFS N. Pacific 227 0.15 ± 0.02 1.27 ± 0.40 0.01 ± 0.01 0.01 ± 0.00 99 HOT2 N. Atlantic 219 0.14 ± 0.06 0.48 ± 0.34 0.07 ± 0.08 0.01 ± 0.01 81 BATS3
AMT4 Eq. Pacific 212 0.14 ± 0.04 1.43 ± 0.54 0.11 ± 0.06 0.05 ± 0.03 93 JGOFS S. Pacific 50 0.12 ± 0.04 1.00 ± 0.34 0.07 ± 0.06 0.03 ± 0.02 93 BiG RAPA5
BIOSOPE6 JGOFS Med. 16 0.10 ± 0.07 0.33 ± 0.10 0.09 ± 0.09 0.02 ± 0.01 78 JGOFS GY 6 0.11 ± 0.01 1.08 ± 0.10 0.02 ± 0.02 0.01 ± 0.00 99 This study S. Atlantic 28 0.07 ± 0.04 1.21 ± 0.32 0.02 ± 0.02 0.01 ± 0.01 98 AMT
1Joint Global Ocean Flux Study (Sieger et al., 2005).2Hawaii Ocean Time-series; HOT-Data Organization and Graphical System,
http://hahana.soest.hawaii.edu/hot/hot-dogs (last access: 7 May 2018).3Bermuda Atlantic Time-series, http://bats.bios.edu/bats-data/ (last access: 7 May 2018).
4Atlantic Meridional Transect; British Oceanographic Data Centre, http://www.bodc.ac.uk/ (last access: 7 May 2018).5C-MORE Data System,
http://hahana.soest.hawaii.edu/cmoreDS (last access: 7 May 2018).6LEFE-CYBER Database, http://www.obs-vlfr.fr/proof/ (last access: 7 May 2018).
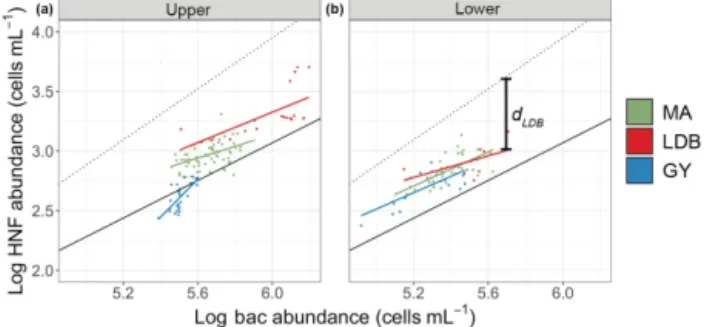
Figure 6. Log–log plot of Zubacteria and HNF abundances
(up-per, a) and log–log plot of Zlbacteria and HNF abundances (lower,
b). Dots correspond to observed abundances, grouped by condition. Solid color-coded lines are regressions for abundance data corre-sponding to each biogeochemical condition. The solid black line corresponds to the regression line for mean realized abundances in marine environments (log MRA = 0.79 × log Bac − 1.67). The dot-ted line corresponds to the theoretically maximum attainable abun-dance (log MAA = 1.07 × log Bac − 2.47), as described in Gasol et al. (1994). dLDBincluded for clarification of the d parameter.
The observed increase in the percentage of Ze-integrated
Prochlorococcus abundances accounting for total picophy-toplankton abundance from LDB to GY captures a global trend. The proportion of Prochlorococcus cells accounting for total picophytoplankton abundances has generally been reported to decrease with increased Chl a concentrations, while those of Synechococcus cells have been found to in-crease along the same gradient (Table 4). In the Sargasso Sea,
where winter mixing allows for the resupply of surface nu-trients, long-term studies have captured this relationship as a seasonal pattern, with ratios of Prochlorococcus to Syne-chococcusincreasing inversely with changes in the depth of the nitracline (Campbell et al., 1998; Durand et al., 2001). The same phenomenon has been reported along biogeochem-ical conditions in the North Atlantic (Partensky et al., 1996; Zubkov et al., 2000), as well as the southeastern Pacific (Grob et al., 2007a; Rii et al., 2016b). By contrast, sites with comparatively limited seasonal variability, like station ALOHA in the North Pacific subtropical gyre, have shown consistently high ratios of Prochlorococcus to Synechococ-cusyear-round (Rii et al., 2016a), while studies of nitrate-rich eutrophic regions often report the complete exclusion of Prochlorococcus by Synechococcus and eukaryotic pop-ulations (Sherr et al., 2005; Zubkov et al., 2007). The high relative abundance of Prochlorococcus at LDB compared to sites with similar Chl a concentrations may be due to having captured the bloom in decay (de Verneil et al., 2017), with nutrients having been largely depleted at the time of mea-surement and relative Prochlorococcus abundances returning to levels more representative of the WTSP. Alternatively, the bloom conditions may be incomparable to regions with more persistent inputs of nutrients.
4.2 Potential factors regulating the horizontal distribution of phytoplankton groups
In examining the potential factors regulating the distribution and abundance of cyanobacterial groups, our data did not re-ward any expectations that abundances of Prochlorococcus, Synechococcus or PPE would correlate meaningfully with NOxconcentrations. While negative relationships were
iden-tified between plankton abundances and NOxconcentrations
across all sites, this was likely the result of changes in these parameters with depth rather than being indicative of any causal relationship. Indeed, comparing values in Zu alone,
correlations between NOxand plankton abundances became
insignificant, with NOxbeing largely depleted above PAR2.7.
However, correlations between N2fixation, PO4
concentra-tions, and plankton abundances persisted even when subset-ting data to only include measurements within the mixed layer, indicating covariation between these parameters as occurring independently of depth. Specifically, correlations between N2 fixation rates and abundances of
cyanobacte-ria suggest plankton abundances in the surface to respond to diazotroph-derived nitrogen (ammonia and DON) pro-vided by N2-fixing organisms, notably Trichodesmium which
dominated in the upper euphotic zone at MA (Stenegren et al., 2018). Previous studies have demonstrated growth to increase with DON enrichment in both Synechococcus and Prochlorococcus cultures (Moore et al., 2002), while others have indicated that diazotrophs may provide a large enough input of fixed nitrogen to sustain large populations of cyanobacteria (Bonnet et al., 2016b). Moreover, previous ex-periments in the New Caledonia lagoon have shown a rapid transfer (24–48 h) of recently fixed N by Trichodesmium towards non-diazotrophic phytoplankton and heterotrophic bacteria (Bonnet et al., 2016a), while Caffin et al. have demonstrated the efficient transfer of N fixed by UCYN-B cyanobacteria to the planktonic food web along the OUT-PACE transect (2018). Biological nitrogen inputs may allow for a more complete utilization of PO4at sites featuring high
nitrogen-fixation rates (Mather et al., 2008; Moutin et al., 2018), accounting for the negative correlations observed be-tween PO4concentrations and abundances of
Prochlorococ-cus and Synechococcus, as well as for the negative corre-lations observed between PO4 concentrations and N2
fixa-tion rates. These results, along with the low DIP turnover rates reported, suggest intense competition for phosphorus within the mixed layer, and a rapid transfer of fixed N toward prokaryotes (Van Wambeke et al., 2018).
4.3 Potential factors regulating vertical variability in phytoplankton community structure
Considerable variation in vertical distributions of phyto-plankton groups was observed between biogeochemical re-gions. Although Synechococcus and PPE appeared confined to high-light and low-light depths, respectively,
Prochloro-coccusabundances showed a greater deal of vertical vari-ability, with Prochlorococcus subsurface abundance maxima varying widely with respect to PAR (Fig. 3). This indicates Prochlorococcusdistributions in Zu to be less sensitive to
changes in light availability than other phytoplankton groups (Partensky et al., 1999), possibly as a result of compara-tively reduced increases in per-cell chlorophyll concentra-tions with depth, as reflected by relative fluorescence values (Fig. 3). However, the observed Prochlorococcus distribu-tions reflect the average distribution of a mosaic of differ-ent ecotypes encompassing high diversity in their response to nutrients, light, and temperature (Johnson, 2006; Kash-tan et al., 2014; Moore et al., 2002). Indeed, the increase in depth of Prochlorococcus abundance maxima observed at GY is likely the result of the deepening of the euphotic layer, combined with the reduction of high-light ecotypes in Zu. While previous studies have reported correlations
be-tween Prochlorococcus abundance maxima and nitracline depth (Li, 1995; Olson et al., 1990), no such similar pat-terns were observed in our data. These distributions may be a transient feature formed during restratification following winter mixing (Partensky et al., 1999), and are unlikely to be in response to nitrate availability, given the small nitrate uti-lization by Prochlorococcus in natural samples (Casey et al., 2007). These results may also be the consequence of the dif-ficulty in detecting weakly fluorescent high-light Prochloro-coccusfollowing earlier flow cytometry protocols with less sensitive instruments.
In contrast to other phytoplankton groups, PPE abun-dances were marginal in Zu, but increased dramatically
be-low PAR10, reaching maximal abundances at depths closely
correlated with those of the DCM. The lack of variability of PPE abundance maxima relative to PAR, along with the de-coupling of PPE maxima from the nitracline at LDB, suggest PPE abundances to be primarily controlled by light levels rather than by the availability of dissolved nutrients. How-ever, it is difficult to consider these factors independently, with the increased chlorophyll concentrations required at low light levels likely increasing nitrogen requirements on shade-adapted organisms (Edwards et al., 2015).
Differences in vertical distributions of PPE between sta-tions likely also reflect variability in the composition of PPE communities. The decrease with depth observed in ra-tios of 190HF : 190BF would suggest that prymnesiophytes dominate in the Zu, with chrysophytes and pelagophytes
ac-counting for a greater proportion of total PPE abundance in Zl. Similar distributions have been reported elsewhere,
and have been suggested to reflect control of chrysophyte and pelagophyte abundances by nitrate availability (Barlow et al., 1997; Claustre et al., 1994; Marty et al., 2002). This interpretation agrees with our results, where the separation of PPE abundance maxima from the nitracline coincided with significantly elevated Zl ratios of 190HF : 190BF
com-pared to MA. That elevated Zl values for 190HF : 190BF at
of NH4 suggests that prymnesiophytes may preferentially utilize reduced forms of nitrogen. This would also account for the elevated abundances of this group in Zu across all
biogeochemical conditions, where reduced forms of nitro-gen would nitro-generally be expected to be more abundant as a result of nutrient recycling. Admittedly, with variability in 190HF + 190BF only accounting for ∼ 50 % of variability in picoeukaryote abundances, it is likely that observed patterns of 190HF : 190BF capture changes in nano- and micro-sized eukaryotes in addition to PPE.
It is also possible that ZlPPE populations are responding
to the availability of nitrogen fixed by UCYN-A cyanobacte-ria, which were reported to have distributions at least qualita-tively similar to those of PPE across the transect (Stenegren et al., 2018). Several UCYN-A clades have been identified to form symbioses with small prymnesiophytes, including at least one pico-sized haptophyte (Martínez-Pérez et al., 2016), making it seem plausible that such relationships could play an important role in controlling PPE distributions.
4.4 Factors controlling bacterial abundance and the role of HNF
Average bacterioplankton abundances in the Ze
(3.6 × 10⁸±2.6 × 10⁵cells L−1) were within the estab-lished range of 1–5 × 10⁸cells L−1 for the oligotrophic ocean (Ducklow, 2002). That bacterioplankton abundances at LDB should exceed this range, slightly exceeding 7.0 × 10⁸cells L−1, is not surprising, based on the increased abundances of phytoplankton at that station. Surface values for %HNA, ranging from 30 % at SD15 to 51 % at SD1, are similar to previously reported values, as is the observed increase in %HNA with depth (Van Wambeke et al., 2011). The reduced values for %HNA reported for GY are similar to those reported for other nutrient-limited regions, and may be the result of LNA cells being capable of more rapid growth than HNA under nutrient limitation (Andrade et al., 2007; Nishimura et al., 2005).
To assess variation in trophic interactions between HNF and bacteria across biogeochemical conditions, we used the method presented by Gasol (1994), which compares ob-served ratios of HNF to bacteria with theoretical maxima (d). Previous applications of this model have demonstrated an increase in top–down control of bacterial populations in low-chlorophyll regions, demonstrated by low values for d under nutrient limitation (Gasol et al., 2002). These results find general support in the literature, on the underlying as-sumption that nutrient-limited regions are characterized by reduced abundances of top predators, resulting in increased grazing pressure on bacteria via a trophic cascade (Pern-thaler, 2005). Our data, however, contrast with these con-clusions, with values for d being significantly greater at GY relative to those corresponding to MA or LDB, suggesting a reduction in grazing pressure on heterotrophic bacteria with increased nutrient limitation in Zu.
There are several possible explanations for this result. Based on the significantly reduced Zuvalues for %HNA
en-countered at GY, decoupling of bacterial and HNF popula-tions may be the result of diminished prey quality at these sites. While it has been debated whether HNA and LNA can be interpreted as representing active and inactive cells, re-spectively (Jochem et al., 2004; Vaqué et al., 2001), HNA bacteria have generally been found to be larger in diame-ter than LNA bacdiame-teria (Van Wambeke et al., 2011), possi-bly making them more susceptible to grazing. Such a phe-nomenon has been described previously in nutrient-limited regions (Longnecker et al., 2010; Vaqué et al., 2001), al-though studies conducted in relatively nutrient-rich regions have reported no such similar evidence (Jochem et al., 2004). In our data, the increased r2values for linear regressions be-tween abundances of HNA and HNF at GY suggest that HNA densities may be more important in controlling HNF densi-ties at GY than at MA or LDB. This may account for the increased values of d calculated at GY – the relationships used to establish the model’s theoretical maxima not account-ing for changes in grazaccount-ing rates in response to %HNA, and thereby potentially overestimating HNF abundance, as de-rived from bacterial abundance, in cases where %HNA is low. Plotting bacterial abundances against the bacterial pro-duction data reported by Van Wambeke et al. (2018), and interpreting regression slopes using the criteria described by Ducklow et al. (1992) in Zu, we found no evidence of
bottom–up control of bacteria populations at MA, LDB or GY (data not shown). This is similar to the results obtained by Morán et al. (2017), who applied the Ducklow model to data collected in the South Pacific during austral summer and reported very weak bottom–up control at all sampling sites, calculating regression slopes around 0.2 for samples between the surface and 4000 m. The authors likely would have ob-tained still lower slopes had their analysis been restricted to surface data alone, as we found for Zu.
The increase in d at GY could alternatively result from in-creased grazing on cyanobacterial prey, given that the HNF abundances predicted by the Gasol model are calculated on the assumption that HNF only graze on heterotrophic bacteria. Previous studies have reported HNF to graze on cyanobacteria, generally at rates similar to those reported for grazing on heterotrophic bacteria (Christaki, 2001; Cuevas and Morales, 2006; Ferrier-Pagès and Gattuso, 1998). How-ever, ratios of bacteria to cyanobacteria are largely invariable across the transect, as are ratios of HNF to cyanobacteria. Both of these values would reasonably be expected to vary if responsible for the reported differences in d. To account for the possibility that Prochlorococcus cells were erroneously identified as heterotrophic bacteria at the time of the model’s formulation, we repeated the analysis including abundances of Prochlorococcus on the x-axis. Although doing so in-creased d values across all biogeochemical conditions, it did not qualitatively affect the relationship as described above (data not shown).
The reduction of d reported in Zl may result from
phagotrophy by PPE, by reducing bacterial abundances rela-tive to those of HNF. Feeding experiments in the North At-lantic have demonstrated small plastidic eukaryotes to ac-count for up to 90 % of bacterivory in nutrient-limited waters (Zubkov and Tarran, 2008), while laboratory and field stud-ies have demonstrated increased feeding rates specifically in response to P limitation (Christaki et al., 1999; McKie-Krisberg et al., 2015). We also cannot exclude the possibil-ity that the decoupling of bacterial and HNF populations ob-served at GY reflects increased grazing pressure on HNF by ciliates, which would imply an increase in the importance of top–down processes under nutrient limitation. However, given that ratios of ciliates to bacteria are similar between MA and GY, it does not seem likely that the significant dif-ferences in d between these sites reflect a change in the in-teractions between these organisms.
Finally, viruses undoubtedly contribute to the observed variation in bacterial abundances, with previous studies re-porting viral lysis to be an equally if not more impor-tant factor in controlling prokaryote mortality than grazing alone in the surface waters in the open ocean, with protis-tan grazing only becoming dominant in the DCM layer (Lara et al., 2017). Indeed, d values were smaller in Zl
(includ-ing the DCM) than in Zu in all three regions investigated
in the WTSP. However, the relationship presented by Lara et al. (2017) between protist-mediated mortality and virus-mediated mortality is very large along the 1 : 1 line, making it difficult to infer how viral lysis might have contributed to the reported differences in d.
5 Conclusions
Our results demonstrate the distribution of microorganisms in the WTSP to be qualitatively similar to those reported for other highly stratified oligotrophic regions. The entire tran-sect length was characterized by a two-tier vertical niche par-tition, with Prochlorococcus and Synechococcus achieving abundance maxima in the Zu, and PPE achieving abundance
maxima in the Zl, at depths coincident with the DCM. The
strong relationships between N2 fixation and primary
pro-ducers demonstrate the central role of N2fixation in
regu-lating ecosystem processes in the WTSP, with the influence of biologically fixed nitrogen being exerted across all depths and across all classes of organisms in the study region. At MA and LDB, increases in N2fixation rates are accompanied
by increased production near the surface, and by increased abundances of Synechococcus relative to Prochlorococcus. At GY, the marked decrease in N2fixation rates is
accom-panied by greatly reduced phytoplankton abundances, which may translate directly into reduced proportions of HNA bac-teria. This shift is coincident with a decoupling of HNF and bacteria populations at GY, suggesting a reduction in the im-portance of top–down controls in regulating bacteria
abun-dance under nutrient-limited conditions. In the lower eu-photic zone, these changes may also influence the amount and the quality of nutrients available to PPE communities, influencing both the diversity and vertical distributions of the organisms they comprise.
Data availability. All data and metadata are available at the French INSU/CNRS LEFE CYBER database (scientific coor-dinator: Hervé Claustre; data manager and webmaster: Cather-ine Schmechtig) at the following web address: http://www.obs-vlfr. fr/proof/php/outpace/outpace.php (INSU/CNRS LEFE CYBER, 2018).
Competing interests. The authors declare that they have no conflict of interest.
Special issue statement. This article is part of the special issue “In-teractions between planktonic organisms and biogeochemical cy-cles across trophic and N2fixation gradients in the western tropical
South Pacific Ocean: a multidisciplinary approach (OUTPACE ex-periment)”. It is not associated with a conference.
Acknowledgements. This is a contribution of the OUTPACE project (https://outpace.mio.univ-amu.fr/, last access: 7 May 2018) funded by the French research national agency (ANR-14-CE01-0007-01), the LEFE-CyBER program (CNRS-INSU), the GOPS program (IRD) and the CNES. We thank Thierry Moutin and Sophie Bonnet, chief scientists of the OUTPACE cruise. We are indebted to Olivier Grosso and Sandra Helias-Nunige for nutrient measurements, to Sophie Bonnet for N2 fixation measurements,
to Joséphine Ras for HPLC pigment measurements, and to Gilles Rougier and Marc Picheral for their help in CTD rosette management and data processing. We are grateful to the crew of the R/V L’Atalante for outstanding shipboard operation. The National Science Foundation (NSF) OCE-1434916 award to Solange Duhamel supported Solange Duhamel and Moïra Dion; the NSF OCE-1458070 award to Solange Duhamel supported Nicholas Bock. The acquisition of BIOSOPE data was funded through CNRS-INSU grants. This study uses data from the Atlantic Meridional Transect Consortium (NER/0/5/2001/00680), provided by the British Oceanographic Data Centre and supported by the Natural Environment Research Council.
Edited by: Sophie Bonnet
Reviewed by: two anonymous referees
References
Andrade, L., Gonzalez, A. M., Rezende, C. E., Suzuki, M., Valentin, J. L., and Paranhos, R.: Distribution of HNA and LNA bacterial groups in the Southwest Atlantic Ocean, Braz. J. Microbiol., 38, 330–336, https://doi.org/10.1590/S1517-83822007000200028, 2007.
Barlow, R. G., Mantoura, R. F. C., Cummings, D. G., and Fileman, T. W.: Pigment chemotaxonomic distributions of phytoplankton during summer in the western Mediterranean, Deep-Sea Res. Pt. II, 44, 833–850, https://doi.org/10.1016/S0967-0645(96)00089-6, 1997.
Blanchot, J. and Rodier, M.: Picophytoplankton abundance and biomass in the western tropical Pacific Ocean during the 1992 El Nino year: Results from flow cytometry, Deep-Sea Res. Pt. I, 43, 877–895, https://doi.org/10.1016/0967-0637(96)00026-X, 1996.
Bonnet, S., Berthelot, H., Turk-Kubo, K., Cornet-Barthaux, V., Fawcett, S., Berman-Frank, I., Barani, A., Grégori, G., Dekaezemacker, J., Benavides, M., and Capone, D. G.: Dia-zotroph derived nitrogen supports diatom growth in the South West Pacific: A quantitative study using nanoSIMS, Limnol. Oceanogr., 61, 1549–1562, https://doi.org/10.1002/lno.10300, 2016a.
Bonnet, S., Moutin, T., Rodier, M., Grisoni, J. M., Louis, F., Folcher, E., Bourgeois, B., Boré, J. M., and Renaud, A.: Introduction to the project VAHINE: VAriability of vertical and tropHIc transfer of diazotroph derived N in the south wEst Pacific, Biogeosciences, 13, 2803–2814, https://doi.org/10.5194/bg-13-2803-2016, 2016b.
Bonnet, S., Caffin, M., Berthelot, H., Grosso, O., Benavides, M., Helias-Nunige, S., Guieu, C., Stenegren, M., and Foster, R. A.: In depth characterization of diazotroph activity across the Western Tropical South Pacific hot spot of N2fixation, Biogeosciences
Discuss., https://doi.org/10.5194/bg-2017-567, in review, 2018. Brum, J. R., Ignacio-Espinoza, J. C., Roux, S., Doulcier,
G., Acinas, S. G., Alberti, A., and Chaffron, S.: Ocean Viral Communities, Science, 348, 1261498, https://doi.org/10.1126/science.1261498, 2015.
Caffin, M., Berthelot, H., Cornet-Barthaux, V., Barani, A., and Bon-net, S.: Transfer of diazotroph-derived nitrogen to the planktonic food web across gradients of N2fixation activity and diversity in the western tropical South Pacific Ocean, Biogeosciences, 15, 3795–3810, https://doi.org/10.5194/bg-15-3795-2018, 2018. Campbell, L. and Vaulot, D.: Photosynthetic picoplankton
com-munity structure in the subtropical North Pacific Ocean near Hawaii (station ALOHA), Deep-Sea Res. Pt. I, 40, 2043–2060, https://doi.org/10.1016/0967-0637(93)90044-4, 1993.
Campbell, L., Landry, M. R., Constantinou, J., Nolla, H. A., Brown, S. L., Liu, H., and Caron, D. A.: Response of microbial commu-nity structure to environmental forcing in the Arabian Sea, Deep-Sea Res. Pt. II, 45, 2301–2325, https://doi.org/10.1016/S0967-0645(98)00072-1, 1998.
Carlson, C., del Giorgio, P., and Herndl, G.: Microbes and the Dissipation of Energy and Respiration: From Cells to Ecosystems, Oceanography, 20, 89–100, https://doi.org/10.5670/oceanog.2007.52, 2007.
Casey, J. R., Lomas, M. W., Mandecki, J., and Walker, D. E.: Prochlorococcus contributes to new poduction in the Sargasso Sea deep chlorophyll maximum, Geophys. Res. Lett., 34, 1–5, https://doi.org/10.1029/2006GL028725, 2007.
Chisholm, S. W., Olson, R. J., Zettler, E. R., Goericke, R., Wa-terbury, J. B., and Welschmeyer, N. A.: A novel free-living prochlorophyte abundant in the oceanic euphotic zone, Nature, 334, 340–343, https://doi.org/10.1038/334340a0, 1988.
Christaki, U.: Nanoflagellate predation on auto- and heterotrophic picoplankton in the oligotrophic Mediterranean Sea, J. Plankton Res., 23, 1297–1310, https://doi.org/10.1093/plankt/23.11.1297, 2001.
Christaki, U., Van Wambeke, F., and Dolan, J. R.: Nanoflagellates (mixotrophs, heterotrophs and autotrophs) in the oligotrophic eastern Mediterranean: Standing stocks, bacterivory and relation-ships with bacterial production, Mar. Ecol.-Prog. Ser., 181, 297– 307, https://doi.org/10.3354/meps181297, 1999.
Christaki, U., Courties, C., Massana, R., Catala, P., Lebaron, P., Gasol, J. M., and Zubkov, M. V.: Optimized routine flow cytometric enumeration of heterotrophic flagellates us-ing SYBR Green I, Limnol. Oceanogr.-Meth., 9, 329–339, https://doi.org/10.4319/lom.2011.9.329, 2011.
Claustre, H., Kerherve, P., Marty, J. C., Prieur, L., Videau, C., and Hecq, J. H.: Phytoplankton Dynamics Associ-ated With a Geostrophic Front – Ecological and Bio-geochemical Implications, J. Mar. Res., 52, 711–742, https://doi.org/10.1357/0022240943077000, 1994.
Cuevas, L. A. and Morales, C. E.: Nanoheterotroph grazing on bac-teria and cyanobacbac-teria in oxic and suboxic waters in coastal up-welling areas off northern Chile, J. Plankton Res., 28, 385–397, https://doi.org/10.1093/plankt/fbi124, 2006.
Denis, M., Thyssen, M., Martin, V., Manca, B., and Vidussi, F.: Ul-traphytoplankton basin-scale distribution in the eastern Mediter-ranean Sea in winter: Link to hydrodynamism and nutrients, Bio-geosciences, 7, 2227–2244, https://doi.org/10.5194/bg-7-2227-2010, 2010.
de Verneil, A., Rousselet, L., Doglioli, A. M., Petrenko, A. A., and Moutin, T.: The fate of a southwest Pacific bloom: gauging the impact of submesoscale vs. mesoscale circulation on biologi-cal gradients in the subtropics, Biogeosciences, 14, 3471–3486, https://doi.org/10.5194/bg-14-3471-2017, 2017.
de Verneil, A., Rousselet, L., Doglioli, A. M., Petrenko, A. A., Maes, C., Bouruet-Aubertot, P., and Moutin, T.: OUTPACE long duration stations: physical variability, context of biogeochemical sampling, and evaluation of sampling strategy, Biogeosciences, 15, 2125–2147, https://doi.org/10.5194/bg-15-2125-2018, 2018. Dolan, J. R., Gimenez, A., Cornet-Barthaux, V., and de Verneil, A.: Community Structure of Tintinnid Ciliates of the Mi-crozooplankton in the South East Pacific Ocean: Com-parison of a High Primary Productivity with a Typical Oligotrophic Site, J. Eukaryot. Microbiol., 63, 813–822, https://doi.org/10.1111/jeu.12328, 2016.
Dore, J. E., Letelier, R. M., Church, M. J., Lukas, R., and Karl, D. M.: Summer phytoplankton blooms in the olig-otrophic North Pacific Subtropical Gyre: Historical perspec-tive and recent observations, Prog. Oceanogr., 76, 2–38, https://doi.org/10.1016/j.pocean.2007.10.002, 2008.
Ducklow, H.: Bacterial Production and Biomass in the Oceans, in: Microbial Ecology of the Ocean, edited by: Kirchman, D., 4, 1– 47, Wiley, New York, 2002.
Ducklow, H. W.: Factors regulating bottom-up control of bacteria biomass in open ocean plankton communities, Arch. Hydrobiol. Beih. Ergebn. Limnol., 37, 207–217, 1992.
Duhamel, S., Björkman, K. M., Doggett, J. K., and Karl, D. M.: Microbial response to enhanced phosphorus cycling in the North Pacific Subtropical Gyre, Mar. Ecol.-Prog. Ser., 504, 43–58, https://doi.org/10.3354/meps10757, 2014.