HAL Id: inserm-00663671
https://www.hal.inserm.fr/inserm-00663671
Submitted on 27 Jan 2012
HAL is a multi-disciplinary open access
archive for the deposit and dissemination of
sci-entific research documents, whether they are
pub-lished or not. The documents may come from
teaching and research institutions in France or
abroad, or from public or private research centers.
L’archive ouverte pluridisciplinaire HAL, est
destinée au dépôt et à la diffusion de documents
scientifiques de niveau recherche, publiés ou non,
émanant des établissements d’enseignement et de
recherche français ou étrangers, des laboratoires
publics ou privés.
breast tumorigenicity, and a two-gene signature for
aneuploidy
Ivan Bièche, Sophie Vacher, François Lallemand, Sengül Tozlu-Kara, Hind
Bennani, Michèle Beuzelin, Keltouma Driouch, Etienne Rouleau, Florence
Lerebours, Hugues Ripoche, et al.
To cite this version:
Ivan Bièche, Sophie Vacher, François Lallemand, Sengül Tozlu-Kara, Hind Bennani, et al.. Expression
analysis of mitotic spindle checkpoint genes in breast carcinoma: role of NDC80/HEC1 in early breast
tumorigenicity, and a two-gene signature for aneuploidy. Molecular Cancer, BioMed Central, 2011, 10
(1), pp.23. �10.1186/1476-4598-10-23�. �inserm-00663671�
R E S E A R C H
Open Access
Expression analysis of mitotic spindle checkpoint
genes in breast carcinoma: role of NDC80/HEC1
in early breast tumorigenicity, and a two-gene
signature for aneuploidy
Ivan Bièche
1,2*, Sophie Vacher
1, François Lallemand
1, Sengül Tozlu-Kara
1, Hind Bennani
1, Michèle Beuzelin
1,
Keltouma Driouch
1, Etienne Rouleau
1, Florence Lerebours
1, Hugues Ripoche
3, Géraldine Cizeron-Clairac
1,
Frédérique Spyratos
1, Rosette Lidereau
1Abstract
Background: Aneuploidy and chromosomal instability (CIN) are common abnormalities in human cancer.
Alterations of the mitotic spindle checkpoint are likely to contribute to these phenotypes, but little is known about somatic alterations of mitotic spindle checkpoint genes in breast cancer.
Methods: To obtain further insight into the molecular mechanisms underlying aneuploidy in breast cancer, we used real-time quantitative RT-PCR to quantify the mRNA expression of 76 selected mitotic spindle checkpoint genes in a large panel of breast tumor samples.
Results: The expression of 49 (64.5%) of the 76 genes was significantly dysregulated in breast tumors compared to normal breast tissues: 40 genes were upregulated and 9 were downregulated. Most of these changes in gene expression during malignant transformation were observed in epithelial cells.
Alterations of nine of these genes, and particularly NDC80, were also detected in benign breast tumors, indicating that they may be involved in pre-neoplastic processes.
We also identified a two-gene expression signature (PLK1 + AURKA) which discriminated between DNA aneuploid and DNA diploid breast tumor samples. Interestingly, some DNA tetraploid tumor samples failed to cluster with DNA aneuploid breast tumors.
Conclusion: This study confirms the importance of previously characterized genes and identifies novel candidate genes that could be activated for aneuploidy to occur. Further functional analyses are required to clearly confirm the role of these new identified genes in the molecular mechanisms involved in breast cancer aneuploidy. The novel genes identified here, and/or the two-gene expression signature, might serve as diagnostic or prognostic markers and form the basis for novel therapeutic strategies.
Introduction
A very large proportion of cancers consist of cells with an abnormal chromosome content, a feature known as aneuploidy [1]. Aneuploidy is often associated with chromosomal instability (CIN), a condition in which cancer cells show a high rate of chromosomal gain and loss compared with normal cells.
The mechanisms underlying CIN, although poorly understood, are likely to include defects in the mitotic machinery used to segregate duplicated chromosomes between daughter cells [2]. Mounting evidence points to the mitotic spindle checkpoint as the point of failure in CIN. The normal function of the spindle checkpoint is to ensure that all chromosomes are correctly aligned in metaphase cells and properly attached to the mitotic spindle before chromosome separation can proceed. Like other phenotypes characteristic of cancer, it was
* Correspondence: ivan.bieche@curie.net
1
INSERM U735, St-Cloud, F-92210, France. Institut Curie Hôpital René Huguenin, FNCLCC, St-Cloud, F-92210, France
Full list of author information is available at the end of the article
© 2011 Bièche et al; licensee BioMed Central Ltd. This is an Open Access article distributed under the terms of the Creative Commons Attribution License (http://creativecommons.org/licenses/by/2.0), which permits unrestricted use, distribution, and reproduction in any medium, provided the original work is properly cited.
first thought that nucleotide mutations in genes that control chromosome stability were responsible for CIN. However, somatic point mutations in mitotic-spindle-checkpoint genes, including MAD1, BUB1 and BUBR1/ BUB1B, are infrequent [3]. One possible explanation for this paradox is that mitotic-spindle-checkpoint genes are mainly altered at the transcriptional level. Indeed, amplification and overexpression of AURKA (which encodes aurora-A kinase) have been observed in breast tumors and other cancers exhibiting aneuploidy [4]. PLK1and NEK2 mRNA and protein expression is also elevated in a wide variety of tumors and cancer cell lines [5,6]. However, despite the importance of the mito-tic spindle checkpoint in CIN, no detailed analyses of mitotic spindle checkpoint gene expression in tumors has yet been performed.
The recent development of effective tools for large-scale analysis of gene expression is providing new insights into the involvement of gene networks and regulatory pathways in various tumor processes [7]. It has also led to the dis-covery of new diagnostic and prognostic indicators, and to the identification of new molecular targets for drug devel-opment [8]. These tools include cDNA microarrays, which can be used to explore the expression of thousands of genes at a time, and real-time RT-PCR assays for more accurate quantitative studies of the expression of a smaller number of selected candidate genes.
As aneuploidy is common in breast cancer and is associated with a poor prognosis [9], we examined the expression of selected mitotic spindle checkpoint genes in breast tumors. We used real-time quantitative RT-PCR to measure the mRNA expression of a large num-ber of selected genes in DNA aneuploid breast tumor samples, in comparison with DNA diploid breast tumor samples. We assessed the expression level of 76 genes known to be involved in various molecular mechanisms associated with the mitotic spindle checkpoint (Table 1). We identified nine genes involved in early breast tumor-igenesis, and also a two-gene expression signature (PLK1 + AURKA) associated with aneuploid status.
Results
MRNA expression of 76 mitotic-spindle-checkpoint genes in invasive breast tumors relative to normal breast tissue
To select for further study those mitotic-spindle-check-point genes whose expression is dysregulated in breast tumors, we quantified the mRNA expression of the 76 selected genes in 10 invasive breast tumors relative to 5 normal breast tissues.
MRNA of all 76 genes was reliably quantifiable by means of real-time quantitative RT-PCR (Ct < 35) in both invasive breast tumors and normal breast tissues.
Forty (52.6%) of the 76 genes were significantly upre-gulated (P < 0.05) in the invasive breast tumors
compared to the normal breast tissues (Table 2). The expression of 20 of these 40 upregulated genes was markedly higher (> 3-fold) in the breast tumors. The most strongly upregulated gene was NEK2 (29-fold).
In contrast, only 9 (11.8%) of the 76 genes were signif-icantly down-regulated (P < 0.05) in the invasive breast tumors compared to the normal breast tissues, and none showed markedly lower expression (> 3-fold) in the breast tumors.
Relationship between the mRNA expression of the 20 markedly upregulated genes and steps of breast tumor progression
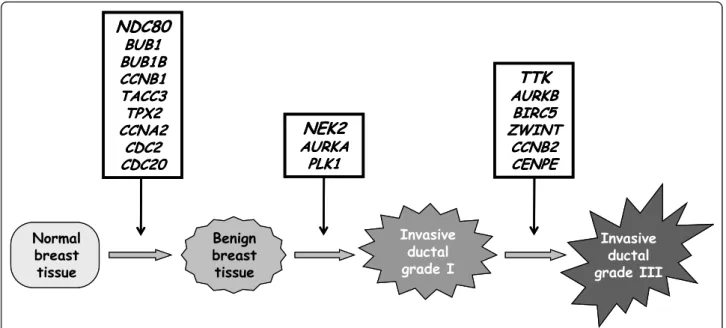
To determine whether the 20 genes showing marked upregulation (> 3-fold) in the invasive breast tumors are altered at an early step of breast tumorigenicity, we ana-lyzed their mRNA expression in 9 normal breast tissues, 14 benign breast tumors, 14 ductal carcinoma in situ (DCIS) of the breast, 11 invasive ductal grade I breast tumors and 12 invasive ductal grade III breast tumors (Table 3).
The mRNA levels of 9 of the 20 selected genes (i.e. NDC80, BUB1, BUB1B, CCNB1, TACC3, TPX2, CCNA2, CDC2and CDC20) was significantly increased in the benign breast tumors as compared to the normal breast tissues (Table 3). NDC80 was the gene with the strongest upregulation (3.6-fold).
With the exception of CCNB3, the expression of all 20 genes increased from benign breast tumors to DCIS.
Only TACC3, NEK2, AURKA and PLK1 expression increased from benign breast tumors to invasive ductal grade I breast tumors, while expression of all 20 genes (except CCNB3 and UBD) increased from grade I to ductal grade III breast tumors.
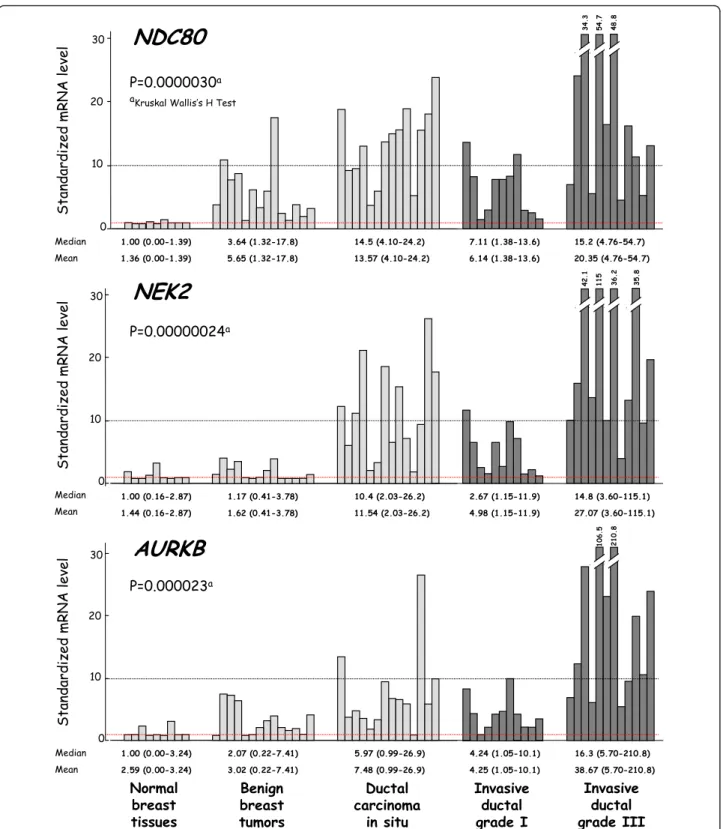
Figure 1 shows the mRNA levels of three characteris-tic genes (NDC80, NEK2 and AURKB) in the different sample types. Figure 2 shows the order in which these genes are dysregulated during the different steps of breast tumor progression.
In the same set of 60 samples, we also examined the expression of the proliferation-associated gene MKI67, which encodes the proliferation-related antigen Ki-67. MKI67only showed significant overexpression in ductal carcinoma in situ (DCIS) and invasive ductal grade III breast tumors (Table 3).
MRNA expression of the 20 markedly upregulated genes in breast cancer cell lines and in primary cultures of epithelial cells and fibroblasts from normal breast tissues and breast tumor cells
To determine in which tumor cell type (epithelial cells or stromal cells) the mitotic-spindle-checkpoint genes were upregulated, we measured the RNA levels of the 20 markedly upregulated genes in 12 breast cancer cell
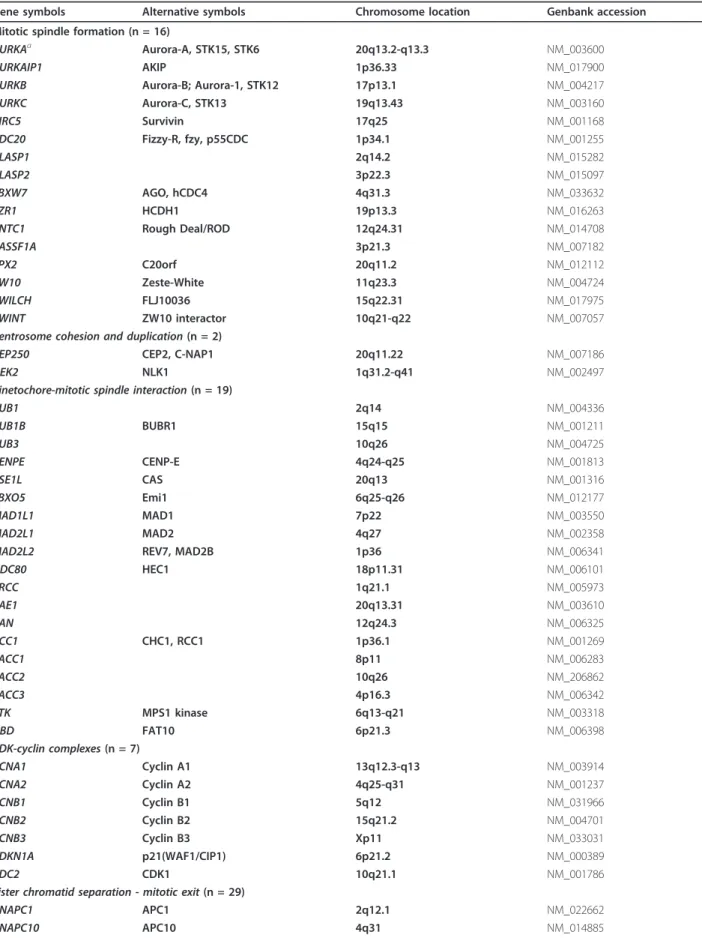
Table 1 List of the 76 selected genes
Gene symbols Alternative symbols Chromosome location Genbank accession Mitotic spindle formation (n = 16)
AURKAa Aurora-A, STK15, STK6 20q13.2-q13.3 NM_003600
AURKAIP1 AKIP 1p36.33 NM_017900 AURKB Aurora-B; Aurora-1, STK12 17p13.1 NM_004217 AURKC Aurora-C, STK13 19q13.43 NM_003160 BIRC5 Survivin 17q25 NM_001168 CDC20 Fizzy-R, fzy, p55CDC 1p34.1 NM_001255 CLASP1 2q14.2 NM_015282 CLASP2 3p22.3 NM_015097 FBXW7 AGO, hCDC4 4q31.3 NM_033632 FZR1 HCDH1 19p13.3 NM_016263 KNTC1 Rough Deal/ROD 12q24.31 NM_014708 RASSF1A 3p21.3 NM_007182 TPX2 C20orf 20q11.2 NM_012112 ZW10 Zeste-White 11q23.3 NM_004724 ZWILCH FLJ10036 15q22.31 NM_017975 ZWINT ZW10 interactor 10q21-q22 NM_007057 Centrosome cohesion and duplication (n = 2)
CEP250 CEP2, C-NAP1 20q11.22 NM_007186 NEK2 NLK1 1q31.2-q41 NM_002497 Kinetochore-mitotic spindle interaction (n = 19)
BUB1 2q14 NM_004336 BUB1B BUBR1 15q15 NM_001211 BUB3 10q26 NM_004725 CENPE CENP-E 4q24-q25 NM_001813 CSE1L CAS 20q13 NM_001316 FBXO5 Emi1 6q25-q26 NM_012177 MAD1L1 MAD1 7p22 NM_003550 MAD2L1 MAD2 4q27 NM_002358
MAD2L2 REV7, MAD2B 1p36 NM_006341
NDC80 HEC1 18p11.31 NM_006101 PRCC 1q21.1 NM_005973 RAE1 20q13.31 NM_003610 RAN 12q24.3 NM_006325 RCC1 CHC1, RCC1 1p36.1 NM_001269 TACC1 8p11 NM_006283 TACC2 10q26 NM_206862 TACC3 4p16.3 NM_006342 TTK MPS1 kinase 6q13-q21 NM_003318 UBD FAT10 6p21.3 NM_006398 CDK-cyclin complexes (n = 7) CCNA1 Cyclin A1 13q12.3-q13 NM_003914 CCNA2 Cyclin A2 4q25-q31 NM_001237 CCNB1 Cyclin B1 5q12 NM_031966 CCNB2 Cyclin B2 15q21.2 NM_004701 CCNB3 Cyclin B3 Xp11 NM_033031 CDKN1A p21(WAF1/CIP1) 6p21.2 NM_000389 CDC2 CDK1 10q21.1 NM_001786
Sister chromatid separation - mitotic exit (n = 29)
ANAPC1 APC1 2q12.1 NM_022662
lines (five ERa-positive and seven ERa-negative cell lines). As compared to normal breast tissues, all 20 selected genes (except UBD) showed marked upregula-tion in the 12 breast cancer cell lines (median 3.9- to 87-fold), suggesting that these 19 genes are expressed in epithelial cells and upregulated in tumor epithelial cells (Table 4).
Interestingly, the expression of these genes was gener-ally higher in ERa-negative breast tumor cell lines than in ERa-positive lines. Despite the small number of cell lines analysed, seven genes (AURKB, TPX2, CDC20, BUB1, CCNA2, AURKA, and CCNB1) were upregulated significantly (p < 0.05) more strongly in the ERa-nega-tive cell lines. These genes are probably not estrogen-regulated, but are rather upregulated mainly in undiffer-entiated breast tumors (i.e. ERa-negative tumors), inde-pendently of ERa status. Individual expression levels of these genes in the 12 breast tumor cell lines are shown in Additional File 1.
As tumors are composed not only of tumor epithelial cells but also of fibroblasts (the main cell type of the stro-mal compartment), we also measured the expression of the same 20 genes in primary cultures of epithelial cells and fibroblasts from normal breast tissues and breast tumor cells. We confirmed that these genes were expressed in epithelial cells and, to a lesser extent, in stromal fibroblasts, and that they were all upregulated in tumor epithelial cells, as compared to normal epithelial cells (Table 4).
Relationship between the mRNA expression level and DNA amplification level of the 20 markedly upregulated genes
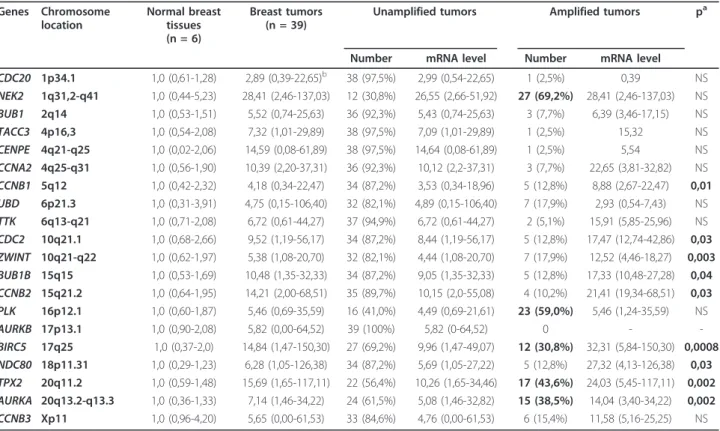
One of the 20 markedly upregulated genes (AURKA) has previously been shown to be upregulated by a DNA amplification mechanism [4]. Thus, to obtain further insight into the molecular mechanisms leading to over-expression of these 20 markedly upregulated genes, we used both real-time quantitative RT-PCR and high
Table 1 List of the 76 selected genes (Continued)
ANAPC11 APC11 17q25.3 NM_016476 ANAPC2 APC2 9q34.3 NM_013366 ANAPC4 APC4 4p15.2 NM_013367 ANAPC5 APC5 12q24.31 NM_016237 ANAPC7 APC7 12q13.12 NM_016238 CDC16 APC6 13q34 NM_003903 CDC23 APC8 5q31 NM_004661 CDC26 9q32 NM_139286 CDC27 APC3 17q12-17q23.2 NM_001256 CDC34 19p13.3 NM_004359 ESPL1 Separase 12q13 NM_012291 HSPB1 HSP27 7q11.23 NM_001540 NEDD8 14q11.2 NM_006156 PLK1 Polo-like kinase 1 16p12.1 NM_005030 PPP1CA PPP1A 11q13 NM_002708 PPP1R2 Inh2 3q29 NM_006241 PTTG1 Securin 5q35.1 NM_004219 RAD21 SCC1, KIAA0078 8q24 NM_006265 RNF2 Ding 1q25.3 NM_007212 SMC1A SMC1L1 Xp11.22-p11.21 NM_006306 SMC1B SMC1L2 22q13.31 NM_148674 SMC3 CSPG6 10q25 NM_005445
STAG1 SA1 (stromal antigen 1) 3q22.2 NM_005862 STAG2 SA2 (stromal antigen 2) Xq25 NM_006603 UBE1C UBA3 3p24.3-p13 NM_003968 UBE2B UBE2B 5q23q-31 NM_003337
UBE2N 12q22 NM_003348
Double-strand break repair (n = 3)
MRE11A MRE11 11q21 NM_005590
BRCA1 17q21 NM_007294
BRCA2 13q12.3 NM_000059
resolution array CGH to quantify the mRNA expression and DNA amplication of these genes in a series of 39 breast tumors (Table 5). Five of these genes (NEK2, PLK, BIRC5, TPX2and AURKA) displayed DNA amplifi-cation (or polysomy) in more than 30% of breast tumors. Interesting, 3 of these 5 genes (BIRC5, TPX2 and AURKA) showed significantly higher mRNA levels in amplified tumors than in unamplified tumors. It is noteworthy that the other two genes (NEK2 and PLK), that showed similar mRNA levels in amplified and unamplified breast tumors, are located on chromosome arms (1q and 16p, respectively) showing polysomy and no DNA amplification in breast tumors [10,11].
MRNA expression of the 49 dysregulated genes in 23 individual DNA aneuploid breast tumors and 24 DNA diploid breast tumors
The expression level of the 49 dysregulated genes identi-fied in our screening study was then determined in a
Table 2 mRNA expression of 76 mitotic-spindle-checkpoint genes in invasive breast tumors relative to normal breast tissues
Genes Normal breast tissues (n = 5)
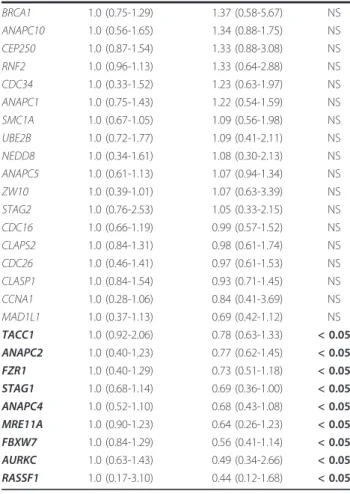
Invasive breast tumors (n = 10) pa NEK2 1.0 (0.44-2.23) 28.79 (7.41-162.02)b < 0.01 UBD 1.0 (0.31-1.91) 16.95 (1.38-42.32) < 0.01 TPX2 1.0 (0.59-1.48) 13.01 (5.51-144.34) < 0.01 CENPE 1.0 (0.02-2.06) 11.01 (2.41-42.62) < 0.01 CCNB2 1.0 (0.64-1.95) 10.36 (3.14-73.18) < 0.01 BIRC5 1.0 (0.37-2.00) 9.45 (3.64-136.55) < 0.01 NCD80 1.0 (0.29-1.23) 9.24 (2.08-114.83) < 0.01 BUB1 1.0 (0.53-1.51) 8.52 (2.22-58.49) < 0.01 CCNA2 1.0 (0.56-1.90) 8.08 (4.10-52.35) < 0.01 CDC2 1.0 (0.68-1.66) 7.62 (2.59-44.74) < 0.01 BUB1B 1.0 (0.53-1.69) 7.44 (2.47-35.02) < 0.01 TTK 1.0 (0.71-2.08) 6.47 (1.27-36.76) < 0.01 AURKB 1.0 (0.90-2.08) 5.56 (2.02-81.20) < 0.01 PLK1 1.0 (0.60-1.87) 5.52 (2.72-44.53) < 0.01 AURKA 1.0 (0.36-1.33) 4.76 (3.00-39.85) < 0.01 TACC3 1.0 (0.54-2.08) 4.70 (1.73-21.06) < 0.01 CCNB3 1.0 (0.96-4.20) 4.62 (0.80-39.31) < 0.05 ZWINT 1.0 (0.62-1.97) 4.28 (1.78-21.76) < 0.01 CCNB1 1.0 (0.42-2.32) 4.03 (1.10-15.63) < 0.01 CDC20 1.0 (0.61-1.28) 3.51 (0.89-21.21) < 0.05 PRCC 1.0 (0.70-1.27) 2.70 (2.27-4.87) < 0.01 CDKN1A 1.0 (0.61-2.57) 2.43 (1.04-5.59) < 0.05 RAN 1.0 (0.59-1.92) 2.42 (1.23-6.57) < 0.01 ESPL1 1.0 (0.34-1.85) 2.27 (1.23-8.79) < 0.05 PTTG1 1.0 (0.82-1.35) 2.25 (1.61-11.24) < 0.01 KNTC1 1.0 (0.71-1.30) 2.21 (0.80-4.83) < 0.05 BRCA2 1.0 (0.70-1.41) 2.17 (0.68-5.86) < 0.05 RAE1 1.0 (0.81-1.48) 2.16 (1.37-3.48) < 0.01 MAD2L1 1.0 (0.65-1.30) 2.11 (1.16-5.25) < 0.01 AURKAIP1 1.0 (0.94-1.59) 1.96 (1.30-4.68) < 0.01 PPP1CA 1.0 (0.65-1.55) 1.95 (1.47-3.31) < 0.01 BUB3 1.0 (0.65-1.20) 1.87 (1.27-5.64) < 0.01 ANAPC7 1.0 (0.61-1.32) 1.77 (1.59-2.36) < 0.01 CDC27 1.0 (0.57-1.36) 1.67 (1.19-2.32) < 0.01 ZWILCH 1.0 (0.88-1.33) 1.63 (0.75-3.93) < 0.05 PPP1R2 1.0 (067-1.18) 1.55 (0.81-2.06) < 0.05 MAD2L2 1.0 (0.37-1.20) 1.45 (0.69-7.28) < 0.05 UBE1C 1.0 (0.84-1.03) 1.40 (1.07-1.93) < 0.01 UBE2N 1.0 (0.77-1.09) 1.31 (1.29-2.83) < 0.01 CDC23 1.0 (0.71-1.18) 1.21 (0.79-1.53) < 0.05 SMC1B 1.0 (0.43-1.81) 2.89 (0.07-10.65) NS HSPB1 1.0 (0.66-1.47) 2.03 (0.66-6.79) NS TACC2 1.0 (0.94-2.30) 1.70 (0.69-4.27) NS ANAPC11 1.0 (0.13-2.41) 1.65 (0.80-3.95) NS CSE1L 1.0 (0.61-1.23) 1.59 (0.75-3.87) NS RAD21 1.0 (0.71-1.17) 1.58 (0.57-8.38) NS SMC3 1.0 (0.71-1.45) 1.56 (0.59-3.26) NS RCC1 1.0 (0.39-1.68) 1.54 (0.87-3.75) NS FBXO5 1.0 (0.42-1.35) 1.50 (0.65-4.52) NS
Table 2 mRNA expression of 76 mitotic-spindle-check-point genes in invasive breast tumors relative to normal breast tissues (Continued)
BRCA1 1.0 (0.75-1.29) 1.37 (0.58-5.67) NS ANAPC10 1.0 (0.56-1.65) 1.34 (0.88-1.75) NS CEP250 1.0 (0.87-1.54) 1.33 (0.88-3.08) NS RNF2 1.0 (0.96-1.13) 1.33 (0.64-2.88) NS CDC34 1.0 (0.33-1.52) 1.23 (0.63-1.97) NS ANAPC1 1.0 (0.75-1.43) 1.22 (0.54-1.59) NS SMC1A 1.0 (0.67-1.05) 1.09 (0.56-1.98) NS UBE2B 1.0 (0.72-1.77) 1.09 (0.41-2.11) NS NEDD8 1.0 (0.34-1.61) 1.08 (0.30-2.13) NS ANAPC5 1.0 (0.61-1.13) 1.07 (0.94-1.34) NS ZW10 1.0 (0.39-1.01) 1.07 (0.63-3.39) NS STAG2 1.0 (0.76-2.53) 1.05 (0.33-2.15) NS CDC16 1.0 (0.66-1.19) 0.99 (0.57-1.52) NS CLAPS2 1.0 (0.84-1.31) 0.98 (0.61-1.74) NS CDC26 1.0 (0.46-1.41) 0.97 (0.61-1.53) NS CLASP1 1.0 (0.84-1.54) 0.93 (0.71-1.45) NS CCNA1 1.0 (0.28-1.06) 0.84 (0.41-3.69) NS MAD1L1 1.0 (0.37-1.13) 0.69 (0.42-1.12) NS TACC1 1.0 (0.92-2.06) 0.78 (0.63-1.33) < 0.05 ANAPC2 1.0 (0.40-1.23) 0.77 (0.62-1.45) < 0.05 FZR1 1.0 (0.40-1.29) 0.73 (0.51-1.18) < 0.05 STAG1 1.0 (0.68-1.14) 0.69 (0.36-1.00) < 0.05 ANAPC4 1.0 (0.52-1.10) 0.68 (0.43-1.08) < 0.05 MRE11A 1.0 (0.90-1.23) 0.64 (0.26-1.23) < 0.05 FBXW7 1.0 (0.84-1.29) 0.56 (0.41-1.14) < 0.05 AURKC 1.0 (0.63-1.43) 0.49 (0.34-2.66) < 0.05 RASSF1 1.0 (0.17-3.10) 0.44 (0.12-1.68) < 0.05
aMann and Whitney’s U Test.
bMedian (range) of gene mRNA levels. The mRNA levels of the tumor samples were normalized such that the median of the 5 normal breast tissues mRNA levels was 1.
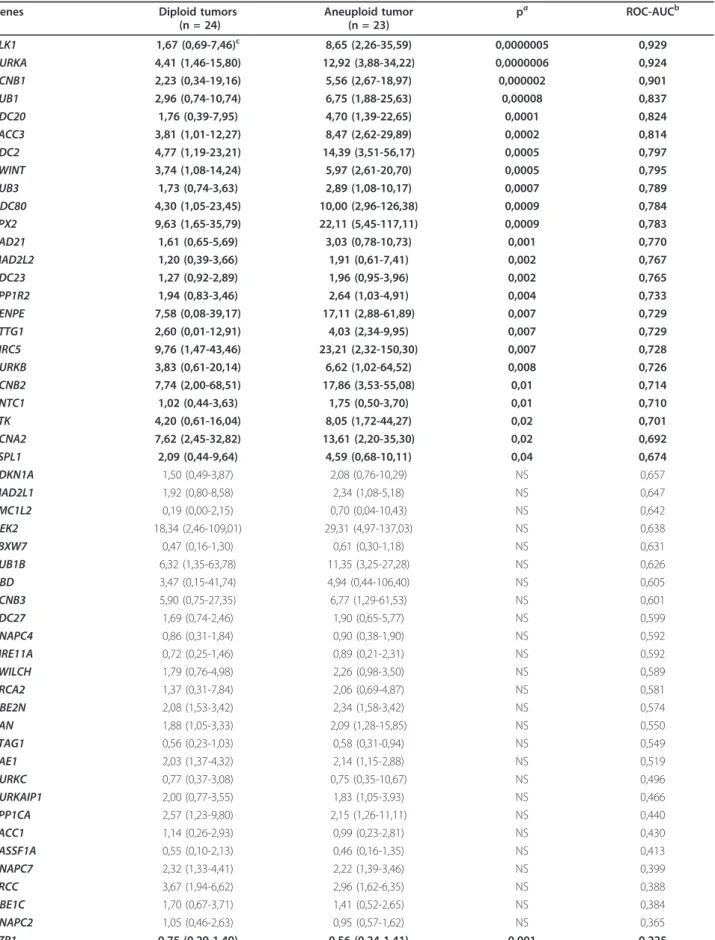
series of 23 DNA aneuploid breast tumors and 24 DNA diploid breast tumors (Table 6).
Twenty-four (49.0%) of the 49 dysregulated genes were significantly upregulated in the 23 DNA aneuploid breast tumors relative to the DNA diploid breast tumors, while only one gene (FZR1) among the 49 dysregulated genes was significantly down-regulated (P < 0.05; Table 7).
In the same set of 47 samples, we examined the expres-sion of MKI67 and ESR1/ERa. As CIN of cancer cells could also be caused by telomere erosion [12], we exam-ined the expression of the TERT gene encoding telomer-ase reverse transcripttelomer-ase. MKI67 and TERT were significantly upregulated in the 23 DNA aneuploid breast tumors, while ESR1/ERa expression was similar in the diploid and aneuploid breast tumor subgroups (Table 7).
Prediction Analysis for Microarrays (PAM) and Class Prediction results obtained with the BRB Array Tools software packages were then used to identify a gene expression signature capable of discriminating between DNA aneuploid and DNA diploid breast tumors. Class Prediction identified a signature composed of 8 genes (PLK1, AURKA, CCNB1, BUB1, TACC3, CDC20, CDC2 and TPX2), while PAM identified a signature composed
of only two genes (PLK1 and AURKA) that were also present in the Class Prediction signature.
Finally, hierarchical clustering of the 47 samples, based on PLK1 and AURKA expression, subdivided the patient population into three groups with significantly different ploidy (P = 0.0000015; figure 3), namely a DNA diploid group of 17 tumors (all but one showing DNA diploid status), an intermediate group of 11 tumors (7 DNA diploid and 4 DNA aneuploid) and a DNA aneuploid group of 19 tumors (all but one showing DNA aneuploid status). Interestingly, the SPF value of the DNA aneu-ploid tumor (5449-A; dotted line rectangle in figure 3) in the DNA diploid group was low, while the SPF values of the 8 DNA diploid tumors (solid line rectangles in figure 3) in the DNA aneuploid and intermediate groups were high (except for one with an intermediate SPF value).
Validation of the two-gene expression signature in an independent series of breast tumor samples
To validate our two-gene expression signature for tumor ploidy, we analyzed six additional classical DNA aneu-ploid breast tumors (1.10 ≤ aneu-ploidy index ≤ 1.90). All six tumors fell into the DNA aneuploid group (n = 5) or
Table 3 Relationship between mRNA levels of 20 markedly upregulated genes and breast cancer progression
Genes Normal breast tissues (n = 9) Benign breast tumors (n = 14)
pa DCIS of the breast
(n = 14)
pb Invasive grade I
breast tumors (n = 11)
pc Invasive grade III
breast tumors (n = 12) pd NDC80 1,0 (0,00-1,39) 3,64 (1,32-17,79)e <0,01 14,55 (4,10-24,20) 0,0009 7,11 (1,38-13,55) NS 15,22 (4,76-54,69) 0,01 BUB1 1,0 (0,00-1,38) 2,97 (1,52-14,03) <0,01 15,37 (1,59-94,35) 0,001 6,59 (0,00-94,35) NS 17,54 (5,46-57,28) 0,004 BUB1B 1,0 (0,24-2,97) 2,72 (1,01-9,38) <0,01 14,54 (3,53-39,95) 0,0002 6,11 (0,00-11,31) NS 18,66 (2,39-105,05) 0,004 CCNB1 1,0 (0,00-3,14) 2,51 (1,01-6,82) <0,01 6,82 (1,71-15,24) 0,002 4,23 (1,33-5,90) NS 9,05(3,51-41,64) 0,007 TACC3 1,0 (0,00-1,35) 1,70 (0,78-6,18) <0,01 7,21 (1,77-13,67) 0,0003 5,31 (1,11-11,24) 0,02 17,04 (4,98-74,03) 0,0006 TPX2 1,0 (0,31-4,23) 2,84 (0,82-10,73) <0,05 16,99 (4,70-35,59) 0,00009 6,51 (1,67-19,74) NS 23,84 (6,15-315,17) 0,0009 CCNA2 1,0 (0,05-1,45) 2,19 (0,20-7,19) <0,05 10,56 (1,70-17,21) 0,0006 3,36 (1,04-8,34) NS 11,38 (1,64-104,33) 0,008 CDC2 1,0 (0,00-2,11) 1,76 (0,76-7,36) <0,05 10,16 (2,56-20,87) 0,00008 6,01 (1,06-10,78) NS 10,99 (3,32-56,75) 0,006 CDC20 1,0 (0,06-1,28) 1,67 (0,63-3,54) <0,05 3,90 (1,49-14,09) 0,0001 1,65 (1,76-3,00) NS 6,14 (1,76-142,68) 0,0002 NEK2 1,0 (0,16-2,87) 1,17 (0,41-3,78) NS 10,44 (2,03-26,23) 0,00004 2,67 (1,15-11,88) 0,008 14,83 (3,60-115,09) 0,0006 AURKA 1,0 (0,30-2,58) 1,12 (0,33-2,32) NS 6,04 (1,27-21,01) 0,00002 2,54 (1,25-7,16) 0,002 7,82 (2,04-58,89) 0,003 PLK1 1,0 (0,30-2,08) 0,80 (0,34-1,99) NS 3,83 (1,09-11,37) 0,00003 1,91 (0,20-5,66) 0,04 7,09 (1,92-117,27) 0,0009 TTK 1,0 (0,01-7,32) 2,43 (0,00-11,29) NS 9,85 (2,59-32,07) 0,0003 2,32 (0,00-5,68) NS 8,59 (4,14-55,84) 0,0002 AURKB 1,0 (0,00-3,24) 2,07 (0,22-7,41) NS 5,97 (0,99-26,91) 0,02 4,24 (1,05-10,06) NS 16,26 (5,70-210,84) 0,0003 BIRC5 1,0 (0,46-3,40) 1,37 (0,39-6,06) NS 7,86 (1,68-40,50) 0,00008 3,51 -0,54-7,29) NS 12,20 (3,14-128,0) 0,0007 ZWINT 1,0 (0,00-3,71) 1,98 (0,39-4,53) NS 5,70 (2,45-15,74) 0,0002 3,59 (0,89-6,09) NS 10,95 (2,70-55,46) 0,001 CCNB2 1,0 (0,31-1,93) 1,43 (0,70-5,98) NS 8,98 (1,57-23,43) 0,0002 3,31 (0,03-7,31) NS 12,28 (1,53-52,35) 0,005 CENPE 1,0 (0,03-4,58) 0,96 (0,33-6,15) NS 3,61 (1,11-8,34) 0,002 2,00 (0,33-5,57) NS 2,98 (0,84-10,15) 0,04 UBD 1,0 (0,00-3,07) 1,49 (0,34-4,66) NS 3,19 (0,43-4,66) 0,04 2,92 (0,19-14,72) NS 5,30 (1,16-32,37) NS CCNB3 1,0 (0,00-6,11) 2,52 (0,53-5,82) NS 1,36 (0,00-8,94) NS 3,24 (0,63-8,54) NS 2,71 (0,00-8,54) NS MKI67 1,0 (0,03-2,87) 2,63 (0,47-12,70) NS 14,92 (2,12-33,98) 0,0007 5,21 (0,13-12,15) NS 14,09 (2,45-189,14) 0,009
aMann et Whitney’s U Test: Benign breast tumors vs Normal breast tissues. NS, not significant. bDuctal Carcinoma In Situ (DCIS) of the breast vs Benign breast tumors.
cInvasive grade I breast tumors vs Benign breast tumors. dInvasive grade III breast tumors vs Invasive grade I breast tumors.
eMedian (range) of gene mRNA levels. The mRNA levels of the tumor samples were normalized such that the median of the 9 normal breast tissues mRNA levels was 1.
Normal breast tissues S t a n d a r d iz e d m R N A l e v e l 1.00 (0.00-1.39) 3.64 (1.32-17.8)
NDC80
14.5 (4.10-24.2) 7.11 (1.38-13.6) 15.2 (4.76-54.7) S t a n d a r d iz e d m R N A l e v e l 1.00 (0.16-2.87) 1.17 (0.41-3.78)NEK2
10.4 (2.03-26.2) 2.67 (1.15-11.9) 14.8 (3.60-115.1) S t a n d a r d iz e d m R N A l e v e l 1.00 (0.00-3.24) 2.07 (0.22-7.41)AURKB
5.97 (0.99-26.9) 4.24 (1.05-10.1) 16.3 (5.70-210.8) Benign breast tumors Ductal carcinoma in situ Invasive ductal grade I Invasive ductal grade III 20 10 30 0 5 4 .7 4 8 .8 4 2 .1 20 10 30 0 1 1 5 1 0 6 .5 20 10 30 0 2 1 0 .8 3 4 .3 3 6 .2 3 5 .8 1.36 (0.00-1.39) 5.65 (1.32-17.8) 13.57 (4.10-24.2) 6.14 (1.38-13.6) 20.35 (4.76-54.7) 1.44 (0.16-2.87) 1.62 (0.41-3.78) 11.54 (2.03-26.2) 4.98 (1.15-11.9) 27.07 (3.60-115.1) 2.59 (0.00-3.24) 3.02 (0.22-7.41) 7.48 (0.99-26.9) 4.25 (1.05-10.1) 38.67 (5.70-210.8) Median Mean Median Mean Median Mean P=0.0000030a P=0.00000024a P=0.000023a aKruskal Wallis’s H Test
Figure 1 mRNA levels of 3 characteristic upregulated genes (NDC80, NEK2 and AURKA) according to breast tumor progression. Breast tumor progression groups are consisting of 9 normal breast tissues, 14 benign breast tumors, 14 ductal carcinoma in situ (DCIS), 11 invasive ductal grade I and 12 invasive ductal grade III breast tumors, respectively. Median values (ranges) and means +/- SD (in italics) are indicated for each tumor subgroup.
the intermediate group (n = 1) (figure 4). It is note-worthy that the DNA aneuploid tumor (5448-T) included in the intermediate group had a low SPF value. Recent studies suggest that abnormal division of tetra-ploid cells might facilitate genetic changes that give rise to aneuploid cancers and therefore that tetraploidy could be a transitional step between diploid status and classical aneuploid status [1]. Thus, we also analyzed 8 DNA tetraploid breast tumors (1.90 ≤ ploidy index ≤ 2.05) with our two-gene expression signature. All but one of these DNA tetraploid breast tumors fell into the DNA aneuploid group (n = 3) or the intermediate group (n = 4) (figure 5). It is noteworthy that the DNA tetra-ploid tumor (5081-T) included in the DNA ditetra-ploid group had a low SPF value.
As the validation set includes a limited number of breast tumor samples, this two-gene expression signa-ture capable of discriminating between DNA aneuploid and diploid breast tumors needs to be further validated in a large prospective randomized study.
Discussion
To obtain further insight into the molecular mechan-isms leading to aneuploidy in breast cancer, we used real-time quantitative RT-PCR to quantify the mRNA expression of a large number of selected genes in var-ious types of breast tumor.
Real-time quantitative RT-PCR is a promising alterna-tive to cDNA microarrays for molecular tumor profiling. In particular, real-time RT-PCR is far more precise, reproducible and quantitative than cDNA microarrays. Real-time RT-PCR is also more useful for analyzing weakly expressed genes, such as TERT in the present
study. Finally, real-time RT-PCR requires smaller amounts of total RNA (about 2 ng per target gene), and is therefore suitable for analyzing small (benign or malignant) and microdissected tumor samples.
We studied a number of genes involved in various molecular mechanisms associated with the mitotic spin-dle checkpoint, and particularly genes already known to be altered (mainly at the transcriptional level) in various cancers [13-15]. These genes mainly encode proteins involved in mitotic spindle formation, centrosome cohe-sion and duplication, kinetochore-mitotic spindle inter-actions, CDK-cyclin complexes, and sister chromatid separation (see list in Table 1). This analysis was by no means exhaustive, and many possibly relevant genes were certainly missed, but it nevertheless demonstrates the ability of real-time RT-PCR to identify potentially useful marker genes.
Among the 76 genes analyzed, 49 (64.5%) showed sig-nificant dysregulation in breast tumors compared to nor-mal breast tissues: 40 genes were upregulated (including 20 genes showing marked (> 3-fold) upregulation), while only nine genes were downregulated, and this downregu-lation was always moderate (< 3-fold) (Table 2).
To investigate if these genes are involved early in breast tumorigenesis (i.e. the transition from normal breast tissue to benign breast tumors and DCIS) or in tumor progression (i.e. the transition from invasive duc-tal grade I to invasive ducduc-tal grade III breast tumors), we studied the expression level of the 20 markedly upre-gulated genes in large panel of breast tissues, including normal breast tissues, benign breast tumors, DCIS, and grade I and III invasive ductal breast tumors (Table 3 and Figure 2). Normal breast tissue Invasive ductal grade III Benign breast tissue Invasive ductal grade I
NDC80
BUB1 BUB1B CCNB1 TACC3 TPX2 CCNA2 CDC2 CDC20NEK2
AURKA PLK1TTK
AURKB BIRC5 ZWINT CCNB2 CENPE Normal breast tissue Invasive ductal grade III Benign breast tissue Invasive ductal grade INDC80
BUB1 BUB1B CCNB1 TACC3 TPX2 CCNA2 CDC2 CDC20NEK2
AURKA PLK1TTK
AURKB BIRC5 ZWINT CCNB2 CENPELike MKI67, which encodes the proliferation-related antigen Ki-67, the expression of most of these genes (except CCNB3 and UBD) increased during the transi-tion from grade I to ductal grade III breast tumors. Twelve genes (NDC80, BUB1, CDC2, CCNA2, BUB1B, TACC3, TPX2, ZWINT, CCNB2, AURKB, NEK2 and BIRC5) showed marked upregulation in ductal grade III breast tumors (more than 10-fold higher than in normal breast tissues), as well as in the breast tumor cell lines (up to 70-fold higher than in normal breast tissues). Most of these genes were specifically altered in tumor epithelial cells during malignant transformation.
These results are in total agreement with the literature showing a strong link between aneuploidy/CIN and tumor grade, i.e. between mitotic spindle checkpoint pathways and cell proliferation pathways. Indeed, several of the mitotic spindle checkpoint genes identified in this study (in particular TPX2, NEK2, AURKA and PLK1) have previously been included in a “proliferation signa-ture” discriminating histological grades I and III [16], or in a “poor prognosis” signature [17,18].
These genes also showed marked upegulation in DCIS (higher than in ductal grade I breast tumors), confirm-ing the major role of mitotic spindle checkpoint genes
in pre-invasive lesions of the most common human can-cers [19,20].
More interestingly, we identified 9 genes (NDC80, BUB1, BUB1B, CCNB1, TACC3, TPX2, CCNA2, CDC2 and CDC20) involved in the transition from normal breast tissues to benign breast tumors (Table 3). NDC80/HEC1was the most strongly upregulated gene. Among the 14 benign breast tumors analyzed, 10 (71.4%) showed significant NDC80/HEC1 overexpression (> 3-fold higher than in normal breast tissues). NDC80/ HEC1is thus an outstanding candidate marker of breast lesions that are likely to undergo malignant transforma-tion. NDC80/HEC1 regulates kinetochore microtubule dynamics and attachment stability [21]. Small molecule targeting Hec1 protein suppresses tumor cell growth in culture and in animal [22].
We identified a two-gene expression signature (PLK1 + AURKA) associated with aneuploidy. PLK1 and AURKA are well-known mitotic spindle checkpoint genes that encode mitotic kinases (polo-like kinase-1 and aurora A, respectively). These enzymes are emer-ging as critical regulators of centrosome cycling and for-mation of the bipolar mitotic spindle [23-25]. These two genes are overexpressed in many types of solid tumor.
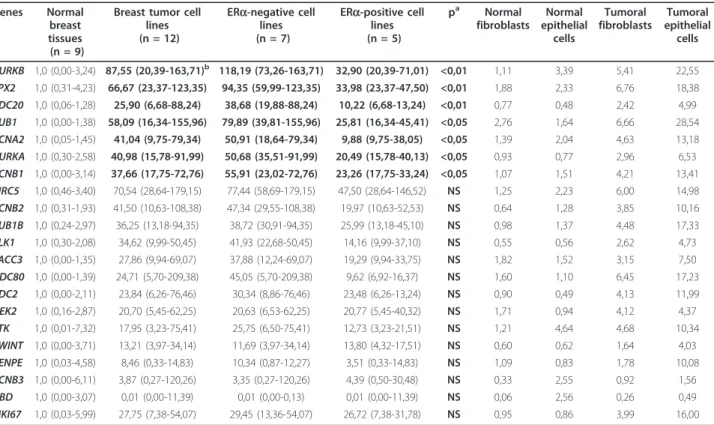
Table 4 mRNA expressions of the 20 markedly upregulated genes in breast cancer cell lines (ERa-negative and ERa-positive) and in primary cell cultures of epithelial cells and fibroblasts from normal breast tissues and breast tumor cells
Genes Normal breast tissues (n = 9)
Breast tumor cell lines (n = 12) ERa-negative cell lines (n = 7) ERa-positive cell lines (n = 5) pa Normal fibroblasts Normal epithelial cells Tumoral fibroblasts Tumoral epithelial cells AURKB 1,0 (0,00-3,24) 87,55 (20,39-163,71)b 118,19 (73,26-163,71) 32,90 (20,39-71,01) <0,01 1,11 3,39 5,41 22,55 TPX2 1,0 (0,31-4,23) 66,67 (23,37-123,35) 94,35 (59,99-123,35) 33,98 (23,37-47,50) <0,01 1,88 2,33 6,76 18,38 CDC20 1,0 (0,06-1,28) 25,90 (6,68-88,24) 38,68 (19,88-88,24) 10,22 (6,68-13,24) <0,01 0,77 0,48 2,42 4,99 BUB1 1,0 (0,00-1,38) 58,09 (16,34-155,96) 79,89 (39,81-155,96) 25,81 (16,34-45,41) <0,05 2,76 1,64 6,66 28,54 CCNA2 1,0 (0,05-1,45) 41,04 (9,75-79,34) 50,91 (18,64-79,34) 9,88 (9,75-38,05) <0,05 1,39 2,04 4,63 13,18 AURKA 1,0 (0,30-2,58) 40,98 (15,78-91,99) 50,68 (35,51-91,99) 20,49 (15,78-40,13) <0,05 0,93 0,77 2,96 6,53 CCNB1 1,0 (0,00-3,14) 37,66 (17,75-72,76) 55,91 (23,02-72,76) 23,26 (17,75-33,24) <0,05 1,07 1,51 4,21 13,41 BIRC5 1,0 (0,46-3,40) 70,54 (28,64-179,15) 77,44 (58,69-179,15) 47,50 (28,64-146,52) NS 1,25 2,23 6,00 14,98 CCNB2 1,0 (0,31-1,93) 41,50 (10,63-108,38) 47,34 (29,55-108,38) 19,97 (10,63-52,53) NS 0,64 1,28 3,85 10,16 BUB1B 1,0 (0,24-2,97) 36,25 (13,18-94,35) 38,72 (30,91-94,35) 25,99 (13,18-45,10) NS 0,98 1,37 4,48 17,33 PLK1 1,0 (0,30-2,08) 34,62 (9,99-50,45) 41,93 (22,68-50,45) 14,16 (9,99-37,10) NS 0,55 0,56 2,62 4,73 TACC3 1,0 (0,00-1,35) 27,86 (9,94-69,07) 37,88 (12,24-69,07) 19,29 (9,94-33,75) NS 1,82 1,52 3,15 7,50 NDC80 1,0 (0,00-1,39) 24,71 (5,70-209,38) 45,05 (5,70-209,38) 9,62 (6,92-16,37) NS 1,60 1,10 6,45 17,23 CDC2 1,0 (0,00-2,11) 23,84 (6,26-76,46) 30,34 (8,86-76,46) 23,48 (6,26-13,24) NS 0,90 0,49 4,13 11,99 NEK2 1,0 (0,16-2,87) 20,70 (5,45-62,25) 20,63 (6,53-62,25) 20,77 (5,45-40,32) NS 1,71 0,94 4,12 4,37 TTK 1,0 (0,01-7,32) 17,95 (3,23-75,41) 25,75 (6,50-75,41) 12,73 (3,23-21,51) NS 1,21 4,64 4,68 10,34 ZWINT 1,0 (0,00-3,71) 13,21 (3,97-34,14) 11,69 (3,97-34,14) 13,80 (4,32-17,51) NS 0,60 0,62 1,64 4,03 CENPE 1,0 (0,03-4,58) 8,46 (0,33-14,83) 10,34 (0,87-12,27) 3,51 (0,33-14,83) NS 1,09 0,83 1,78 10,08 CCNB3 1,0 (0,00-6,11) 3,87 (0,27-120,26) 3,35 (0,27-120,26) 4,39 (0,50-30,48) NS 0,33 2,55 0,92 1,56 UBD 1,0 (0,00-3,07) 0,01 (0,00-11,39) 0,01 (0,00-0,13) 0,01 (0,00-11,39) NS 0,06 2,56 0,26 0,49 MKI67 1,0 (0,03-5,99) 27,75 (7,38-54,07) 29,45 (13,36-54,07) 26,72 (7,38-31,78) NS 0,95 0,86 3,99 16,00
aMann and Whitney’s U Test: ERa-positive cell lines vs ERa-negative cell lines. NS, not significant.
bMedian (range) of gene mRNA levels. The mRNA levels of the tumor cell lines, fibroblasts and epithelial cells samples were normalized such that the median of the 9 normal breast tissues mRNA levels was 1.
AURKAlies within a region of human chromosome arm 20q13 that is amplified in breast cancer [4], as con-firmed here (Table 5). Further in vitro studies (cultured cells) and in vivo studies (animal models) will be required for full confirmation of the role of these two genes in the molecular mechanisms leading to breast cancer aneuploidy.
Based on our two-gene expression signature, we subdi-vided the patient population (n = 47) into three groups with significantly different ploidy, namely a DNA diploid group (n = 17), a DNA aneuploid group (n = 19), and an intermediate group (n = 11) including both DNA aneu-ploid and DNA dianeu-ploid tumors (figure 3). Interestingly, the SPF values of all the DNA diploid tumors in the inter-mediate group were high, confirming the relationship between aneuploidy and proliferation. A large prospective randomized study will be necessary to confirm the exis-tence of this intermediate group and to determine the diagnostic and prognostic relevance of these 3 subgroups.
It is also noteworthy that the expression of the TERT gene, encoding telomerase reverse transcriptase, was sig-nificantly upregulated in DNA aneuploid breast tumors compared to DNA diploid breast tumors, confirming
that aneuploidy may also be caused by telomere erosion [12].
Based on this two-gene expression signature, some DNA tetraploid tumor samples failed to cluster in the DNA aneuploid breast tumor group, in keeping with the observation that aneuploidy can be preceded by tetra-ploidy [26].
In conclusion, this study confirms the strong relation-ship between aneuploidy and proliferation. Among a panel of 76 mitotic spindle checkpoint genes, we identi-fied several genes of interest whose expression status might serve to guide individual breast cancer patient management. Some of the genes identified here are already used to predict tumor recurrence and the response to treatment, while AURKA and PLK1 are fre-quently included in “poor prognosis” signatures [17,18,27]. Multivariate analyses will be necessary to assess the potential of our 2-gene signature as compa-rated to existing gene-expression signatures such as Mammaprint®
and Oncotype DX®
, and a already identi-fied gene expression signature of genomic instability to improve grading of breast tumors [28] or to predict the clinical outcome of breast cancer patients [29]. AURKA
Table 5 Relationship between the mRNA expression levels and DNA amplification levels of the 20 markedly upregulated genes Genes Chromosome location Normal breast tissues (n = 6) Breast tumors (n = 39)
Unamplified tumors Amplified tumors pa
Number mRNA level Number mRNA level CDC20 1p34.1 1,0 (0,61-1,28) 2,89 (0,39-22,65)b 38 (97,5%) 2,99 (0,54-22,65) 1 (2,5%) 0,39 NS NEK2 1q31,2-q41 1,0 (0,44-5,23) 28,41 (2,46-137,03) 12 (30,8%) 26,55 (2,66-51,92) 27 (69,2%) 28,41 (2,46-137,03) NS BUB1 2q14 1,0 (0,53-1,51) 5,52 (0,74-25,63) 36 (92,3%) 5,43 (0,74-25,63) 3 (7,7%) 6,39 (3,46-17,15) NS TACC3 4p16,3 1,0 (0,54-2,08) 7,32 (1,01-29,89) 38 (97,5%) 7,09 (1,01-29,89) 1 (2,5%) 15,32 NS CENPE 4q21-q25 1,0 (0,02-2,06) 14,59 (0,08-61,89) 38 (97,5%) 14,64 (0,08-61,89) 1 (2,5%) 5,54 NS CCNA2 4q25-q31 1,0 (0,56-1,90) 10,39 (2,20-37,31) 36 (92,3%) 10,12 (2,2-37,31) 3 (7,7%) 22,65 (3,81-32,82) NS CCNB1 5q12 1,0 (0,42-2,32) 4,18 (0,34-22,47) 34 (87,2%) 3,53 (0,34-18,96) 5 (12,8%) 8,88 (2,67-22,47) 0,01 UBD 6p21.3 1,0 (0,31-3,91) 4,75 (0,15-106,40) 32 (82,1%) 4,89 (0,15-106,40) 7 (17,9%) 2,93 (0,54-7,43) NS TTK 6q13-q21 1,0 (0,71-2,08) 6,72 (0,61-44,27) 37 (94,9%) 6,72 (0,61-44,27) 2 (5,1%) 15,91 (5,85-25,96) NS CDC2 10q21.1 1,0 (0,68-2,66) 9,52 (1,19-56,17) 34 (87,2%) 8,44 (1,19-56,17) 5 (12,8%) 17,47 (12,74-42,86) 0,03 ZWINT 10q21-q22 1,0 (0,62-1,97) 5,38 (1,08-20,70) 32 (82,1%) 4,44 (1,08-20,70) 7 (17,9%) 12,52 (4,46-18,27) 0,003 BUB1B 15q15 1,0 (0,53-1,69) 10,48 (1,35-32,33) 34 (87,2%) 9,05 (1,35-32,33) 5 (12,8%) 17,33 (10,48-27,28) 0,04 CCNB2 15q21.2 1,0 (0,64-1,95) 14,21 (2,00-68,51) 35 (89,7%) 10,15 (2,0-55,08) 4 (10,2%) 21,41 (19,34-68,51) 0,03 PLK 16p12.1 1,0 (0,60-1,87) 5,46 (0,69-35,59) 16 (41,0%) 4,49 (0,69-21,61) 23 (59,0%) 5,46 (1,24-35,59) NS AURKB 17p13.1 1,0 (0,90-2,08) 5,82 (0,00-64,52) 39 (100%) 5,82 (0-64,52) 0 - -BIRC5 17q25 1,0 (0,37-2,0) 14,84 (1,47-150,30) 27 (69,2%) 9,96 (1,47-49,07) 12 (30,8%) 32,31 (5,84-150,30) 0,0008 NDC80 18p11.31 1,0 (0,29-1,23) 6,28 (1,05-126,38) 34 (87,2%) 5,69 (1,05-27,22) 5 (12,8%) 27,32 (4,13-126,38) 0,03 TPX2 20q11.2 1,0 (0,59-1,48) 15,69 (1,65-117,11) 22 (56,4%) 10,26 (1,65-34,46) 17 (43,6%) 24,03 (5,45-117,11) 0,002 AURKA 20q13.2-q13.3 1,0 (0,36-1,33) 7,14 (1,46-34,22) 24 (61,5%) 5,08 (1,46-32,82) 15 (38,5%) 14,04 (3,40-34,22) 0,002 CCNB3 Xp11 1,0 (0,96-4,20) 5,65 (0,00-61,53) 33 (84,6%) 4,76 (0,00-61,53) 6 (15,4%) 11,58 (5,16-25,25) NS
aMann and Whitney’s U Test: amplified breast tumors vs unamplified breast tumors. NS, non significant.
bMedian (range) of gene mRNA levels. The mRNA levels of the tumor samples were normalized such that the median of the 6 normal breast tissues mRNA level was 1.
amplification induces resistance to taxol [30] and several aurora kinase inhibitors and polo-like kinase 1 inhibitors are in the preclinical development phase [6,31-33]. Finally, the finding that NDC80/HEC1 is involved early in breast carcinogenesis suggests that it too may have clinical relevance.
Materials and methods Patients and Samples
To characterize gene expression signatures associated with breast tumor ploidy, we analyzed samples of 47 pri-mary breast tumors (23 DNA aneuploid and 24 DNA diploid tumors) excised from women at our institution. Samples containing more than 70% of tumor cells were considered suitable for this study. Tumor cellularity was assessed on hematoxylin and eosin-stained tissue sec-tions. Immediately after surgery the tumor samples were The samples were placed in liquid nitrogen until RNA extraction.
The patients met the following criteria: primary unilat-eral non metastatic breast carcinoma; complete clinical, histological and biological information available; no radiotherapy or chemotherapy before surgery; and full follow-up at our institution.
Estrogen receptor, progesterone receptor and ERBB2 status was determined at the protein level by biochem-ical methods (dextran-coated charcoal method, enzy-matic immuno-assay or immunohistochemistry) and confirmed by ERa, PR and ERBB2 real-time quantitative RT-PCR assays. Using RH (ERa and PR) and ERBB2 status, we subdivided the total population (n = 47) into 4 subgroups, i.e. HR+ (ER+ and/or PR+)/ERBB2+ (n = 10), HR+ (ER+ and/or PR+)/ERBB2- (n = 32), HR- (ER-and PR-)/ERBB2+ (n = 1), (ER-and HR- (ER- (ER-and PR-)/ ERBB2- (n = 4).
Standard prognostic factors are shown in Table 6. The median follow-up was 7,8 years (range 26 months to 11.25 years).
The patients had physical examinations and routine chest radiography every 3 months for 2 years, then annually. Mammograms were done annually.
To validate and explore our gene expression signature associated with tumor ploidy, we analyzed 14 additional DNA aneuploid breast tumors, comprising 6 classical aneuploid and 8 DNA tetraploid breast tumor.
To investigate the relationship between the mRNA levels of candidate genes and breast cancer progression, we also analyzed the RNA of 14 benign breast tumors, 14 ductal carcinoma in situ (DCIS) of the breast, 11 invasive ductal grade I breast tumors, and 12 invasive ductal grade III breast tumors. Standard prognostic fac-tors for the 11 invasive ductal grade I breast tumors and 12 invasive ductal grade III breast tumors are indicated in Additional File 2, along with standard prognostic
factors for the 10 invasive breast tumors used for initial screening of the dysregulated genes.
Patients’ consent and approval from the Local Ethical Committee (Breast Group of René Huguenin Hospital) was obtained prior to the use of these clinical materials for research purposes in agreement to the Declaration of Helsinki. The biological collection has been recorded at the French Ministry of Research (N° DC-2008-355).
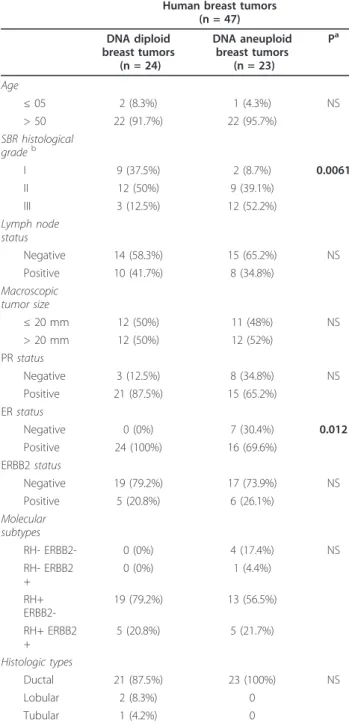
Table 6 Characteristics of the 24 DNA diploid and 23 DNA aneuploid breast tumors
Human breast tumors (n = 47) DNA diploid breast tumors (n = 24) DNA aneuploid breast tumors (n = 23) Pa Age ≤ 05 2 (8.3%) 1 (4.3%) NS > 50 22 (91.7%) 22 (95.7%) SBR histological gradeb I 9 (37.5%) 2 (8.7%) 0.0061 II 12 (50%) 9 (39.1%) III 3 (12.5%) 12 (52.2%) Lymph node status Negative 14 (58.3%) 15 (65.2%) NS Positive 10 (41.7%) 8 (34.8%) Macroscopic tumor size ≤ 20 mm 12 (50%) 11 (48%) NS > 20 mm 12 (50%) 12 (52%) PR status Negative 3 (12.5%) 8 (34.8%) NS Positive 21 (87.5%) 15 (65.2%) ER status Negative 0 (0%) 7 (30.4%) 0.012 Positive 24 (100%) 16 (69.6%) ERBB2 status Negative 19 (79.2%) 17 (73.9%) NS Positive 5 (20.8%) 6 (26.1%) Molecular subtypes RH- ERBB2- 0 (0%) 4 (17.4%) NS RH- ERBB2 + 0 (0%) 1 (4.4%) RH+ ERBB2-19 (79.2%) 13 (56.5%) RH+ ERBB2 + 5 (20.8%) 5 (21.7%) Histologic types Ductal 21 (87.5%) 23 (100%) NS Lobular 2 (8.3%) 0 Tubular 1 (4.2%) 0 a Chi2test.
Table 7 mRNA expression of the 49 dysregulated genes in aneuploid tumors relative to diploid tumors
Genes Diploid tumors (n = 24) Aneuploid tumor (n = 23) pa ROC-AUCb PLK1 1,67 (0,69-7,46)c 8,65 (2,26-35,59) 0,0000005 0,929 AURKA 4,41 (1,46-15,80) 12,92 (3,88-34,22) 0,0000006 0,924 CCNB1 2,23 (0,34-19,16) 5,56 (2,67-18,97) 0,000002 0,901 BUB1 2,96 (0,74-10,74) 6,75 (1,88-25,63) 0,00008 0,837 CDC20 1,76 (0,39-7,95) 4,70 (1,39-22,65) 0,0001 0,824 TACC3 3,81 (1,01-12,27) 8,47 (2,62-29,89) 0,0002 0,814 CDC2 4,77 (1,19-23,21) 14,39 (3,51-56,17) 0,0005 0,797 ZWINT 3,74 (1,08-14,24) 5,97 (2,61-20,70) 0,0005 0,795 BUB3 1,73 (0,74-3,63) 2,89 (1,08-10,17) 0,0007 0,789 NDC80 4,30 (1,05-23,45) 10,00 (2,96-126,38) 0,0009 0,784 TPX2 9,63 (1,65-35,79) 22,11 (5,45-117,11) 0,0009 0,783 RAD21 1,61 (0,65-5,69) 3,03 (0,78-10,73) 0,001 0,770 MAD2L2 1,20 (0,39-3,66) 1,91 (0,61-7,41) 0,002 0,767 CDC23 1,27 (0,92-2,89) 1,96 (0,95-3,96) 0,002 0,765 PPP1R2 1,94 (0,83-3,46) 2,64 (1,03-4,91) 0,004 0,733 CENPE 7,58 (0,08-39,17) 17,11 (2,88-61,89) 0,007 0,729 PTTG1 2,60 (0,01-12,91) 4,03 (2,34-9,95) 0,007 0,729 BIRC5 9,76 (1,47-43,46) 23,21 (2,32-150,30) 0,007 0,728 AURKB 3,83 (0,61-20,14) 6,62 (1,02-64,52) 0,008 0,726 CCNB2 7,74 (2,00-68,51) 17,86 (3,53-55,08) 0,01 0,714 KNTC1 1,02 (0,44-3,63) 1,75 (0,50-3,70) 0,01 0,710 TTK 4,20 (0,61-16,04) 8,05 (1,72-44,27) 0,02 0,701 CCNA2 7,62 (2,45-32,82) 13,61 (2,20-35,30) 0,02 0,692 ESPL1 2,09 (0,44-9,64) 4,59 (0,68-10,11) 0,04 0,674 CDKN1A 1,50 (0,49-3,87) 2,08 (0,76-10,29) NS 0,657 MAD2L1 1,92 (0,80-8,58) 2,34 (1,08-5,18) NS 0,647 SMC1L2 0,19 (0,00-2,15) 0,70 (0,04-10,43) NS 0,642 NEK2 18,34 (2,46-109,01) 29,31 (4,97-137,03) NS 0,638 FBXW7 0,47 (0,16-1,30) 0,61 (0,30-1,18) NS 0,631 BUB1B 6,32 (1,35-63,78) 11,35 (3,25-27,28) NS 0,626 UBD 3,47 (0,15-41,74) 4,94 (0,44-106,40) NS 0,605 CCNB3 5,90 (0,75-27,35) 6,77 (1,29-61,53) NS 0,601 CDC27 1,69 (0,74-2,46) 1,90 (0,65-5,77) NS 0,599 ANAPC4 0,86 (0,31-1,84) 0,90 (0,38-1,90) NS 0,592 MRE11A 0,72 (0,25-1,46) 0,89 (0,21-2,31) NS 0,592 ZWILCH 1,79 (0,76-4,98) 2,26 (0,98-3,50) NS 0,589 BRCA2 1,37 (0,31-7,84) 2,06 (0,69-4,87) NS 0,581 UBE2N 2,08 (1,53-3,42) 2,34 (1,58-3,42) NS 0,574 RAN 1,88 (1,05-3,33) 2,09 (1,28-15,85) NS 0,550 STAG1 0,56 (0,23-1,03) 0,58 (0,31-0,94) NS 0,549 RAE1 2,03 (1,37-4,32) 2,14 (1,15-2,88) NS 0,519 AURKC 0,77 (0,37-3,08) 0,75 (0,35-10,67) NS 0,496 AURKAIP1 2,00 (0,77-3,55) 1,83 (1,05-3,93) NS 0,466 PPP1CA 2,57 (1,23-9,80) 2,15 (1,26-11,11) NS 0,440 TACC1 1,14 (0,26-2,93) 0,99 (0,23-2,81) NS 0,430 RASSF1A 0,55 (0,10-2,13) 0,46 (0,16-1,35) NS 0,413 ANAPC7 2,32 (1,33-4,41) 2,22 (1,39-3,46) NS 0,399 PRCC 3,67 (1,94-6,62) 2,96 (1,62-6,35) NS 0,388 UBE1C 1,70 (0,67-3,71) 1,41 (0,52-2,65) NS 0,384 ANAPC2 1,05 (0,46-2,63) 0,95 (0,57-1,62) NS 0,365 FZR1 0,75 (0,29-1,49) 0,56 (0,24-1,41) 0,001 0,225
Table 7 mRNA expression of the 49 dysregulated genes in aneuploid tumors relative to diploid tumors (Continued)
HTERT 1,00 (0,51-4,11) 1,69 (0,33-28,84) 0,04 0,678 MKI67 1,00 (0,20-4,70) 2,20 (0,72-7,41) 0,0009 0,782 ESR1 1,00 (0,29-2,78) 0,89 (0,00-3,77) NS 0,426
aKruskal Wallis’ H Test.
bROC (Receiver Operating Characteristics) - AUC (Area Under the Curve) analysis.
cMedian (range) gene mRNA levels. The mRNA levels of the tumor samples were normalized such that the median of the 9 normal breast tissues mRNA levels was 1.
63.6%
(7D/4A)
94.1%
P = 0.0000015
(16D/1A)
PLK1/AURKA
5465-D 5458-D 5468-A 5451-A 5452-D 5393-A 4590-D 5402-D 4566-D 5450-D 5462-A 5463-D 5461-A 5398-A 5477-A 5456-A 5478-A 5395-A 5475-A 4591-A 5470-A 4351-A 5469-A 5399-A 5455-A 5397-A 5392-A 5396-A 5394-A 4699-A 5476-D 5403-D 5464-D 5409-D 5406-D 4624-D 5449-A 5474-D 5472-D 5404-D 5407-D 5460-D 5313-D 5408-D 5405-D 5401-D 5459-D SPF Value High High Low Low High Inter High Inter High High Low High Low High Low Inter Low High Low Inter Low Low Inter High Low High High High High High Low Low Low Low Low High Low Low Inter Low Low Low Low Low Inter Low High5.3%
(1D/18A)
Aneuploid
group
Diploid
group
Intermediate
group
Figure 3 Dendrogram of 24 DNA diploid (xxxx-D) and 23 DNA aneuploid breast tumors (xxxx-A). We constructed the dendogram by hierarchical clustering, according to PLK1 and AURKA expression. The SPF value, categorized as low, intermediate or high, is indicated for each tumor. The percentages of diploid breast tumors in each subgroup are indicated on the right.
5478-A 5456-A 5477-A 5395-A 5468-A 5458-D 5452-D 5393-A 5465-D 5462-A 5450-D 4566-D 5451-A 5448-A New 5402-D 4590-D 5475-A 4591-A 5470-A 5138-A New 4251-A 5469-A 5455-A 5463-D 5398-A 5461-A 5392-A 5454-A New 5397-A 5396-A 5394-A 4699-A 5399-A 5133-A New 4565-A New 5125-A New 5476-D 5403-D 5464-D 5409-D 5406-D 5449-A 4624-D 5474-D 5472-D 5404-D 5407-D 5460-D 5313-D 5408-D 5405-D 5401-D 5459-D SPF Value Low Inter Low High Low High High Inter High Low High High Low Low Inter High Low Inter Low Low Low Inter Low High High Low High High High High High High High High High High Low Low Low Low Low High Low Low Inter Low Low Low Low Low Inter Low High
PLK1/AURKA
Aneuploid
group
Diploid
group
Intermediate
group
5478-A 5456-A 5477-A 5395-A 5468-A 5458-D 5452-D 5393-A 5465-D 5462-A 5450-D 4566-D 5451-A 5448-A New 5402-D 4590-D 5475-A 4591-A 5470-A 5138-A New 4251-A 5469-A 5455-A 5463-D 5398-A 5461-A 5392-A 5454-A New 5397-A 5396-A 5394-A 4699-A 5399-A 5133-A New 4565-A New 5125-A New 5476-D 5403-D 5464-D 5409-D 5406-D 5449-A 4624-D 5474-D 5472-D 5404-D 5407-D 5460-D 5313-D 5408-D 5405-D 5401-D 5459-D SPF Value Low Inter Low High Low High High Inter High Low High High Low Low Inter High Low Inter Low Low Low Inter Low High High Low High High High High High High High High High High Low Low Low Low Low High Low Low Inter Low Low Low Low Low Inter Low HighPLK1/AURKA
Aneuploid
group
Diploid
group
Intermediate
group
Figure 4 Dendrogram of 24 DNA diploid, 23 DNA aneuploid and 6 additional DNA aneuploid breast tumors. We constructed by hierarchical clustering, a dendrogram of 24 DNA diploid (xxxx-D), 23 DNA aneuploid (xxxx-A) and 6 additional DNA aneuploid breast tumors (xxxx-A-new; solid line rectangle), according to PLK1 and AURKA expression. The SPF value for each tumor, categorized as low, intermediate or high, is indicated on the right.
PLK1/AURKA
5478-A 5467-T 5463-D 5461-A 5398-A 5477-A 4856-T 5456-A 5447-T 5395-A 5468-A 5458-D 5452-D 5393-A 5465-D 5462-A 5450-D 4566-D 5137-T 5475-A 4591-A 5130-T 5470-A 4351-A 5466-T 5469-A 5399-A 5455-A 5397-A 5392-A 5396-A 5394-A 5135-T 4699-A 5476-D 5403-D 5464-D 5409-D 5406-D 5449-A 4624-D 5474-D 5404-D 5472-D 5407-D 5451-A 5402-D 5081-T 4590-D 5460-D 5313-D 5408-D 5405-D 5401-D 5459-D SPF Value Low Low High Low High Low Inter Inter High Inter Low High High Inter High Low High High Low Low Inter Low Low Low Inter Inter High Low High High High High High High Low Low Low Low Low High Low Low Low Inter Low Low Inter Low High Low Low Low Inter Low HighAneuploid
group
Diploid
group
Intermediate
group
Figure 5 Dendogram of 24 DNA diploid, 23 DNA aneuploid and 8 DNA tetraploid breast tumors. We constructed by hierarchical clustering, a dendrogram of 24 DNA diploid (xxxx-D), 23 DNA aneuploid (xxxx-A) and 8 DNA tetraploid breast tumors (xxxx-T; solid line rectangle), according to PLK1 and AURKA expression. SPF value, categorized as low, intermediate or high, for each tumor is indicated on the right.
Finally, we analyzed five ERa-positive cell lines (MCF7, HCC1500, T-47D, ZR-75-1 and MDA-MB361) and seven ERa-negative cell lines (SK-BR-3, HBL-100, BT-20, MDA-MB157, MDA-MB231, MDA-MB435s and MDA-MB468), obtained from the American Tissue Type Culture Collection. Nine specimens of adjacent normal breast tissue from breast cancer patients or normal breast tissue from women undergoing cosmetic breast surgery were used as sources of normal RNA.
Primary cell culture and differential isolation of epithelial cells and fibroblasts from normal breast tissues and breast tumor cells
To determine which cells (epithelial cells and/or fibro-blasts) overexpressed mitotic-spindle-checkpoint genes, we measured the RNA levels of the selected genes in primary cultures of epithelial cells and fibroblasts from normal breast tissues and breast tumor cells.
Breast tumors and normal tissues were minced with a scalpel and incubated overnight with Liberase Blend-zyme 2 (Roche Applied Science, Meylan, France) for enzymatic dispersion. Organoids and aggregated cells (epithelial fraction) and isolated cells (fibroblast fraction) were separated by filtration and centrifugation. The fibroblast fraction was cultured in Ham’s F10 medium containing L-glutamine (3 mM), insulin (5 mg/mL), T3 (1 nM), hydrocortisone (1 mg/mL), kanamycin (0.1 mg/ mL), and 10% fetal calf serum. The epithelial fraction was cultured in the same conditions, plus epidermal growth factor (5 ng/mL), transferrin (5 mg/mL) and 5% human serum (instead of fetal calf serum). Cells were incubated in humidified air with 5% CO2 at 37°C, and the medium was changed three times a week. Cells were cultured for two weeks before RNA extraction. Epithelial cells and fibroblasts were identified by their morphologi-cal features and by detecting epithelial (keratin 19) and fibroblast marker expression with real-time RT-PCR.
Flow cytometric DNA analysis and S-phase fraction (SPF) classification
Cell preparation and DNA staining were performed as previously described [34]. Flow cytometry (FCM) was performed on a FACScalibur device (Becton Dickinson, CA, USA). Cell cycle analysis was performed with the Modfit LT 2.0 program (Verity Software House, Top-sham, ME). The DNA-diploid peak was located on DNA histograms by using an external standardization proce-dure with normal human lymphocytes positioned in the fifth part of the red fluorescence scale. DNA ploidy and the S-phase fraction (SPF) were obtained after gating on a dot plot (FL2-width versus FL2-area), selecting a repre-sentative amount of debris and excluding doublets.
The DNA ploidy pattern was expressed as the DNA index (DI) that is the ratio between the mean
fluorescence channel number of the tumor G0/G1 peak and the diploid G0/G1 reference peak. Rules established during a previous inter-laboratory control procedure [35] were applied when using the cell-cycle software models. The tumors were classified as follows based on the DNA index. A tumor showing a single peak with a DNA index comprised between 0.95 and 1.1 was classi-fied as DNA diploid; if an additional peak was present, the tumor was placed in one of the following DNA aneuploid subcategories, if they contain at least 10% of total cell counts and a corresponding G2M peak: DNA aneuploid with a DI comprised between 1.10 and 1.90 and > 2.05; DNA tetraploid with a DI comprised between 1.90 and 2.05. There were no hypodiploid (DI < 0.95) or multiploid (several aneuploid peaks) tumors in this series. The ploidy-adjusted SPF was categorized as low, intermediate or high, based on the 33rd and 66th percentiles. The debris and aggregate subtraction options were used when appropriate.
Real-time RT-PCR (1) RNA extraction
Total RNA was extracted from breast specimens by using the acid-phenol guanidium method. The quantity of the RNA samples was accurately measured by using a NanoDrop spectrophotometer, and their quality was determined by electrophoresis through agarose gel stain-ing with ethidium bromide, and visualization of the 18S and 28S RNA bands under ultraviolet light.”
(2) Theoretical basis
Real-time PCR reactions are characterized by the point during cycling when amplification of the PCR product is first detected, rather than the amount of PCR product accumulated after a fixed number of cycles. The para-meter Ct (threshold cycle) is defined as the fractional cycle number at which the fluorescence generated by cleavage of a TaqMan probe (or by SYBR green dye-amplicon complex formation) passes a fixed threshold above baseline. The increase in the fluorescence signal associated with exponential growth of PCR products is detected by the laser detector of the ABI Prism 7700 Sequence Detection System (Perkin-Elmer Applied Bio-systems, Foster City, CA), using PE Biosystems analysis software, according to the manufacturer’s manuals.
The precise amount of total RNA added to each reaction mix (based on optical density) and its quality (i.e. lack of extensive degradation) are both difficult to assess. We therefore also quantified transcripts of two endogenous RNA control genes involved in two cellular metabolic pathways, namely TBP (Genbank accession NM_003194), which encodes the TATA box-binding protein, and RPLP0(NM_001002), which encodes human acidic ribo-somal phosphoprotein P0. Each sample was normalized on the basis of its TBP (or RPLPO) content.
Results, expressed as N-fold differences in target gene expression relative to the TBP (or RPLPO) gene, and termed “Ntarget“, were determined as Ntarget = 2∆Ctsample, where the ∆Ct value of the sample is deter-mined by subtracting the average Ct value of the target gene from the average Ct value of the TBP (or RPLP0) gene [36,37].
The Ntarget values of the samples were subsequently normalized such that the median of the nine normal breast tissue Ntarget values was 1.
(3) Primers and controls
Primers for TBP, RPLP0 and the 76 target genes were chosen with the assistance of the Oligo 5.0 computer program (National Biosciences, Plymouth, MN).
To avoid amplification of contaminating genomic DNA, one of the two primers was placed at the junction between two exons. In general, amplicons were between 70 and 120 nucleotides long. Gel electrophoresis was used to verify the specificity of PCR amplicons.
The 76 target genes tested in this study are listed in Table 1. They were selected from the literature for their potential involvement in molecular mechanisms asso-ciated with the mitotic spindle checkpoint.
cDNA synthesis and PCR conditions were as described elsewhere [37]. Experiments were performed with dupli-cates for each data point. All patient samples with a CV of Ct values higher than 10% were retested.
High-resolution array CGH (comparative genomic hybridization)
Tumor samples were analyzed with the Agilent Human Genome CGH Microarray 44K. DNA samples for array CGH were labeled as previously described [38]. Briefly, 1 μg each of breast tumor DNA and commercial pooled human normal genomic DNAs (Promega, Madison, WI) was digested with 5 μg of AluI (50 units) and 5 ml of RsaI (50 units) (Promega, Madison, WI) and labeled by random priming with CY3- and CY5-dUTP, respectively (Agilent Technologies, Massy, France). The labeled solu-tions were then filtered on a Microcon YLM-30 column (Millipore, Billerica, MA), denatured and hybridized with unlabeled Cot-1 DNA (Invitrogen, Carlsbad, CA) to the CGH arrays. After hybridization in an oven rotating at 15 rpm (Model1012, Sheldon Manufacturing, Corne-lius, OR), the slides were washed and scanned with the Agilent G2565AA Microarray Scanner.
Statistical Analysis
As the mRNA levels did not fit a Gaussian distribution, (a) the mRNA levels in each subgroup of samples were expressed as the median and range rather than the mean and coefficient of variation, and (b) relationships between the molecular markers and clinical and histological para-meters were analyzed with the chi-square test (link
between two qualitative parameters) or the non parametric Mann-Whitney U test (link between one qualitative para-meter and one quantitative parapara-meter) [39]. Differences between two populations were considered significant at confidence levels greater than 95% (p < 0.05).
To visualize the capacity of a given molecular marker to discriminate between two populations (in the absence of an arbitrary cutoff value), we summarized the data in a ROC (receiver operating characteristics) curve [40]. ROC curves plot sensitivity (true positives) on the Y axis against 1-specificity (false positives) on the X axis, con-sidering each value as a possible cutoff. The AUC (area under curve) was calculated as a single measure of the discriminatory capacity of each molecular marker. When a molecular marker has no discriminatory value, the ROC curve lies close to the diagonal and the AUC is close to 0.5. In contrast, when a molecular marker has strong discriminatory value, the ROC curve moves to the upper left-hand corner and the AUC is close to 1.0.
A gene expression signature associated with tumor ploidy was sought with the BRB Array Tools program, using the Prediction Analysis for Microarrays (PAM) and Class Prediction results modules.
Hierarchical clustering was performed with Gen-ANOVA software [41].
Additional material
Additional file 1: mRNA levels of the 20 marked upregulated genes in ERa-negative and ERa-positive breast cancer cell lines.
Additional file 2: Characteristics of the 33 breast tumors (10 for pre-screnning, 11 invasive grade I and 12 invasive grade III).
Abbreviations
CGH: Comparative genomic hybridization; CIN: Chromosomal instability; Ct: Cycle threshold; DCIS: Ductal carcinoma in situ; FCM: Flow cytometry; RT-PCR: Reverse transcriptase-polymerase chain reaction; SPF: S-phase fraction. Acknowledgements
We thank the staff of Centre René Huguenin for their assistance in specimen collection and patient care. This work is supported by Canceropole Region Ile de France. This work was supported by Association pour la Recherche sur le Cancer, INCA (Institut National du Cancer), and Cancéropôle Ile-de-France. Author details
1
INSERM U735, St-Cloud, F-92210, France. Institut Curie Hôpital René Huguenin, FNCLCC, St-Cloud, F-92210, France.2INSERM U745, Université Paris
Descartes, Faculté des Sciences Pharmaceutiques et Biologiques, Paris, F-75006, France.3CNRS UMR 8200, Institut Gustave-Roussy, Villejuif, F-94805,
France.
Authors’ contributions
IB, SV, HB and STK carried out real-time RT-PCR study and analysis. FLa and KD performed cell culture and isolation of cells. MB and FS performed flow cytometric DNA analysis. ER and STK performed the CGH-array study and analysis. HR and GCC performed the statistical analysis. IB and RL conceived the study and participated in its design and coordination. IB, RL, FS and FLe drafted the manuscript. All authors read and approved the final manuscript.
Competing interests
The authors declare that they have no competing interests. Received: 25 March 2010 Accepted: 27 February 2011 Published: 27 February 2011
References
1. Ganem NJ, Storchova Z, Pellman D: Tetraploidy, aneuploidy and cancer. Curr Opin Genet Dev 2007, 17:157-62.
2. Rajagopalan H, Lengauer C: Aneuploidy and cancer. Nature 2004, 432:338-41.
3. Cahill DP, Lengauer C, Yu J, Riggins GJ, Willson JK, Markowitz SD, Kinzler KW, Vogelstein B: Mutations of mitotic checkpoint genes in human cancers. Nature 1998, 392:300-3.
4. Zhou H, Kuang J, Zhong L, Kuo WL, Gray JW, Sahin A, Brinkley BR, Sen S: Tumour amplified kinase STK15/BTAK induces centrosome amplification, aneuploidy and transformation. Nat Genet 1998, 20:189-93.
5. Hayward DG, Clarke RB, Faragher AJ, Pillai MR, Hagan IM, Fry AM: The centrosomal kinase Nek2 displays elevated levels of protein expression in human breast cancer. Cancer Res 2004, 64:7370-6.
6. Strebhardt K, Ullrich A: Targeting polo-like kinase 1 for cancer therapy. Nat Rev Cancer 2006, 6:321-30.
7. DeRisi J, Penland L, Brown PO, Bittner ML, Meltzer PS, Ray M, Chen Y, Su YA, Trent JM: Use of a cDNA microarray to analyse gene expression patterns in human cancer. Nat Genet 1996, 14:457-460.
8. Guo QM: DNA microarray and cancer. Curr Opin Oncol 2003, 15:36-43. 9. Beerman H, Kluin PM, Hermans J, van de Velde CJ, Cornelisse CJ:
Prognostic significance of DNA-ploidy in a series of 690 primary breast cancer patients. Int J Cancer 1990, 45:34-9.
10. Viegas-Péquignot E, Jeanpierre M, Dutrillaux AM, Gerbault-Seureau M, Muleris M, Dutrillaux B: Detection of 1q polysomy in interphase nuclei of human solid tumors with a biotinylated probe. Hum Genet 1989, 81:311-4.
11. Nakopoulou L, Panayotopoulou EG, Giannopoulou I, Tsirmpa I, Katsarou S, Mylona E, Alexandrou P, Keramopoulos A: Extra copies of chromosomes 16 and X in invasive breast carcinomas are related to aggressive phenotype and poor prognosis. J Clin Pathol 2007, 60:808-15. 12. der-Sarkissian H, Bacchetti S, Cazes L, Londono-Vallejo JA: The shortest
telomeres drive karyotype evolution in transformed cells. Oncogene 2004, 23:1221-8.
13. Kops GJ, Weaver BA, Cleveland DW: On the road to cancer: aneuploidy and the mitotic checkpoint. Nat Rev Cancer 2005, 5:773-85.
14. May KM, Hardwick KG: The spindle checkpoint. J Cell Sci 2006, 119:4139-42. 15. Musacchio A, Salmon ED: The spindle-assembly checkpoint in space and
time. Nat Rev Mol Cell Biol 2007, 8:379-93.
16. Sotiriou C, Wirapati P, Loi S, Harris A, Fox S, Smeds J, Nordgren H, Farmer P, Praz V, Haibe-Kains B, Desmedt C, Larsimont D, Cardoso F, Peterse H, Nuyten D, Buyse M, Van de Vijver MJ, Bergh J, Piccart M, Delorenzi M: Gene expression profiling in breast cancer: understanding the molecular basis of histologic grade to improve prognosis. J Natl Cancer Inst 2006, 98:262-72.
17. Korkola JE, Blaveri E, DeVries S, Moore DH, Hwang ES, Chen YY, Estep AL, Chew KL, Jensen RH, Waldman FM: Identification of a robust gene signature that predicts breast cancer outcome in independent data sets. BMC Cancer 2007, 7:61.
18. Morris SR, Carey LA: Gene expression profiling in breast cancer. Curr Opin Oncol 2007, 19:547-51.
19. Pihan GA, Wallace J, Zhou Y, Doxsey SJ: Centrosome abnormalities and chromosome instability occur together in pre-invasive carcinomas. Cancer Res 2003, 63:1398-404.
20. Scintu M, Vitale R, Prencipe M, Gallo AP, Bonghi L, Valori VM, Maiello E, Rinaldi M, Signori E, Rabitti C, Carella M, Dallapiccola B, Altomare V, Fazio VM, Parrella P: Genomic instability and increased expression of BUB1B and MAD2L1 genes in ductal breast carcinoma. Cancer Lett 2007, 254:298-307.
21. DeLuca JG, Gall WE, Ciferri C, Cimini D, Musacchio A, Salmon ED: Kinetochore microtubule dynamics and attachment stability are regulated by Hec1. Cell 2006, 127:969-82.
22. Wu G, Qiu XL, Zhou L, Zhu J, Chamberlin R, Lau J, Chen PL, Lee WH: Small molecule targeting the Hec1/Nek2 mitotic pathway suppresses tumor cell growth in culture and in animal. Cancer Res 2008, 68:8393-9.
23. Andrews PD, Knatko E, Moore WJ, Swedlow JR: Mitotic mechanics: the auroras come into view. Curr Opin Cell Biol 2003, 15:672-83.
24. Malumbres M, Barbacid M: Cell cycle kinases in cancer. Curr Opin Genet Dev 2007, 17:60-5.
25. Takaki T, Trenz K, Costanzo V, Petronczki M: Polo-like kinase 1 reaches beyond mitosis–cytokinesis, DNA damage response, and development. Curr Opin Cell Biol 2008, 20:650-60.
26. Margolis RL: Tetraploidy and tumor development. Cancer Cell 2005, 8:353-4.
27. Loddo M, Kingsbury SR, Rashid M, Proctor I, Holt C, Young J, El-Sheikh S, Falzon M, Eward KL, Prevost T, Sainsbury R, Stoeber K, Williams GH: Cell-cycle-phase progression analysis identifies unique phenotypes of major prognostic and predictive significance in breast cancer. Br J Cancer 2009, 100:959-70.
28. Kronenwett U, Huwendiek S, Ostring C, Portwood N, Roblick UJ, Pawitan Y, Alaiya A, Sennerstam R, Zetterberg A, Auer G: Improved grading of breast adenocarcinomas based on genomic instability. Cancer Res 2004, 64:904-9.
29. Habermann JK, Doering J, Hautaniemi S, Roblick UJ, Bündgen NK, Nicorici D, Kronenwett U, Rathnagiriswaran S, Mettu RK, Ma Y, Krüger S, Bruch HP, Auer G, Guo NL, Ried T: The gene expression signature of genomic instability in breast cancer is an independent predictor of clinical outcome. Int J Cancer 2009, 124:1552-64.
30. Anand S, Penrhyn-Lowe S, Venkitaraman AR: AURORA-A amplification overrides the mitotic spindle assembly checkpoint, inducing resistance to Taxol. Cancer Cell 2003, 3:51-62.
31. Gumireddy K, Reddy MV, Cosenza SC, Boominathan R, Baker SJ, Papathi N, Jiang J, Holland J, Reddy EP: ON01910, a non-ATP-competitive small molecule inhibitor of Plk1, is a potent anticancer agent. Cancer Cell 2005, 7:275-86.
32. Soncini C, Carpinelli P, Gianellini L, Fancelli D, Vianello P, Rusconi L, Storici P, Zugnoni P, Pesenti E, Croci V, Ceruti R, Giorgini ML, Cappella P, Ballinari D, Sola F, Varasi M, Bravo R, Moll J: PHA-680632, a novel Aurora kinase inhibitor with potent antitumoral activity. Clin Cancer Res 2006, 12:4080-9. 33. Harrington EA, Bebbington D, Moore J, Rasmussen RK, Ajose-Adeogun AO,
Nakayama T, Graham JA, Demur C, Hercend T, Diu-Hercend A, Su M, Golec JM, Miller KM: VX-680, a potent and selective small-molecule inhibitor of the Aurora kinases, suppresses tumor growth in vivo. Nat Med 2004, 10:262-7.
34. Spyratos F, Ferrero-Pous M, Trassard M, Hacene K, Phillips E, Tubiana-Hulin M, Le Doussal V: Correlation between MIB-1 and other proliferation markers: clinical implications of the MIB-1 cutoff value. Cancer 2002, 94:2151-9.
35. Chassevent A, Jourdan ML, Romain S, Descotes F, Colonna M, Martin PM, Bolla M, Spyratos F: S-phase fraction and DNA ploidy in 633 T1T2 breast cancers: a standardized flow cytometric study. Clin Cancer Res 2001, 7:909-17.
36. Bieche I, Onody P, Laurendeau I, Olivi M, Vidaud D, Lidereau R, Vidaud M: Real-time reverse transcription-PCR assay for future management of ERBB2-based clinical applications. Clin Chem 1999, 45:1148-1156. 37. Bieche I, Parfait B, Le Doussal V, Olivi M, Rio MC, Lidereau R, Vidaud M:
Identification of CGA as a novel estrogen receptor-responsive gene in breast cancer: an outstanding candidate marker to predict the response to endocrine therapy. Cancer Res 2001, 61:1652-1658.
38. Rouleau E, Lefol C, Tozlu S, Andrieu C, Guy C, Copigny F, Nogues C, Bieche I, Lidereau R: High-resolution oligonucleotide array-CGH applied to the detection and characterization of large rearrangements in the hereditary breast cancer gene BRCA1. Clin Genet 2007, 72:199-207. 39. Mann H, Whitney D: On a test of whether one of two random variables
is stochastically larger than the other. Annals of Mathematical Statistics 1947, 18:50-60.
40. Hanley J, McNeil B: The meaning and use of the area under a receiver operating characteristic (ROC) curve. Radiology 1982, 143:29-36. 41. Didier G, Brezellec P, Remy E, Henaut A: GeneANOVA-gene expression
analysis of variance. Bioinformatics 2002, 18:490-491.
doi:10.1186/1476-4598-10-23
Cite this article as: Bièche et al.: Expression analysis of mitotic spindle checkpoint genes in breast carcinoma: role of NDC80/HEC1 in early breast tumorigenicity, and a two-gene signature for aneuploidy. Molecular Cancer 2011 10:23.