HAL Id: hal-02974328
https://hal.archives-ouvertes.fr/hal-02974328
Submitted on 3 Dec 2020
HAL is a multi-disciplinary open access
archive for the deposit and dissemination of
sci-entific research documents, whether they are
pub-lished or not. The documents may come from
teaching and research institutions in France or
abroad, or from public or private research centers.
L’archive ouverte pluridisciplinaire HAL, est
destinée au dépôt et à la diffusion de documents
scientifiques de niveau recherche, publiés ou non,
émanant des établissements d’enseignement et de
recherche français ou étrangers, des laboratoires
publics ou privés.
using a spatially-averaged model
Igor Denysenko, Ilija Stefanovic, Maxime Mikikian, Eva Kovacevic, Johannes
Berndt
To cite this version:
Igor Denysenko, Ilija Stefanovic, Maxime Mikikian, Eva Kovacevic, Johannes Berndt. Argon/dust and
pure argon pulsed plasmas explored using a spatially-averaged model. Journal of Physics D: Applied
Physics, IOP Publishing, 2021, 54, pp.065202. �10.1088/1361-6463/abc210�. �hal-02974328�
J. Phys. D: Appl. Phys. XX (XXXX) XXXXXX
https://doi.org/XXXX/XXXX
xxxx-xxxx/xx/xxxxxx 1 © xxxx IOP Publishing Ltd
Argon/dust and pure argon pulsed plasmas
explored using a spatially-averaged model
I B Denysenko
1,2,3, I Stefanović
4, M Mikikian
2, E Kovacevic
2and J Berndt
21School of Physics and Technology, V N Karazin Kharkiv National University, Kharkiv, Ukraine 2GREMI, UMR7344 CNRS/Université d’Orléans, F-45067 Orléans, France
3Le Studium, Loire Valley Institute for Advanced Studies, Orléans & Tours, France
4Institute of Technical Sciences, Serbian Academy of Sciences & Arts, 11000, Belgrade, Serbia
E-mail: [email protected] Received
Accepted for publication Published
Abstract
The properties (densities of electrons and metastable argon atoms, effective electron temperature and dust charge) of argon/dust and pure argon pulsed plasmas are studied using a spatially-averaged model. The calculated time-dependencies for the densities of electrons and metastable atoms are compared with the experimental measurements and are found to be in a good qualitative agreement. It is analyzed how the plasma properties depend on the shape of the electron energy probability function (EEPF), the pulsing frequency and the duty cycle for both dust-free and dusty plasma. The analysis reveals that the agreement between theory and experiment is better with Druyvesteyn EEPF than the Maxwellian EEPF. Further, the variation in the pulsing frequency νp differently affects the metastable density nm in a dust-free and in a dusty plasma. For large νp, the
metastable density in the dust-free pulsed plasma is larger than in the continuous-wave (CW) discharge, while the opposite is obtained in the presence of dust particles. This difference probably arises because of faster variation in the effective electron temperature in the dusty plasma due to collection of electrons by dust particles. Our calculations also show that dust particles may affect the behavior of electron density in the beginning of the on-period due to an enhancement in electron collection by dust particles.
Keywords: plasma, dust particles, pulsing frequency, duty cycle, spatially-averaged model
1. Introduction
Gas discharges containing charged nano and micro particles (dust particles) have been extensively studied for several decades [1 – 3] as these dusty plasmas are involved in many technological and bioimagingapplications and also in fusion research [1, 4 – 6]. They are also of a fundamental interest and have attracted research attention in diverse fields, including the formation of Coulomb dust crystals, dust vortices and voids, cosmic clouds, etc. [1–3, 7, 8]
Many properties of gas discharges with dust particles have been investigated both experimentally and numerically focusing mostly to the continuous wave (CW) regime [1–3, 7– 13]. However, in many technological applications, plasma systems are not stationary [14]. Nonstationary gas discharges (especially pulsed systems) are often employed for reduction
of charge accumulation on the substrates, improving the quality of the deposited films and etch selectivity [14, 15], controlling particle formation in chemically active plasmas, etc. [16–18] Therefore, dust particles in nonstationary gas discharges and afterglow plasmas have also been studied by some authors [13, 19–21].
In [19], the time-dependence of the charge of micrometer dust particles in the afterglow of a RF plasma under microgravity conditions was analyzed experimentally and theoretically. It was found that dust particles keep a negative charge for a long time in the afterglow. According to [20], negatively and positively charged dust particles as well as neutral ones coexisted for more than a minute in a RF discharge afterglow. By analyzing the dust particle diffusion in the afterglow, several properties of a dusty plasma are established [21].
2
A symmetrically – driven RF discharge was used to analyze the pulsed dusty plasmas with large dust charge densities (|𝑛𝑛𝑑𝑑𝑍𝑍𝑑𝑑| ≥ 𝑛𝑛𝑒𝑒, where 𝑍𝑍𝑑𝑑 is the dust charge number in
units of elementary charge e, 𝑛𝑛𝑒𝑒 and 𝑛𝑛𝑑𝑑 are the densities of
electrons and dust particles, respectively) [22–25]. Dust particles were first formed in Ar/C2H2 plasma and then the
acetylene input was stopped to keep only an argon/dusty plasma. However, acetylene could remain in the chamber from the growth phase or due to the desorption of C2H2 from the
chamber walls. The experiments showed that the electron density increased unexpectedly at the very beginning of the dusty plasma afterglow [24, 25]. Several mechanisms were proposed to describe this phenomenon. Firstly, the increase of the electron density in the early afterglow was attributed to the release of electrons from the dust particles by secondary electron emission in ion-dust collisions [25]. The other sources of electrons in the early afterglow were identified and compared, such as electron generation in metastable-metastable and metastable-metastable-dust collisions [22] or secondary electron emission from electrodes [26]. In a presence of impurities, such as acetylene, the metastable – acetylene collisions make a significant contribution to the described phenomenon [27].
Note that in most theoretical studies of nonstationary dusty plasmas, the electron energy probability function (EEPF) was assumed to be Maxwellian, whereas, in practice, the EEPF in low-temperature plasmas is usually non-Maxwellian [28–30]. Moreover, in [22–26] the authors focused their attention mainly on the off-period (afterglow). Therefore, these studies did not provide information about the time variation of plasma properties during the on-period and about the dependence of plasma properties on the pulsing parameters (frequency νp, duty cycle η). Nevertheless, this
information is important to control pulsed plasma properties in different technological applications [14, 16, 31].
In this paper, we propose a theoretical description for a pulsed dusty plasma with large dust charge densities. The current model formulation is based on a spatially-averaged (0D) model, which describes both the on- and off-periods of the pulsed plasma and accounts for the non-Maxwellian shape of the EEPF. Thus, this 0D model differs significantly from the models used in our previous studies of pulsed dusty plasmas, where only the afterglow is considered and the electrons are assumed to be Maxwellian [22, 26]. Beside of that, the model uses recently proposed rate constant for argon metastable – metastable collisions (known also as “metastable pooling”), and the new Penning branching ratio in Ar*- C2H2
reaction α = 0.3 [27]. The metastable pooling rate is a few times lower compared to the value commonly used in the literature [32]. The model is used to study plasma properties (the electron and metastable atoms’ densities, effective electron temperature and dust charge) as a function of time in pure argon and dusty pulsed discharges. It is also studied how the plasma properties depend on the shape of the EEPF, the pulsing frequency and the duty cycle. For the sake of comparison, the studies are carried out for the conditions close to those in the experiments [16, 25, 27]. The calculated time-dependencies for densities of electrons and metastable argon
atoms are compared with measurements from [22, 27] for dust-free and dusty plasma.
2. Theoretical model
In the 0D model, it is assumed that the gas-discharge plasma has R = 15 cm radius and L = 7 cm height and consists of electrons with density ne, singly charged positive ions (Ar+)
with density ni, dust particles with density nd, radius ad and
negative charge eZd, ground-state argon atoms (Ar0) with
density na, metastable argon atoms (Arm) with density nm,
argon atoms in the resonance 4s states (3P1 and 1P1) (Arr) with
density nr as well as argon atoms in 4p states (Ar4p) with
density n4p. The metastable and resonance atom densities nm,
nr and n4p represent the density of a composite (3P0 and 3P2)
metastable level, the density of a composite (3P1 and 1P1)
resonance level and the density of a composite 4p state, respectively. It is assumed that ions and dust particles are at gas temperature Tg and ions have Maxwellian distribution. In
numerical simulations, the gas temperature Tg is considered to
be 294 K and 366 K in the dust-free and dusty cases, respectively [33].
The electron energy probability function (EEPF) is described by the following expression [34]
𝐹𝐹(𝜀𝜀) = 𝐴𝐴1𝑒𝑒𝑒𝑒𝑒𝑒( − 𝐴𝐴2𝜀𝜀𝑥𝑥), (1)
where ε is the electron energy and x takes different values according to the shape of EEPF: x = 1 and x = 2 for Maxwellian and Druyvesteyn electron energy distributions, respectively. The coefficients A1 and A2 are functions of x and
the average electron energy [34]
⟨𝜀𝜀⟩ = ∫ 𝜀𝜀
0∞𝐹𝐹(𝜀𝜀)√𝜀𝜀𝑑𝑑𝜀𝜀 =
3
2
𝑒𝑒𝑇𝑇
effand
𝑇𝑇
effis the effective electron temperature. The
EEPF has the following normalization ∫ 𝐹𝐹(𝜀𝜀)0∞ √𝜀𝜀𝑑𝑑𝜀𝜀 = 1. In most of the cases considered in the next section, we will assume that the EEPF is Druyvesteyn-like. This distribution is typical for laboratory plasmas sustained by an RF generator with the frequency f =13.56 MHz at ne < 1011
cm-3 and Pd > 0.2 Torr×cm [35], where P is the argon gas
pressure and d ≈ L/2 is the dimension of the reactor in cm. However, effects of variation of the EEPF shape on plasma properties will be also studied.
The particle balance equation for a species X (electrons and argon atoms in excited states) is given as
𝜕𝜕𝑛𝑛𝜕𝜕𝜕𝜕(𝑋𝑋)= ∑ 𝑅𝑅𝑖𝑖 𝐺𝐺,𝑖𝑖(𝑋𝑋)− ∑ 𝑅𝑅𝑖𝑖 𝐿𝐿,𝑖𝑖(𝑋𝑋), (2)
where 𝑅𝑅𝐺𝐺,𝑖𝑖(𝑋𝑋)and 𝑅𝑅𝐿𝐿,𝑖𝑖(𝑋𝑋) are, respectively, the rates for reactions of
the various generation and loss processes of the species X. It is assumed that in both pure argon and dusty pulsed plasmas, electrons are generated in collisions of electrons with argon atoms in the ground and excited states (4p and 4s states), as well as in metastable–metastable collisions (metastable pooling). In the dusty plasma, we assume that electrons can be additionally produced in one of the two processes: secondary
3
electron emission in collisions of excited argon atoms Ar*(Arm, Arr and Ar4p) with dust particles with the effective
secondary emission yield γm [22] and interaction of excited
atoms with acetylene molecules [27]. In the latter case, it is assumed that acetylene molecules are present in small amounts in the pulsed dusty plasma. The experimental procedure of making the dust plasma involves the use of acetylene as a precursor that could remain in the chamber from the previous phase of the experiment when the dust particles are formed in Ar/C2H2 plasma, or due to the desorption of
C2H2 from the chamber walls [27]. The interaction of excited
atoms with acetylene molecules is characterized by the quenching rate coefficient kq=5.6×10⁻¹⁰ cm3s-1 and by the
Penning branching ratio in Ar*- C2H2 reaction α = 0.3 [27].
Here, we consider the acetylene as an impurity with the very low density (~1011 cm-3) compared to the argon (~1015 cm-3)
in the dusty pulsed plasma. Therefore, these impurity molecules do not affect essentially the ion composition and the energy balance in the plasma volume.
The model assumes that electrons and ions are lost from the discharge because of their diffusion to the walls and by deposition on dust particles.
In the model, the ion density ni is found from the
quasineutrality condition
𝑛𝑛𝑖𝑖− 𝑛𝑛𝑒𝑒+ 𝑛𝑛𝑑𝑑𝑍𝑍𝑑𝑑= 0. (3)
Considering various collisional processes in the plasma volume, we account only for binary collisions. A reaction rate for such reactions is calculated as the product of the reactants’ densities and the rate coefficient K of the reaction, 𝑅𝑅 = 𝐾𝐾 × 𝑛𝑛𝛼𝛼𝑛𝑛𝛽𝛽, where 𝑛𝑛𝛼𝛼 and 𝑛𝑛𝛽𝛽 are the densities of the reactants. The
electron production and loss processes are listed in the table 1. The rate coefficients for reactions (R1)-(R4) are calculated using the corresponding reaction cross sections 𝜎𝜎 taken from [36-38] (𝐾𝐾 = ∫ 𝜎𝜎(𝜀𝜀)�2𝑒𝑒𝜀𝜀/𝑚𝑚0∞ 𝑒𝑒𝐹𝐹(𝜀𝜀)√𝜀𝜀𝑑𝑑𝜀𝜀, where
me is the electron mass). In the most cases considered in our
paper, the rate for metastable pooling is taken to be Kp = 1.24
×10-10 cm3/s (about 10 times smaller than in [39], as it was
proposed in [27]). The calculations are also carried out for the value Kp = 6.2 ×10⁻¹⁰ cm3/s, which is commonly used in
simulation works [22, 40].
The rate for electron diffusion to the walls Rw is calculated
assuming that the total ion and electron fluxes to the walls are equal, i.e. 𝑅𝑅𝑊𝑊= 𝑛𝑛𝑖𝑖𝑘𝑘𝑤𝑤𝑖𝑖, where 𝑘𝑘𝑤𝑤𝑖𝑖= 2𝑢𝑢𝐵𝐵𝑅𝑅
2ℎ𝐿𝐿+𝑅𝑅𝐿𝐿ℎ𝑅𝑅
𝑅𝑅2𝐿𝐿 . Here,
𝑢𝑢𝐵𝐵= ⟨𝜀𝜀⟩1/2�2𝑒𝑒𝑚𝑚
𝑖𝑖�
1/2 𝛤𝛤(𝜉𝜉1)
[𝛤𝛤(𝜉𝜉2)𝛤𝛤(𝜉𝜉3)]1/2 is the Bohm velocity [34],
𝛤𝛤(𝜉𝜉) is the gamma function with 𝜉𝜉1= 3/2𝑒𝑒, 𝜉𝜉2= 5/2𝑒𝑒 and
𝜉𝜉3= 1/2𝑒𝑒, mi is the ion mass and hL and hR are the edge to
centre positive ion density ratios [34]. The rate coefficient for collisions of argon atoms in excited states with dust particles is 𝐾𝐾𝑚𝑚𝑑𝑑 = 𝜋𝜋𝑎𝑎𝑑𝑑2�8𝑒𝑒𝑇𝑇𝑖𝑖/𝜋𝜋𝑚𝑚𝑖𝑖. The rate coefficient for deposition
of electrons on negatively charged dust particles is calculated as 𝐾𝐾𝑒𝑒𝑑𝑑= 𝜋𝜋𝑎𝑎𝑑𝑑2∫ �1 +−𝜑𝜑∞𝑠𝑠 𝜑𝜑𝜀𝜀𝑠𝑠��2𝑒𝑒𝜀𝜀𝑚𝑚𝑒𝑒𝐹𝐹(𝜀𝜀)√𝜀𝜀𝑑𝑑𝜀𝜀, where 𝜑𝜑𝑠𝑠=𝑒𝑒𝑍𝑍𝑎𝑎𝑑𝑑𝑑𝑑
is the dust surface potential. In the case when acetylene
impurity is in the plasma, we assume that Ar* - С2H2 collisions
are accompanied by production of electrons (table 1) and by loss of Ar* atoms (table 2). Since the density of С2H2
molecules is assumed to be very low here, we do not consider in our model the following products of this reaction: С2H2+,
С2H and H.
Table 1. Production and loss processes of electrons relevant
for the model.
Reaction Rate Reference (R1) e + Ar0 → Ar+ + 2e KR1= f(F,σ) [36] (R2) e + Arm→ Ar+ + 2e KR2 = f(F,σ) [37] (R3) e+ Arr → Ar+ + 2e KR3 = f(F,σ) [37] (R4) e + Ar(4p) → Ar+ + 2e KR4= f(F,σ) [38] (R5) Arm + Arm → Ar + Ar+ + e Kp [27, 40] (R6) Arm + Arr → Ar + Ar+ + e 2.1×10 −9 cm3s-1 [41] (R7) Ar(4p) + Ar(4p) → Ar+ + Ar + e 5.0×10 −10 cm3s-1 [41] (R8) dust(Zd) +Ar* → dust(Zd +γm) +γme+ Ar0 𝐾𝐾𝑚𝑚𝑑𝑑 [22] (R9) e → wall Rw [34] (R10) e + dust(Zd) → dust(Zd -1) d e
K
[42] (R11) Ar* + С2H2 → С2H2+ + Ar + e αkq [27]The reactions listed in table 2, as well as the reactions (R2) –(R8) in table 1 are used to calculate the 4s resonant and 4p atoms densities.
The diffusion of metastable atoms to the walls is described by the rate 𝐷𝐷𝑚𝑚/𝛬𝛬2, where Dm ≈ 2.42 × 10¹⁸/na is the
metastable diffusion coefficient [22, 40], na in cm−3 and 𝛬𝛬 =
1/�(𝜋𝜋/𝐿𝐿)2+ (2.405/𝑅𝑅)2 is the effective diffusion length.
In the afterglow, the effective electron temperature is lower than in the on-period and the energetic tail of the EEPF is depleted because of deposition of high energetic electrons on the chamber walls and dust particles [43]. Thus, we assume that in the afterglow, the rate KR16 is smaller (here, in 5 times)
than in the on-period and the rate KR15 is
0.2 ∫ 𝜎𝜎0∞ 15(𝜀𝜀)�2𝑒𝑒𝜀𝜀/𝑚𝑚𝑒𝑒𝐹𝐹(𝜀𝜀)√𝜀𝜀𝑑𝑑𝜀𝜀. For the on-period, the
reaction rates are KR16 = 2×10⁻⁷ cm3/s [40] and 𝐾𝐾𝑅𝑅15=
∫ 𝜎𝜎0∞ 15(𝜀𝜀)�2𝑒𝑒𝜀𝜀/𝑚𝑚𝑒𝑒𝐹𝐹(𝜀𝜀)√𝜀𝜀𝑑𝑑𝜀𝜀, where 𝜎𝜎15 is the cross section
for reaction R15 according to [44].
In our model, the time evolution of the effective electron temperature is found from the power balance equation:
𝜕𝜕𝜕𝜕𝜕𝜕�32𝑒𝑒𝑛𝑛𝑒𝑒𝑇𝑇eff� =(𝑃𝑃abs−𝑃𝑃𝑉𝑉𝑙𝑙𝑙𝑙𝑠𝑠𝑠𝑠), (4)
where 𝑃𝑃abs is the power absorbed in the plasma volume 𝑉𝑉 =
𝜋𝜋𝑅𝑅2𝐿𝐿 and 𝑃𝑃
loss = 𝑃𝑃coll+ 𝑃𝑃𝑤𝑤+ 𝑃𝑃𝑑𝑑. Here, 𝑃𝑃𝑐𝑐𝑐𝑐𝑐𝑐𝑐𝑐 =
𝑒𝑒𝑛𝑛𝑒𝑒𝑛𝑛𝑎𝑎𝑉𝑉𝜀𝜀𝑐𝑐𝐾𝐾𝑅𝑅1 is the power loss due to elastic and inelastic
collisions of electrons with Ar atoms, 𝜀𝜀𝑐𝑐 is the collisional
4
calculated using the cross-sections in [36]. 𝑃𝑃𝑤𝑤=
𝑒𝑒𝑛𝑛𝑖𝑖𝑢𝑢𝐵𝐵(2𝜋𝜋𝑅𝑅2�𝐿𝐿𝜀𝜀𝑤𝑤𝐿𝐿+ 2𝜋𝜋𝑅𝑅𝐿𝐿�𝑅𝑅𝜀𝜀𝑤𝑤𝑅𝑅) is the power loss due to
charged particle fluxes to the walls, 𝜀𝜀𝑤𝑤𝐿𝐿= 𝜀𝜀𝑖𝑖+ 𝜀𝜀𝑒𝑒+ 𝑉𝑉𝑒𝑒𝑐𝑐 is the
energy loss per charged particle for the on-period in the direction parallel to the discharge axis, 𝜀𝜀𝑤𝑤𝐿𝐿= 𝜀𝜀𝑖𝑖+ 𝜀𝜀𝑒𝑒 is the
same for the off-period when the electron energy is much smaller than the electrode bias 𝑉𝑉𝑒𝑒𝑐𝑐 and electrons do not deposit
on the electrodes, 𝜀𝜀𝑤𝑤𝑅𝑅 = 𝜀𝜀𝑖𝑖+ 𝜀𝜀𝑒𝑒 is the energy loss per charged
particle for the direction perpendicular to the discharge axis for the both on- and off-periods. 𝜀𝜀𝑖𝑖 is the mean kinetic energy
lost per ion [34] and 𝜀𝜀𝑒𝑒 is the mean kinetic energy lost per
electron [34]. Pd is the power loss to the dust particles [45].
The energy loss in collisions of electrons with С2H2 molecules
is neglected in this model because of low С2H2 density.
Table 2. Production and loss processes of excited argon atoms
used in the model, additionally to those in table 1.
Reaction Rate Reference (R12) e + Ar0→ Arm + e KR12= f(F,σ) [46] (R13) e + Ar0→ Arr + e KR13= f(F,σ) [46] (R14) e + Ar0→ Ar(4p) + e KR14= f(F,σ) [46] (R15) e + Arm→ Ar(4p) + e KR15= f(F,σ) [44] (R16) e + Arm→ Arr + e KR16 [40] (R17) e + Arr→ Arm + e 9.1×10⁻⁷ cm3s-1 [41] (R18) e + Arr→ Ar(4p) + e KR18= f(F,σ) [44] (R19) e + Arm→ Ar0 + e KR19= f(F,σ) [46, 47]a (R20) e + Arr→ Ar0 + e KR20= f(F,σ) [46, 47]a (R21) e + Ar(4p) → Ar0 + e KR21= f(F,σ) [46, 47]a (R22) Ar0+ Arm→ Ar0 + Ar0 2.1×10⁻¹⁵ cm3s-1 [41] (R23) Arr → Ar +
ω
105 s-1 [41] (R24) Ar(4p) → Ar + ω
3.2×10⁷ s-1 [41] (R25) Ar(4p) → Arm + ω
3.0×10⁷ s-1 [41] (R26) Ar(4p) → Arr + ω
3.0×10⁷ s-1 [41] (R27) Arm → Ar0 (wall) D Λm/ 2 [22, 40] (R28) Ar* + С2H2 → С2H + H+ Ar + e or С2H2+ Ar + ω
(1-α)kq [27]a Obtained by applying the principle of detailed balancing
to the cross section given in the cited reference.
We assume that the power is modulated by an ideal rectangular waveform max abs
for ( 1)
( 1)
,
0 for ( 1)
,
P
k
t k
P
k
t k
τ
τ ητ
τ ητ
τ
−
≤ < −
+
=
−
+
≤ <
where τ is the full cycle period, η is the duty cycle, and k is a positive integer. Pabs =Pmax for the on-period and Pabs = 0 for
the off-period. The time averaged absorbed power for the full cycle < 𝑃𝑃abs > is η𝑃𝑃𝑚𝑚𝑎𝑎𝑥𝑥.
Considering the afterglow phase, we additionally assume that due to the production of energetic electrons in metastable– metastable collisions, super-elastic electron–metastable
collisions and emission processes, the effective electron temperature cannot be smaller than the afterglow temperature
Taft ≤ 0.15 eV, i.e. after its decay to reach Taft, Teff becomes
time-independent. Taft is a parameter chosen to match
theoretical results and experimental data well.
The next equation of our system is the equation for the dust particle charge. The standard OML theory is usually used to describe the equilibrium dust charge in complex plasma. Nevertheless, several authors have shown that in the case of complex plasma OML theory fails to describe the dust charging in an appropriate way [48]. In order to describe the dust charging more accurately we (i) correct the ion current to the dust particles taking into account the ion neutral collisions [48] and (ii) include the additional processes which are relevant for dust charging [24, 25]. These processes, such as
secondary electron emission by collisions of excited argon
atoms with dust, have been neglected by OML theory. Nevertheless they play a significant role in dust charging/discharging processes under certain conditions [24, 25]. According to the assumptions (i) and (ii) the time – dependent dust charge follows the equation
𝜕𝜕𝑍𝑍𝑑𝑑
𝜕𝜕𝜕𝜕 = 𝐾𝐾𝑖𝑖𝑑𝑑𝑛𝑛𝑖𝑖+ 𝛾𝛾𝑚𝑚𝐾𝐾𝑚𝑚𝑑𝑑(𝑛𝑛𝑚𝑚+ 𝑛𝑛𝑟𝑟+ 𝑛𝑛4p) − 𝐾𝐾𝑒𝑒𝑑𝑑𝑛𝑛𝑒𝑒. (5)
Here d 2
(
8)
0.5(
1 2 2)
i d i i S a ia
K ≈a πeT m +ξτ+Hξ τ λ σn is the rate
for collection of ions by dust particles, which accounts for ion-neutral collisions in the sheath around a dust particle [48]. τ
=Teff/Ti,
ξ
= Z e a Td(
d eff)
andσ
ia≈
10
−14cm2 is thecross-section for ion-neutral collisions. The function H has the following asymptotes: H ~ 0.1 for 0.1 ≤β ≤10; Η~ β for
β << 1 and H ~ β−2 (lnβ )3for β >>1 [48], where
( )
d s i
Z e T
β
=λ
and λs is the screening length, which is of thesame order as the Debye length [1].
The second term in the right-hand side of equation (5) accounts for electron emission in metastable-dust collisions. This process is not considered with acetylene impurity inside the plasma. The last term in the right-hand side of equation (5) describes the electron losses to the dust. When the plasma equilibrium is established, like at the end of the on- phase, the left -hand side of (5) becomes zero. Further, if the secondary electron emission is neglected when e.g. the density of argon reactive species is low, the equation (5) simplifies to the standard form used in OML theory.
The equations for each particle (electrons, excited argon atoms in metastable and 4s and 4p resonance states), the power balance equation and the equation for dust charge are solved by using the DVODE package [49]. First, it is found a steady-state (𝜕𝜕𝜕𝜕𝜕𝜕 = 0) solution of these equations corresponding to Pabs
=Pmax. Then, using this solution, the plasma parameters (ne,
nm, nr, n4p, - Zd and Teff) as a function of time are calculated for
the case of pulsed plasma.
5
Using the volume-averaged model, we have calculated plasma properties (ne, nm, Teff and Zd) as a function of time in
dust-free and dusty plasma. The simulations have been carried out for the conditions typical to experiments on pure argon and argon/dust pulsed plasmas [22, 27], in particularly, for the same electron densities at the end of the on-period as in the experiments. The calculated time-dependencies for electron and metastable densities have been compared with the experimental values in [22, 27]. We have also analyzed how these plasma parameters depend on the EEPF shape (which is characterized by the parameter x), the pulsing frequency and the duty cycle.
3.1. Calculated time-dependencies of different plasma properties and their comparison with experimental values
In the experiments [22, 27], a 13.56 MHz capacitively-coupled plasma discharge is ignited between two parallel plate
R=15 cm radius electrodes L=7 cm separated. Both electrodes
are powered by an RF signal with power in the range 10 to 80 W and delivered from an RF generator through a specially designed matching box. The working gas is either pure argon or argon-acetylene mixture at a continuous flow rate of 8 sccm (argon) and 0.5 sccm (acetylene), keeping the total pressure constant at 10 Pa. The discharge is driven either in CW or in pulsed mode, with a variable pulsing frequency and a fixed duty cycle of 0.5.
To generate the dust particles, it is necessary to use the acetylene precursor, which in some particular plasma conditions initiate the dust growth. In CW mode the nanoparticles are forming spontaneously after adding the acetylene to the argon. In the pulsed regime, however, it is necessary to run the discharge for at least 3 min and at pulsing frequencies above 700 Hz in order to form the dust [27]. Interrupting the C2H2 flow stops the nanoparticles’ growth and
for the next few minutes the particles stay imprisoned in the plasma bulk even at the lower pulsing frequency, thus forming the argon-dust plasma without C2H2. After forming the dust,
the discharge is driven with the RF signal modulated by a rectangular signal frequency of 105 Hz with 0.5 duty cycle. Electron density is measured by microwave interferometry [16], while metastable density is deduced using laser absorption spectroscopy [27, 50]. Both measurements give values integrated over the plasma length.
3.1.1. Dust-free pulsed plasma
Figure 1 illustrates the temporal behavior of the line-of-sight averaged electron density (a) and Ar* 1s5 metastable
density (b) measured at the mid-plane between electrodes and the corresponding simulation results. Numerical results are obtained for Vel =58.0 V [51], Kp = 1.24 ×10⁻¹⁰ cm3/s, Taft =
0.15 eV, Tg = 294 K and x=2. Note that figure 1 shows cycles
taken in a middle of a long sequence, so before 0 s it is the end of another cycle. For both species, good quantitative agreement exists between the calculated and experimental time-dependencies. However, the agreement is better for the
afterglow phase than for the on-period where the model gives a faster increase at the beginning of the on-period. In addition, there is a maximum in the calculated nm at the beginning of
the on-period that is not observed in the experiment.
Figure 1. Electron (a) and metastable (b) densities as a
function of time in a pure argon pulsed plasma. Solid lines — model; black squares — experiment [22, 27, 33]. Zero time indicates the beginning of the on-period. The off-period (afterglow phase) starts at 4.75 ms and ends at 9.5 ms.
Figure 2. Teff (a), ne (b), nm/nm0 (c) and -Zd (d) in an argon/dust
pulsed plasma. (i) The solid and dotted curves are calculated taking into account secondary electrons in metastable-dust collisions with nm0=9.82×1010 cm-3, Taft = 0.05 eV or Taft = 0.1
eV for the solid and dotted curves, respectively; (ii) dashed curves – electrons are generated in collisions of metastable atoms with acetylene molecules with nm0=9.64×1010 cm-3 and
Taft = 0.1 eV. For the comparison, the dash-dotted curve in
figure (a) represents Teff in a pure argon pulsed plasma. The
black squares in figures (b) and (c) are experimental data from [22, 27]. nm0=1.75×1011 cm-3 is a measured value reported in
6
During the on-period, nm depends on ne and Teff strongly,
because the formation of metastable atoms occurs mainly in collisions of electrons with argon atoms in the ground state. During the initial stage of the on-period, a sharp spike in Teff
is observed (figure 2(a)). This is due to a small number of electrons left in the discharge at the end of the previous afterglow phase. At the beginning of the new on-period, the RF power is absorbed by this small number of electrons inducing their strong heating and thus a higher Teff explaining
also the sharp spike in nm. Note that spikes in the electron
temperature and density of excited species at the very beginning of the on-period are observed in a few numerical and experimental studies on pulsed plasmas in various reactor geometries and plasma conditions [52 - 54].
In the afterglow phase, ne and nm monotonically decrease
mainly due to diffusion to the chamber walls [22]. Nevertheless, the loss of metastable atoms in collisions with electrons prevails in the early afterglow [22].
3.1.2. Dusty plasma
The presence of dust in plasma introduces additional production and loss processes for electrons and Ar metastables. Two additional processes are analyzed separately in two different scenarios: (i) secondary electrons are generated by metastable–dust collisions; (ii) production of electrons by collisions of metastable atoms with acetylene impurity remaining in the plasma from the dust formation stage [27]. In the case (i), we use γm = 0.2 and two different
afterglow temperatures Taft (0.05 eV and 0.1 eV). In the case
(ii), Taft is 0.1 eV and the acetylene density nC2H2 is 1011 cm-3,
according to the figure 11(a) in [27]. In both cases, we assume that ad = 50 nm, nd = 3.0 × 107 cm-3, Tg = 366 K [22], Kp = 1.24
× 10-10 cm3/s, Vel =34.0 V [51] and x=2.
The calculated ne and nm follow relatively well the
experimental values in the case (ii) and the case (i) with Taft =
0.05 eV. However, in the late afterglow, the decay time for electron density in the case (ii) is slightly shorter than in the case (i) with Taft = 0.05 eV (figure 2(b)). This is due to larger
Taft and, as a consequence, larger loss of electrons due to
diffusion to the walls in the former case. At larger Taft, the
electron flux to dust particles enhances, increasing the absolute value of dust charge number |Zd|. Therefore, |Zd| in
late the afterglow in the case (i) and Taft = 0.05 eV is smaller
than in the case (ii) (figure 2(d)). In addition, the secondary electron emission in metastable -dust collisions is stronger in the case (i), which reduces the negative charge on dust particles in comparison with case (ii). If Taft is the same in both
cases (i) and (ii), the loss of electrons on dust particles in the afterglow is larger in the case (i) because of smaller |Zd| (figure
2(d)) due to secondary emission. Because of larger electron loss on dust particles, in the off-period ne drops faster in the
case (i) than in the case (ii) for the same Taft (figure 2(b)). In
both cases (i) and (ii), the calculated metastable densities are nearly 1.8 times smaller than the densities measured in the experiment. This difference may be explained by simplifications introduced in the model, which will be discussed later.
Insertion of dust particles into a plasma during the on-period is accompanied by a decrease in the electron density (figures 2(b) and 1(a)) and an increase in the effective electron temperature (figure 2(a)) and the density of metastable argon atoms (figures 2(c) and 1(b)). Due to the loss of electrons and metastable atoms on dust particles, the calculated electron and metastable densities increase more slowly at the very beginning of the on-period in the presence of dust particles compared to the dust-free case (figures 1 and 2).
In the on-period, the density of ions (𝑛𝑛𝑖𝑖= 𝑛𝑛𝑒𝑒+ 𝑛𝑛𝑑𝑑|𝑍𝑍𝑑𝑑|)
in the dusty plasma is smaller than 𝑛𝑛𝑖𝑖(= 𝑛𝑛𝑒𝑒) in the dust-free
case (figures 1(a) and 3). This decrease in the ion density in the dusty plasma, comparing with the dust-free plasma, is due to the decrease of electron density. In the beginning of the off-period, the density of ions in the dusty plasma drops faster than 𝑛𝑛𝑒𝑒 in the dust-free and dusty plasma. The significant number
of Ar+ ions is captured by negatively charged dust particles,
which causes this fast ion decay. The term 𝐾𝐾𝑖𝑖𝑑𝑑𝑛𝑛𝑖𝑖 in equation
(5) can be essentially larger than the term 𝐾𝐾𝑒𝑒𝑑𝑑𝑛𝑛𝑒𝑒 (see figure
4(b) of [22]) because the rate 𝐾𝐾𝑒𝑒𝑑𝑑 depends strongly on Teff (for
example, if the Maxwellian is assumed this dependence is nearly exponential), while the rate 𝐾𝐾𝑖𝑖𝑑𝑑 depends weakly of the
effective electron temperature. The rate 𝐾𝐾𝑖𝑖𝑑𝑑 decreases with
decreasing |𝑍𝑍𝑑𝑑| and, therefore, for most of the off-period,
when |𝑍𝑍𝑑𝑑| is small (figure 2(d)), the decay time for 𝑛𝑛𝑖𝑖 is nearly
the same as that for 𝑛𝑛𝑒𝑒 in the late afterglow (figures 2(b) and
3).
Figure 3. ni as a function of time. The solid and dashed curves
are obtained for the same conditions as the solid and dashed curves in figure 2(b), respectively.
In the on-period, the production of electrons occurs mainly due to electron-atom collisions, while this production process can be neglected in the afterglow. In the off-period, the main processes of electron generation are collisions of metastable atoms with other species (acetylene molecules or dust particles). In the beginning of the afterglow phase, when the metastable density is high enough, the electron production in metastable collisions is dominating the loss of electrons on the walls and dust particles, which causes a peak of ne in the
afterglow (at t~ 5.2 ms in figure 2(b)) [22, 27].
3.2. Effects of variation in the EEPF shape
Next, we analyze how a variation in the EEPF shape affects the plasma properties. For that, we vary the parameter
7
x in equation (1), while other process parameters, including ne
at the end of the on-period (at t = 4.75 ms in figure 4(a)), remain fixed.
3.2.1. Dust-free pulsed plasma
Figure 4. Calculated ne (a), Teff (b) and nm (c) as functions of
time in a pure argon pulsed plasma for different shapes of the EEPF: Solid line – x = 2, dashed line – x = 1.5 and dotted line – x = 1.
In figure 4, the time-dependencies for ne, Teff and nm are
shown for different x in the case of pure argon plasma. The external conditions and assumptions are the same as in figure 1. One can see in figure 4(b) that Teff in the on-period becomes
higher with increasing x because the electron energy probability function becomes more convex [55]. Due to the temperature increase, the densities of excited argon atoms, including metastables, increase too (figure 4(c)). Meanwhile, the density of electrons in the afterglow becomes smaller with increasing x (figure 4(a)) due to an enhancement of the electron loss on the walls because of the increase of the Bohm velocity. In particular, 𝑢𝑢𝐵𝐵= �𝑒𝑒𝑇𝑇eff/𝑚𝑚𝑖𝑖 and 𝑢𝑢𝐵𝐵=
�3 × 0.457𝑒𝑒𝑇𝑇eff/𝑚𝑚𝑖𝑖 [55] for x =1 and x = 2, respectively.
Here, at the beginning of the afterglow, Teff (x =2) > Teff (x =1),
while these temperatures are equal to each other for large afterglow times.
For the case x =1, the calculated metastable density during most of the on-period is essentially smaller than that obtained in the experiment (figures 1(b) and 4(c)). According to the model the Druyvesteyn EEPF leads to the better agreement between calculated and measured values of nm(t) than
Maxwellian EEPF.
3.2.2. Dusty pulsed plasma
In figure 5, Teff, nm and ne as functions of time are shown
for the case of dusty plasma and different x. The input parameters are ne(t=4.75 ms)=1.3×109 cm-3, nC2H2= 1011 cm-3
and Taft = 0.1 eV, and the production of electrons by
electron-atom, metastable-metastable and metastable–acetylene collisions is assumed. Other parameters and assumptions, are the same as in figure 2.
Figure 5. Teff (a), nm (b) and ne (c) for different x: 2 (solid
line), 1.5 (dashed line) and 1.0 (dotted line). (d) ne calculated
(solid line) for x=1, Kp =6.2×10⁻¹⁰ cm3/s, Taft = 0.05 eV, nC2H2
=1011 cm-3 and the same other conditions as in figure 2. The
black squares in figure (d) are experimental data from [22, 27]. As in the case of the Druyvesteyn EEPF (figures 1 and 2), the density of metastable atoms and the effective electron temperature during the on-period are higher in a pulsed dusty plasma than in a dust-free plasma (figures 4 and 5) for the same x (=1 or 1.5). As in the case of dust-free pulsed plasma,
nm and Teff increase when x becomes larger (figures 5(a) and
5(b)). The increase of nm with x is accompanied by an
enhancement of electron production in metastable-metastable collisions and collisions of metastable atoms with C2H2
molecules and, as a result, the electron density in the off-period increases also (figure 5(c)).
Note that the time-dependence for ne in the case x = 1
(figure 5(c)), differs essentially from the experimental data (figure 2(b)). Moreover, at the end of the on-period, the calculated metastable densities for x=1 and x=1.5 (figure 5(b)) are much smaller than the measured one (1.75×1011 cm-3).
The time-dependence for ne calculated in the case x = 1
may agree well with the experimental data if one assumes that the metastable pooling process is stronger. Figure 5(d) compares the experimental data and the model results for the
8
x = 1 and Kp =6.2×10⁻¹⁰ cm3/s instead of 1.24×10⁻¹⁰ cm3/s. (Kp
=6.2×10⁻¹⁰ cm3/s is commonly used in the literature [22, 32].)
Although the overall agreement is better, the stronger metastable pooling leads to much shorter electron decay time in the afterglow than expected, since ne ~ nm2. Recent analysis
[27] suggests the metastable pooling rate by order of magnitude smaller than the rate commonly used in the literature [22, 32]. In this way, by using new smaller pooling rate and Druyvesteyn EEPF the properties of argon/dust pulsed plasma are described in better agreement with the experiment.
3.3. Effects of variation in the pulsing frequency
Properties of pulsed plasmas also depend on the pulsing frequency νp=1/τ [52, 53]. Therefore, we analyze how a
variation in the pulsing frequency affects plasma properties.
3.3.1. Dust-free plasma
First consider the case of dust-free plasma. In figure 6, the electron and metastable densities and effective electron temperature as functions of time in a dust-free pulsed plasma are shown for different pulsing frequencies: 210, 840, 1680 and 6720 Hz.
Figure 6. ne (solid line), nm (dashed line) and Teff (dotted line)
for the dust-free plasma and the different pulsing frequencies: 210 (a), 840 (b), 1680 (c) and 6720 (d) Hz. The other conditions are the same as in figure 1. The lines 1 and 2 correspond, respectively, to ne and nm (nm/10 for figure 6(d))
calculated for the CW discharge with 𝑃𝑃abs= 𝑃𝑃max, where Pmax
= 8.7 W. The line 3 in figure 6(d) corresponds to Teff in the
CW case.
It can be seen from figure 6 that ne during the on-period
can become equal to the density in the CW discharge, in which 𝑃𝑃abs= 𝑃𝑃𝑚𝑚𝑎𝑎𝑥𝑥, if the pulsing frequency is not high (here, νp ≤
1680 Hz). For large νp values (for example, 6720 Hz), the
maximum electron density during the on-period is less than ne
in the CW discharge due to short duration of the on-period (figure 6(d)). The maximum effective temperature in the on-period of the pulsed plasmas is also higher than the temperature corresponding to the CW mode (Teff is nearly 2.95
eV). With an increase in the pulsing frequency, the minimum values of ne, nm and Teff (if the minimum temperature is larger
than 0.15 eV) become larger because of decreasing the off-time (figure 6). Since at large values of νp the effective
temperature during most on-time is higher than that in the CW discharge, the metastable density during the full cycle in the pulsed plasma is larger than nm in the CW case (figure 6(d)).
3.3.2. Dusty plasma
Figure 7. ne (solid line), nm/10 (dashed line) and Teff (dotted
line) as a function of time in Ar/dust pulsed plasma at different
νp: 210 (a), 840 (b), 1680 (c) and 6720 (d) Hz. The line 1
describes ne, the line 2 describes nm/10 and the line 3 (only in
(d)) Teff for the CW plasma with 𝑃𝑃abs= 𝑃𝑃max. Here, Pmax =
12.6 W and the other conditions are the same as in figure 2. Next consider how a variation of the pulsing frequency affects the properties of an argon pulsed plasma if the plasma contains dust particles. In figure 7, the calculated time-dependencies for ne, nm and Teff are shown for different νp.
Again, it is assumed that electrons are produced in electron-atom, metastable-metastable and metastable-acetylene collisions. According to figure 7, if the pulsing frequency is low (for all the cases in figure 7, except for the νp 6.72 kHz)
and 𝑃𝑃abs= 𝑃𝑃max the electron densities in pulsed and CW
plasma are equal for the most of the on-period, like in the dust-free plasma.
9
Note that for high pulsing frequencies, the metastable density in the pulsed dusty plasma during the full cycle is smaller than in the CW dusty plasma (figures 7(c) and 7(d)). This is opposite to the dust-free plasma, where nm in a pulsed
plasma with large νp is higher than the CW metastable density
(figure 6(d)). Since in both the dust and dust-free pulsed plasmas with high νp the electron density for the most of the
on-period is smaller than the electron density in the CW plasma, the difference in nm, in our opinion, is due to a
difference in Teff. Indeed, Teff in the pulsed dusty plasma varies
faster than in the dust-free plasma because of the electron energy loss on dust particles [22].
At high pulsing frequencies (for example, at 6720 Hz),
Teff in the second half of the on-period is nearly the same as
that in the CW dusty plasma (figure 7(d)). In the case of pure argon plasma, the effective temperature varies more slowly during the on-period, and at large νp, Teff during most of the
on-period is higher than the temperature of the CW discharge (figure 6(d)). Moreover, for the same high pulsing frequencies, Teff in the off-period decreases more rapidly and
to lower values, if dust particles are in the plasma. Therefore, the production of metastable atoms in electron-atom collisions in the afterglow lasts longer in the dust-free plasma.
There is another difference between pulsed dust-free and dusty plasmas. At some νp, the electron density decreases
rapidly in the very beginning of the on-period in the dusty case (figures 7(b) and 7(c)). In our opinion, the increase of Teff at
the beginning of the on-period leads to the higher electron flux to the dust particles and the rapid decrease of ne (figure 8(a)).
Figure 8. (a) The rates 𝐾𝐾𝑒𝑒𝑑𝑑𝑛𝑛𝑑𝑑 (solid line), 𝑛𝑛𝑖𝑖𝑘𝑘𝑤𝑤𝑖𝑖/𝑛𝑛𝑒𝑒
(dash-dotted line), αkq(nm+nr+n4p)nC2H2/ne (dashed line) and 𝐾𝐾𝑝𝑝𝑛𝑛𝑚𝑚2/
𝑛𝑛𝑒𝑒 (dotted line) as functions of time for the 210 Hz pulsed
dusty plasma. (b) The normalized dust charge (dashed line) and the normalized effective electron temperature (solid line) for the 1680 Hz pulsed dusty plasma. Here, Zd0 = - 152.64 and
Te0 = 3.88 eV, and the other external conditions are the same
as in figure 7.
Our calculations show that the rapid decrease of ne in the
beginning of the on-period is not observed at low νp (figure
7(a)), and the decrease is small for high νp (figure 7(d)). We
do not observe the decrease of ne at low νp because of small
electron density at the end of the off-period. At smaller ne in
the end of the afterglow phase, the overshoot in Teff in the
beginning of the on-period is sharper [52]. As a consequence, at low νp, production of electrons due to ionization grows very
rapidly when the power is turned on, and the production dominates the total electron loss at the beginning of the on-period. For the 6720 Hz, the decrease of electron density is smaller compared with the 840 Hz and 1680 Hz (figure 7) because of smaller rate 𝐾𝐾𝑒𝑒𝑑𝑑𝑛𝑛𝑑𝑑 at the end of the off-period, and,
consequently, smaller electron losses in the very beginning of the on-period. (𝐾𝐾𝑒𝑒𝑑𝑑𝑛𝑛𝑑𝑑= 0.7, 145.8 and 1282.8 s-1 at the end of
the off-period for the frequencies 6720, 1680 and 840 Hz, respectively). For large νp (≥ 1680 Hz), the loss of electrons
on the walls described by the rate 𝑛𝑛𝑖𝑖𝑘𝑘𝑤𝑤𝑖𝑖/𝑛𝑛𝑒𝑒 and the electron
production in collisions of excited atoms with acetylene molecules (described be the rate αkq(nm+nr+n4p)nC2H2/ne) and
in metastable-metastable collisions (described by the rate 𝐾𝐾𝑝𝑝𝑛𝑛𝑚𝑚2/𝑛𝑛𝑒𝑒) are more intensive than the loss of electrons on the
dust particles during the most of the off-period (figure 8(a)). The rate 𝐾𝐾𝑒𝑒𝑑𝑑𝑛𝑛𝑑𝑑 decreases rapidly in the beginning of the
off-period due to the decrease of the effective electron temperature, which drops faster than |Zd| (figure 8(b)). The
decrease of 𝐾𝐾𝑒𝑒𝑑𝑑𝑛𝑛𝑑𝑑 in the beginning of the off-period takes
place until Teff reaches the afterglow temperature Taft. After
that, the loss rate characterizing electron deposition on dust particles increases with time, since the amount of negative charge on dust particles decreases (figure 8).
3.4. Effects of variation in duty ratio on the plasma properties
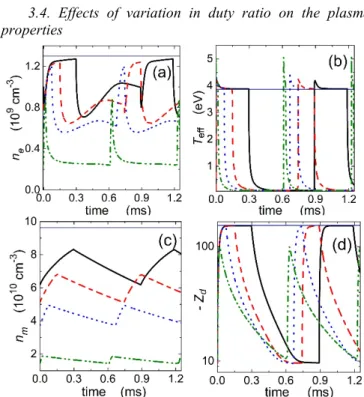
Figure 9. ne (a), Teff (b), nm (c) and -Zd (d) as a function of
time in argon/dust pulsed plasma for different duty cycles: 1/3 (solid line), 1/5 (dashed line), 1/9 (dotted line) and 1/33 (dash-dot-dotted line). The duration of the off-period is 19/32 ms. The horizontal lines are for the CW mode with 𝑃𝑃abs= 𝑃𝑃max.
The other external conditions are the same as for figure 7. In figure 9, the time-dependencies for ne (figure 9(a)), Teff
10
for the argon dusty plasma and different duty cycles: 1/3, 1/5, 1/9 and 1/33. For the sake of comparison, the same time-dependencies are also presented in figure 9 for the CW mode.
One can see from figure 9(a) that the maximum electron density decreases with decreasing η (figure 9(a)). The decrease of the maximum electron density is accompanied by a decrease of ne at the end of the afterglow stage. Since with
decreasing η, the input RF power in the beginning of the on-period is absorbed by a more limited number of electrons (smaller ne), the overshoot in Teff becomes sharper (figure
9(b)). Due to the decrease of ne, the metastable density
becomes smaller when η decreases (figure 9(c)).
With decreasing the duty cycle, the rapid decrease of ne at
the beginning of the on-period becomes less pronounced and is not observed at small η (for example, for the η = 1/33 in figure 9(a)). In our opinion, this is due to more rapid increase of Teff at the beginning of the on-period. Indeed, since the
effective electron temperature increases more rapidly with a decrease of η, the ionization rate for the production of electrons in electron-atom collisions also grows faster and, as a result, for small η the electron production dominates the total electron loss at the beginning of the on-period.
For small η, the amount of negative charges on dust particles at the end of the period decreases when the on-period becomes shorter (figure 9(d)). This is due to the decrease of the maximum electron density (figure 9(a)). The decrease of η is followed by the decrease of ion density too (the electron and ion densities are connected through the quasi -neutrality condition (3)). Moreover, for the small duty cycles the decay time of |Zd| in the afterglow phase is longer than for
large η (figure 9(d)). The decrease of ion density leads to the lower ion flux to the dust and the slower discharging of the dust particles for the smaller η.
We also studied how properties of a dust-free pulsed plasma depend on the duty cycle (the results are not shown here). It was found that, similarly to the dusty plasma, for small η the electron and metastable densities in the beginning of the off-period and ne at the end of the afterglow become
smaller with decreasing the duty cycle. With a decrease of η, the overshoot in Teff also becomes sharper.
4. Summary
In summary, we have developed a spatially-averaged model for an argon/dust pulsed plasma. Using the model, it has been shown how the plasma properties depend on the shape of electron energy probability function, the pulsing frequency and the duty cycle. The properties of a pure argon pulsed plasma have been also analyzed. The studies have been carried out for the external conditions close to the experimental conditions in [22, 27]. The calculated time-dependencies for electron and metastable atom densities have been compared with those obtained experimentally for dust-free and dusty plasma and found to be in a good qualitative agreement (figures 1 and 2).
In particular, it has been shown that for the same ne at the
end of the on-period, the effective electron temperature is higher and, as a result, the metastable atom density is larger in
the case of Druyvesteyn EEPF (x=2) than in the Maxwellian case (x=1). This is the case for both dust-free and dusty plasmas (figures 4 and 5). However, with increasing x, the electron density in the late afterglow decreases in the dust-free plasma (figure 4(a)), while it becomes larger in the dusty plasma (figure 5(c)). This decrease in the dust-free plasma is mainly due to an increase of the electron flux to the walls (because of increasing the Bohm velocity). The increase of ne
with x in the afterglow dusty plasma is due to an enhancement of production of electrons in collisions of metastable atoms with other species (as nm grows with x) such as acetylene
molecules remaining in the plasma from the dust formation stage. For both nd = 0 and nd ≠ 0, the calculated metastable
densitiesagree better in magnitude with the measured nm for
the Druyvesteyn than in the Maxwellian EEPF. The new proposed argon metastable pooling rate and the new Penning branching ratio for Ar*- C2H2 quenching [27] supports this
finding.
The pulsed plasma properties depend on the pulsing frequency. The metastable density in a dust-free pulsed plasma with high νp is larger than in the CW plasma for the
same Pabs and Pmax powers (figure 6(d)). This is opposite to
the dusty plasma, where nm at high νp is smaller than the
metastable density in the CW mode (figure 7(d)). As the effective electron temperature variates faster the collection of electrons by dust particles becomes larger and the nm smaller
[22]. Our calculations have also shown that the electron density in a pulsed dusty plasma may decrease rapidly at the beginning of the on-period because of the rapid enhancement of collection of electrons by dust particles (figures 7(b) and 7(c)).
The properties of pulsed dusty plasma also depend essentially on the duty cycle η. The electron densities at the very beginning and at the end of the off-period decrease with a decrease of η (figure 9(a)). With decreasing ne at the end of
the off-period, the effective electron temperature increases more rapidly in the beginning of the next on-period (figure 9(b)). The rapid increase of Teff is accompanied by an
enhanced production of electrons (in electron-atom collisions). This larger electron production dominates the total electron loss at small η resulting in the disappearance of the rapid decrease of ne at the beginning of the on-period (for
example, for η=1/33 in figure 9(a)). The rapid decrease in ne
is also absent when the off-period is long (figures 2(b) and 7(a)). In our opinion, this is due to the low electron density at the end of the afterglow phase.
Note that the results of modelling enable only the qualitative analysis of argon/dust pulsed plasmas. There are some quantitative discrepancies between the results obtained from the model and the experimental data (figures 1 and 2). that can be attributed to some simplifications in the model.
In particular, the 0D model does not account for the plasma nonuniformity. Dusty plasmas are inhomogeneous and not isotropic, especially in the presence of self-organized structures, such as dust voids [2, 56]. Another difference between the model and the experiment is that the model describes the electron and metastable densities averaged over the entire plasma volume, while ne and nm in the experiment
11
are the line-of-sight averaged densities measured at the mid-plane between the electrodes [27].
Further, to calculate the dust charge the ionization in the vicinity of a dust grain is neglected. If the ionization is important [57], the expression for the rate describing collection of ions by dust particles should be taken in the more
complicate form
(
)
0.5(
)
2 8 1 2 2 (1 ) d i d i i S a ia K ≈a πeT m +ξτ+Hξ τ λ σn +κ [57], where R1/
a inn K
κ
=
ν
, νin= eT mi/ i /λin andλ
in=
1/
n
a iaσ
is the ion mean-free path. Nevertheless, our calculations show that this effect does not change the dust charge and other plasma parameters significantly. This conclusion is not in contradiction with the results in [57]. In fact the results in [57] are obtained for the Maxwellian EEPF, while our results are calculated for the Druyvesteyn distribution. For the same Teff
Druyvesteyn distribution has fewer electrons at high energies, which results in lower ionization rate. If we use the Maxwellian distribution (figure 5), Teff ≤ 2.5 eV and the
ionization events also affect the dust charge insignificantly, what is in good agreement with the results on figure 1 in [57]. In our model, we assume that a small amount of acetylene may be present in the argon/dust plasma [27]. Due to the specific formation of the carbonacous dust particles in Ar/C2H2 plasma the presence of small amount of impurities is
inevitable [22, 27, 33]. However, the density of these impurities in the experiment is unknown at present. (To compare to the experiment the C2H2 density is assumed the
same as in [27]). Therefore, to improve the model of the argon/dust pulsed plasma, one needs more experimental data on the plasma composition. Note also that the model does not consider the growth of dust particles. Therefore, the main task in the future will be to extend this model to describe the formation and growth of hydrocarbon grains in Ar/C2H2
pulsed plasma.
To summarize, this study is only a first step on the way to self-consistent modelling of dusty pulsed plasmas with large dust densities. A complete approach should include the effects of the spatial nonuniformity and the ionization events on dust charge. We expect that including these effects in the model will give the time-dependencies for ne and nm which will be in
better qualitative agreement with experimental data than those obtained using this 0D model. Nevertheless, the model considers the main processes occurring in an argon/dust pulsed plasma, and the results from the model are in a good qualitative agreement with available experimental data. The results on dusty pulsed plasmas here are relevant to many applications involving nonstationary plasmas containing impurities, especially gas discharge plasmas used for synthesis of novel nanomaterials.
Acknowledgements
J B and E K would like to acknowledge the support from French Research Agency via ANR project PLASMABOND. I S is supported by Ministry of Education, Science and Technological Development of the Republic of Serbia
according to the contract between the Institute of Technical Sciences and the Ministry No. 451-03-68/2020-14/200175.
References
[1] Bouchoule A (ed) 1999 Dusty Plasmas: Physics, Chemistry, and
Technological Impacts in Plasma Processing (New York: Wiley)
[2] Vladimirov S V and Ostrikov K 2004 Phys. Rep. 393 175 [3] Fortov V E, Ivlev A V, Khrapak S A, Khrapak A G and Morfill G E 2005 Phys. Rep. 421 1
[4] Levchenko I, Keidar M, Cvelbar U, Mariotti D, Mai-Prochnow A, Fang J and Ostrikov K 2016 J. Phys. D: Appl. Phys. 49 273001 [5] Kersten H, Deutsch H, Stoffels E, Stoffels W W, Kroesen G M W and Hippler R 2001 Contrib. Plasma Phys. 41 598
[6] Winter J. 2000 Phys. Plasmas 7 3862
[7] Arp O, Block D and Piel A 2004 Phys. Rev. Lett. 93 165004 [8] Mikikian M and Boufendi L 2004 Phys. Plasmas 11 3733 [9] Thomas H, Morfill G E, Demmel V, Goree J, Feuerbacher B and Möhlmann D 1994 Phys. Rev. Lett.73 652
[10] Le Picard R, Markosyan A H, Porter D H, Girshick S L and Kushner M J 2016 Plasma Chem. Plasma Process. 36 941
[11] Denysenko I, Berndt J, Kovacevic E, Stefanovic I, Selenin V and Winter J 2006 Phys. of Plasmas 13 073507
[12] Denysenko I B et al 2019 Plasma Phys. Control. Fusion 61 014014
[13] Denysenko I B et al 2020 J. Phys. D: Appl. Phys. 53 135203 [14] Economou D J 2014 J. Phys. D: Appl. Phys. 47 303001 [15] Samukawa S and Mieno T 1996 Plasma Sources Sci. Technol. 5 132
[16] Berndt J, Kovačević E, Stefanović I and Boufendi L 2009 J.
Appl. Phys. 106 063309
[17] Hundt M, Sadler P, Levchenko I, Wolter M, Kersten H and Ostrikov K 2011 J. Appl. Phys.109 123305
[18] Bouchoule A, Plain A, Boufendi L, Blondeau J Ph and Laure C 1991 J. Appl. Phys. 70 1991
[19] Ivlev A et al 2003 Phys. Rev. Lett. 90 055003
[20] Couëdel L, Samarian A A, Mikikian M and Boufendi L 2008
Phys. Plasmas 15 063705
[21] Childs M A and Gallagher A 2000 J. Appl. Phys. 87 1086 [22] Denysenko I, Stefanović I, Sikimić B, Winter J, Azarenkov N A and Sadeghi N 2011 J. Phys. D: Appl. Phys. 44 205204
[23] Denysenko I B, Stefanović I, Sikimić B, Winter J and Azarenkov N A 2013 Phys. Rev. E 88 023104
[24] Berndt J, Kovacević E, Selenin V, Stefanović I and Winter J 2006 Plasma Sources Sci. Technol. 15 18
[25] Stefanović I et al 2006 Phys. Rev. E 74 026406
[26] Denysenko I B, Stefanović I, Azarenkov N A and Burmaka G P 2015 Phys. Plasmas 22 023702
[27] Stefanović I, Sadeghi N, Winter J and Sikimić B 2017 Plasma
Sources Sci. Technol. 26 065014
[28] Kolobov V I and Godyak V A 1995 IEEE Trans. Plasma Sci.
23 503
[29] Kortshagen U, Busch C and Tsendin L D 1996 Plasma Sources
Sci. Technol. 5 1
[30] Kaganovich I D and Tsendin L D 1992 IEEE Trans. Plasma Sci.
20 66
[31] Lieberman M A and Lichtenberg M A 2005 Principle of Plasma
Discharges and Material Processing, 2 nd ed. (New Jersey:
12
[32] Ferreira C M, Loureiro J and Ricard A 1985 J. Appl. Phys. 57 82
[33] Stefanović I, Sadeghi N and Winter J 2010 J. Phys. D: Appl.
Phys. 43 152003
[34] Thorsteinsson E G and Gudmundsson J T 2009 Plasma Sources
Sci. Technol. 18 045001
[35] Godyak V A, Piejak R B and Alexandrovich B M 1992 Plasma
Sources Sci. Technol. 1 36
[36] Phelps A V and Petrovic Z L 1999 Plasma Sources Sci. Technol.
8 R21
[37] Ali M A and Stone P M 2008 Int. J. Mass Spectrom. 271 51 [38] Deutsch H et al 2004 Int. J. Mass Spectrom. 233 39 [39] Kolokolov N B and Blagoev A B 1993 Phys.-Usp. 36 152 [40] Lymberopoulos D P and Economou D J 1993 J. Appl. Phys. 73 3668
[41] Thorsteinsson E G and Gudmundsson J T 2010 J. Phys. D: Appl.
Phys. 43 115201
[42] Denysenko I B, Kersten H and Azarenkov N A 2015 Phys. Rev.
E 92 033102
[43] Maresca A, Orlov K and Kortshagen U 2002 Phys. Rev. E 65 056405
[44] Mityureva A A and Smirnov V V 2004 Opt. Spektrosk. 97 508 [45] Denysenko I, Yu M Y, Ostrikov K and Smolyakov A 2004 Phys.
Rev. E 70 046403
[46] Yanguas-Gil A, Cotrino J and Alves L 2005 J. Phys. D: Appl.
Phys. 38 1588
[47] Bogaerts A, Gijbels R and Vlèek J 1998 J. Appl. Phys. 84 121 [48] Khrapak S A et al 2005 Phys. Rev. E 72 016406
[49] Byrne G D and Thompson S 2013 VODE_F90 Support Page, http: //www.radford.edu/~thompson/vodef90web
[50] Sadeghi N 2004 J. Plasma Fusion Res. 80 767
[51] Sikimić B, Stefanović I, Denysenko I B and Winter J 2013
Plasma Sources Sci. Technol. 22 045009
[52] Despiau-Pujo E, Brihoum M, Bodart P, Darnon M and Cunge G 2014 J. Phys. D. Appl. Phys. 47 455201
[53] Lieberman M A and Ashida S 1996 Plasma Sources Sci.
Technol. 5 145
[54] Carbone E, Sadeghi N, Vos E, Hübner S, van Veldhuizen E, van Dijk J, Nijdam S and Kroesen G 2015 Plasma Sources Sci. Technol.
24 015015
[55] Gudmundsson J T 2001 Plasma Sources Sci. Technol. 10 76 [56] Mikikian M et al 2003 New J. Phys. 5 19