HAL Id: hal-01602785
https://hal.archives-ouvertes.fr/hal-01602785
Submitted on 19 Sep 2019HAL is a multi-disciplinary open access
archive for the deposit and dissemination of sci-entific research documents, whether they are pub-lished or not. The documents may come from teaching and research institutions in France or abroad, or from public or private research centers.
L’archive ouverte pluridisciplinaire HAL, est destinée au dépôt et à la diffusion de documents scientifiques de niveau recherche, publiés ou non, émanant des établissements d’enseignement et de recherche français ou étrangers, des laboratoires publics ou privés.
Distributed under a Creative Commons Attribution - ShareAlike| 4.0 International License
Prediction of total silicon concentrations in French soils
using pedotransferfunctions from mid-infrared spectrum
and pedological attributes
Amélia Landre, Nicolas Saby, Bernard Barthès, Céline Ratié, A Guerin, A.
Etayo, Budiman Minasny, Marion Bardy, Jean-Dominique Meunier, Sophie
Cornu
To cite this version:
Amélia Landre, Nicolas Saby, Bernard Barthès, Céline Ratié, A Guerin, et al.. Prediction of total silicon concentrations in French soils using pedotransferfunctions from mid-infrared spectrum and pedological attributes. Pedometrics 2017, Jun 2017, Wageningen, Netherlands. 298 p. �hal-01602785�
1
Prediction of total silicon concentrations in French soils using
1pedotransfer functions from mid-infrared spectrum and pedological
2attributes
3 4Co-authors: Landré, A.a, Saby, N.P.A.a, Barthès, B.G.b, Ratié C.a, Guerin, A. c Etayo, A. c,
5
Minasny, B.d, Bardy, M.a, Meunier, J.-D.e, Cornu, S.e 6
a) INRA, Infosol, US 1106, Orléans, France 7
b) IRD, UMR Eco&Sols, Montpellier SupAgro, 2 place Viala, 34060 Montpellier Cedex 8
2, France 9
c) INRA, Laboratoire d'Analyses des Sols US, Arras, France 10
d) School of Life and Environmental Sciences and Sydney Institute of Agriculture, The 11
University of Sydney, NSW 2006, Australia 12
e) Aix-Marseille Univ, CNRS, IRD, Coll de France, INRA, CEREGE, Aix-en-Provence, 13 France 14 15
Abstract
16Silicon (Si) is the second most abundant element of the Earth’s crust, and its terrestrial cycle 17
depends on soil, vegetation, and human activities. The spatial extent of terrestrial Si 18
perturbation is poorly documented since maps of Si concentration in soils are rare. In 19
addition, Si content is rarely measured in non-paddy soil databases. Here we demonstrate that 20
pedotransfer functions based on either pedological attributes (particle size fraction, pH, 21
organic carbon, cation exchange capacity, calcium carbonate and parent material) or mid 22
infrared spectra (MIRS) can be used to accurately predict total Si concentration. In this 23
2
research, we utilised a unique dataset from the French monitoring network of soil quality 24
(RMQS - Réseau de Mesures de la Qualité des Sols) database. Pedotransfer functions were 25
built using a regression tree model on a subset of the data for which total Si concentration was 26
measured. To compare the relative performance of the models obtained for the two different 27
sources of data, a suite of performance indicators were calculated. Our results showed that 28
PTF based on MIR spectra produces highly accurate and precise estimates of the total Si 29
concentration for French soils. The pedological PTF is less accurate, but still provides a good 30
estimation of the Si concentration. The pedological PTF provides an alternative method when 31
only basic soil data are available, and an approximate estimation of Si concentrations is 32
sufficient. These PTFs can be readily applied at the European scale except on a few soil 33
groups not represented in France. 34
keywords
35
Silicon, silica, pedotransfer function, diffuse reflectance, FTIR, mid-infrared spectra, 36
regression tree, soil mointoring. 37
3
1- Introduction
39
Silicon (Si) is the second most abundant element of the Earth’s crust, after oxygen, with an 40
average mass concentration of 28% (Wedepohl, 1995). The SiO4 tetrahedron is the elemental
41
brick of soil minerals which constitutes the basic structure of Si in nature from solid (silicates) 42
to soluble (silicic acid) states. Through weathering of primary minerals, Si is released into soil 43
solution where it is either recombined with other elements to form secondary minerals, 44
adsorbed on oxides surfaces, absorbed by plants or exported to groundwater and rivers. 45
Indeed, despite being considered as a non-essential element, Si is encountered in most 46
terrestrial plants with concentrations highly variable, ranging from less than 0.2 to more than 47
10 % dry weight (Ma and Takahashi, 2002). Meanwhile, plant Si is a significant pool of the 48
global Si cycle as evidenced from the total annual biogenic Si retention in terrestrial plants, 49
which is estimated in the same order of magnitude as the Si fixed annually by diatoms in the 50
ocean (Carey and Fulweiler, 2012; Loucaides et al., 2010). The terrestrial Si cycle notably 51
depends on the type of vegetation (Alexandre et al., 1997; Bartoli, 1983; Blecker et al., 2006; 52
Cornelis et al., 2010) and is suggested to be perturbed by human activities through urban 53
activities, agriculture and deforestation (Conley et al., 2008; Struyf et al., 2010; Vandevenne 54
et al., 2012). However, the extent of this perturbation is not well documented. One approach 55
to address this question is a spatial analysis at the territory scale. Soil Si maps are rare to our 56
knowledge, with the notable exception of the Si map for European soils with one site every 57
2500 km² (De Vos et al., 2006; Reimann et al., 2014). Soil silica content is mostly measured 58
in rice-growing areas (Minasny et al., 2016), but rarely measured in non-paddy soil databases, 59
especially in most of the national soil monitoring networks of Europe (Arrouays et al., 2008; 60
Imrie et al., 2008; Morvan et al., 2008). The possible reasons are (1) the cost of the 61
measurement and (2) little attention paid to Si in soil and agriculture until now. 62
4
In the literature, several soil characteristics, generally hydraulic properties or bulk density, 63
(Baldwin et al., 2017; Van Looy et al., 2017; Wösten et al., 1999), among others), have been 64
estimated by predictive functions based on pedological characteristics (organic matter, 65
particle size distribution etc.). This is commonly known as pedotransfer function (PTFs). 66
Recently, infrared spectroscopy has been proposed as a rapid and cost-effective alternative of 67
conventional chemical analysis as one spectrum can be used to derive several soil parameters 68
(Bertrand et al., 2002; Janik et al., 1998; McCarty et al., 2002; Minasny et al., 2009; Soriano-69
Disla et al., 2014, 2013; Viscarra Rossel et al., 2006). In their review, Viscarra Rossel et al. 70
(2006) demonstrated mid infrared spectra (MIRS) produce better accuracy over near infrared 71
spectra (NIRS) for a large number of soils properties. However, that review did not show any 72
study that predicts Si from infrared spectra. Nevertheless, Janik et al. (1995) showed that soils 73
dominated by quartz, which is made up of SiO2, has a peak around 1700-2000 cm-1. Other
74
studies showed that MIRS presented good predictions of oxalate extractable Si, a specific 75
form of Si used to assess the degree of soil weathering (Bertrand et al., 2002; Minasny et al., 76
2009). These findings suggest that MIRS could be used for prediction of total Si as recently 77
demonstrated by Mohanty et al. (2016). 78
In this study, we developed and compared pedotransfer functions of total topsoil Si 79
concentrations based on either pedological data (particle size fraction, pH, organic carbon, 80
cation exchange capacity, calcium carbonate and parent material) or MIRS. These data were 81
derived from the French monitoring network of soil quality database, RMQS (Réseau de 82
Mesures de la Qualité des Sols (Arrouays et al., 2003; Jolivet et al., 2006). Pedotransfer 83
functions were built on the RMQS data subset on which total Si concentrations were 84
measured. Subsequently, the PTFs were applied to the whole RMQS dataset to predict topsoil 85
Si concentration for the whole of France. 86
5
2- Materials and methods
872.1- Soil samples
88 2.1.1- The RMQS database 89The RMQS monitoring network encompasses 2088 sites sampled following a 16 × 16 km² 90
regular grid across the French metropolitan territory (550 000km²). At each site, land-use, 91
climate, soil type and parent material were described. Twenty five individual cores were 92
sampled, from the topsoil (0-30 cm), using an unaligned sampling design within a 20 × 20 m 93
area (Jolivet et al., 2006). Core samples were then bulked. The resulting composite samples 94
were air-dried and sieved to 2 mm before analysis. Particle-size distribution, pH in water, 95
organic carbon (OC), cation exchange capacity (CEC), calcium carbonate (CaCO₃) were 96
analyzed according to international (ISO) or French (NF) standardized methods by the 97
accredited Soil Analysis Laboratory of INRA (Arras, France) (Table 1). This study is based 98
on the analytical results of the samples collected from 2002 to 2009 (first sampling campaign) 99
for the previous characteristics. 100
2.1.2- MIRS data
101
MIRS were also acquired on RMQS samples (Grinand et al., 2012). 0.5-g aliquots of < 0.2-102
mm ground sample were scanned from 4000 to 400 cm-1 (i.e., 2500-25,000 nm) at 4 cm-1
103
resolution using a Nicolet 6700 Diffusive Reflectance Fourier Transform Spectrophotometer 104
(Thermo Fisher Scientific Instruments, Madison, WI, USA). Then, 32 scans per sample were 105
acquired and averaged. Spectra were recorded as absorbance. 106
MIRS were pre-processed, before statistical modelling to reduce baseline variations, enhance 107
spectral features, reduce the particle-size scattering effect, remove linear or curvilinear trends 108
of each spectrum, or remove additive or multiplicative signal effects (Boysworth and Booksh, 109
6
2008). The pre-processing routine consisted of an 11 bands window smoothing Savitzky– 110
Golay filter (Savitzky and Golay, 1964) using the sgolayfilt function from the signal R 111
package (Ligges et al., 2015) followed by a standard normal variate (SNV, Barnes et al., 112
1989) transform. 113
2.1.3- Selection of samples for total Si analysis
114
To develop the pedotransfer functions, a subset of 673 samples from the 2088 RMQS 115
samples, called hereafter the Si dataset, were analyzed for total Si concentration. The subset 116
sites were selected using the following criteria: (1) one site out of four from the original grid 117
excluding Corsica, and (2) 160 sites randomly selected from the remaining sites (Figure 1). 118
This sub-sampling of the grid preserves the systematic grid sampling. This gridsampling 119
method was established by (Brus and Saby, 2016) as a flexible design for statistical soil 120
surveys leading to relatively accurate estimates of the statistical distribution of spatial 121
parameters. Total Si concentration was measured on air-dried, less than 2 mm samples by 122
inductively coupled plasma atomic emission spectrometry (ICP-AES) after sodium peroxide 123
fusion of the samples. 124
2.2- Total Si modelling and predictions
1252.2.1- Pedotransfer functions (PTFs)
126
Pedotransfer functions predicting total Si content was established using two different types of 127
soil variables as inputs: 128
(1) basic pedological attributes including particle size fraction, pH, organic carbon, cation 129
exchange capacity, calcium carbonate and parent material, or 130
(2) pre-processed MIRS data, 131
7
These PTFs are termed as pedological PTF and MIRS PTF hereafter. The variables of the 132
pedological PTF were chosen from the most common soil analytical variables in soil 133
databases. For that reason, parent material was also included, while soil type was not as it had 134
only a limited influence in the model (data not shown). 135
2.2.2- Statistical modelling approach
136
Regression procedure: Quantitative prediction of total Si concentrations by the soil
137
properties and the MIRS were obtained using Cubist, a type of regression tree model 138
(Quinlan, 1992). The Cubist model is a form of regression rules that build regression trees 139
with final nodes containing linear models instead of discrete values. Cubist creates 140
interpretable rules that describe the relationships between predictive variables (in this case 141
spectral bands or soil properties) and the variable of interest (Si). Minasny et al. (2009) and 142
Minasny and McBratney (2008) demonstrated that this approach could provide higher 143
accuracy than the partial-least-squares (PLS) approach, commonly used in chemometrics. 144
Moreover, this type of approach is flexible as it can handle both quantitative and qualitative 145
variables as well as spectral data, which allows having a unique approach for both PTFs, and 146
thus their results can be fairly compared. 147
To optimize the Cubist model, two parameters can be adjusted: the number of model trees as 148
ensembles (committees) and the number of nearest–neighbors to adjust the prediction of the 149
rules (neighbors). To optimize the model parameters, we used the train function in the caret 150
R package. The tuning parameter 'neighbors' was held constant at a value of zero to avoid 151
shortcomings in the interpretability of the rules by local averaging. The optimal numbers of 152
‘committees’ was found to be 5 for the two PTFs. 153
Calibration and evaluation steps: The modelling approach is summarized in Figure 2. we
154
used a leave p out cross-validation approach combined with a bootstrap step (James et al., 155
2013). The p cross-validation leaves out a p proportion of samples for validation. We used a 156
8
75%-25% split for calibration and validation respectively, and this procedure was repeated 10 157
times. Cross-validation allows a more robust assessment of the quality of the prediction. The 158
subdivision was performed using the conditioned Latin Hypercube Sampling (cLHS) method 159
(Minasny and McBratney, 2006). This method is a stratified random procedure that provides 160
an efficient way of sampling variables from their multivariate distributions. The bootstrap step 161
involved simulating 100 datasets by random sampling with replacement from 95% of the 162
calibration dataset (formed at the cross-validation step). This whole procedure generated 100 163
Cubist models in the calibration procedure. These outcomes were used to build the 164
distribution of the prediction. The mean prediction could be obtained from the average of the 165
100 bootstrapped models. 166
Software: Our modelling approach involves a large number of model calibrations and parallel
167
processing was used to handle the computational load. Parallel processing was implemented 168
in R using the packages foreach (Calaway et al., 2017b) and doParrallel (Calaway et al., 169
2017a). All data analyses were performed using the R statistical environment (R core Team, 170
2017) for descriptive statistics, spectrum pre-processing and model building. We used the 171
Cubist implementation from the Cubist package (Kuhn et al., 2016), the cLHS function 172
implemented in clhs package (Roudier, 2011). 173
2.3- Assessments and interpretations
1742.3.1- Representativeness assessment
175
Before evaluating the prediction ability of the two PTFs, we first checked that the Si dataset 176
used to develop the PTFs was representative of the whole RMQS dataset. Graphical and 177
numerical comparison of the statistical distribution of the basic pedological data, and the MIR 178
spectra were performed. The Wilcoxon test for the quantitative soil attributes was also 179
performed to compare the two datasets (the Si dataset and the RMQS database). In addition, 180
9
principal component analyses (PCA) was performed on the pedological attribute as well as the 181
MIRS variables. Using the PCA, samples with or without Si measurements can be readily 182
compared. The PCA allows comparison of the multivariate variables, while the distribution 183
analyses only consider one soil variable at a time. 184
185
2.3.2- Accuracy assessment
186
To compare the relative performance of the models obtained for the two PTFs, three 187
conventional performance indicators were calculated: the coefficient of determination (R²), 188
the root mean square error (RMSE, also known as standard error of prediction, SEP) and the 189
bias, which is the mean residual of the model. In addition, we took into account the 190
probability distribution of model predictions using the continuous rank probability score 191
average (CRPS, equation 6). The CRPS represents the closeness between the prediction 192
distribution and the corresponding observations (Gneiting et al., 2007). This score is 193
commonly used in meteorological forecasts as a verification tool for (probabilistic) forecast 194
systems (Hersbach, 2000; Trinh et al., 2013). The metric is calculated using: 195 𝐶𝑅𝑃𝑆 = 100 𝐵𝑆 𝑦 𝑑𝑦 , (6) 196 𝐵𝑆(𝑦) = 54 5 { 𝐹8 𝑦 − 𝟙 𝑥8 ≤ 𝑦 = 8>4 , (7) 197
where 𝐵𝑆(𝑦) denotes the Brier score (Brier, 1950) for probability forecasts of the binary 198
event at the threshold value 𝑦 ∈ ℝ , 𝑥 is the observation and 𝑦 is the model prediction, 𝑛 the 199
number of samples, 𝐹 is the cumulative distribution function (CDF) of X, a random variable, 200
such as 𝐹 𝑦 = 𝑃 𝑋 ≤ 𝑦 and 𝟙 is the Heaviside step function. This function is a 201
discontinuous function where the value is zero for negative argument and unity for positive 202
argument. 203
The CRPS is a distance criterion, which is a positive value and should be close to 0. The 204
prediction is expressed in terms of a probability distribution rather than a single value. The 205
10
CRPS compares the cumulative probability distribution of the predicted value to the observed 206
value. In our case, we only took into account the uncertainty of the prediction and assumed 207
the uncertainty of the observation is small. The probability distribution of our observation is 208
set to equal to 1 for the observed value and null elsewhere. As a distance, the CRPS can be 209
linked to the mean absolute error used in the deterministic prediction. It uses the information 210
provided by the probabilistic prediction instead of just using the mean of the median value. 211
We used the crps function implemented in the verification package (Laboratory NCAR-212 Research Applications, 2015). 213 214 2.3.3- The importance of the predictors in the model 215
In order to interpret the PTFs results, we extracted and computed the variable of importance 216
from the Cubist rulesets. The variable of importance is computed as the percentage of times 217
each variable was used in a rule condition and/or a linear model. Following our calibration 218
and validation step, we calculated the average importance of predictors over the 100 Cubist 219
models produced by bootstrap and then over the 10 iterations of the cross-validation step for 220
each PTF. Because it is an average value, the sum of the variables of importance do not sum 221
up to 100. 222
11
3- Results & Discussion
2233.1- Representativeness of the Si dataset compared to the whole RMQS
224dataset
225Measured Si concentrations range from 22.81 to 455.8 g kg⁻¹ over the Si dataset with a 226
median equal to 327.2 g kg-1 (Figure 3). Soils with low total Si concentrations (under 227
124 g kg⁻¹, the statistical threshold for outliers in this dataset) were poorly represented (17 228
over 674; Figure 3). The corresponding samples originated from soils developed in 229
sedimentary parent materials, mostly calcareous with a carbonate concentration of greater or 230
equal to 395 g kg⁻¹. 231
The parent material distribution of both the Si dataset (n=673) and the RMQS set (n= 2088) 232
are very similar (Figure 4). For the pedological attributes, the empirical density estimates of 233
soil properties were well represented, both in the Si dataset and the RMQS (Figure 5). The 234
summary statistics of the pedological attributes were reported in Table 2. The empirical 235
density functions for both datasets overlapped. This is supported by the Wilcoxon test which 236
showed no significant difference in the distribution for the considered attributes (p-values 237
recorded in Table 2). Considering the whole dataset, the PCAs showed a good overlap 238
between the RMQS sites with and without Si measurement (Figure 6). Therefore, we can 239
consider the Si dataset to be representative of the whole RMQS. 240
241
3.2- Total Si prediction by the PTFs
242The validation of the MIRS PTF estimating Si content was excellent with an R² of 0.96. 243
Estimates from this PTF were unbiased, and their average RMSE is 15.31 g kg-1 (Table 3). 244
The average CRPS was very close to the RMSE value. The validation of the pedological PTF 245
12
was also very good with an R² of 0.87. Estimates from the pedological PTF were slightly 246
biased, with an average RMSE of 26.48 g kg-1. Finally, the average CRPS were larger 247
indicating higher prediction uncertainty. The results of leave p out cross-validation were also 248
used to compute indicators of the variability of the performance indicators (Table 3). The 249
standard deviation of these indicators for the MIRS PTF was small. 250
To better figure out the difference between the accuracy of the two PTFs, we plotted the 251
predicted versus measured Si concentrations for one iteration of the cross-validation steps 252
(Figure 7). For the MIRS PTF, the prediction and analytical uncertainties of the data are of the 253
same order of magnitude (Figure 7a) as suggested by the RMSE values. This means that this 254
PTF gives good predictions, and close to analytical measurements. In contrast, the pedological 255
PTF presents a larger prediction uncertainty than the MIRS PTF, and it also has larger 256
uncertainty compared to the analytical uncertainty (Figure 7b) as shown by RMSE results. In 257
addition, total Si concentration tends to be over-estimated by the pedological PTF at low 258
concentrations (≤ 270 g kg⁻¹) and under-estimated at high concentrations (≥ 370 g kg⁻¹). This 259
is further confirmed by the coefficients of the linear regression between observed and 260
predicted values of the pedological PTF, with 67.18 for the intercept and 0.80 for the slope. In 261
comparison, the MIRS PTF has an intercept of 22 g kg⁻¹ and slope of 0.07. The bias maybe 262
due to the low representation in the dataset of samples having Si concentration lower than 263
12.5 %, as discussed earlier. The bias can also come from sites which were over predicted 264
where the Si concentrations are between 200 and 300 g kg⁻¹. 265
All in all, the MIRS PTF tends to show an accuracy as good as the chemical analysis when 266
considering both the prediction and analytical uncertainties. However, as predictions were 267
made on the basis of analytical measurements, the prediction uncertainty does not only come 268
from the model accuracy but also from the uncertainty of analytical measurements (Janik et 269
al., 1998). In our case, the analytical uncertainty was not taken into account in the prediction 270
13
uncertainty calculation, as they were not always available. Despite this, the obtained PTFs 271
show an exceptional accuracy that is rarely obtained in the PTFs literature (Minasny et al., 272
2009; Viscarra Rossel et al., 2006). Viscarra Rossel et al. (2006) reported the accuracy of 273
MIRS PTFs for different soil properties from the literature have R² values ranging from 0.07 274
to 0.98, where one third of the cases an R² value larger or equal to 0.90 was obtained. 275
Minasny et al. (2009) built MIRS PTFs for predicting soil properties on three different 276
databases and reported R² values from 0.0 for total S to 0.92 for CEC and OC. They 277
concluded that basic soil organic and mineral constituents, as well as properties that are 278
related to the mineral and organic components could be well predicted. This study confirms 279
the hypothesis. PTFs based on pedological properties are generally used to predict 280
hydrological properties that are difficult to measure (e.g., Baldwin et al., 2017; Wösten et al., 281
1999, among others) but seldom developed to predict chemical characteristics. 282
3.3- The Pedological significance of the calibrated PTFs
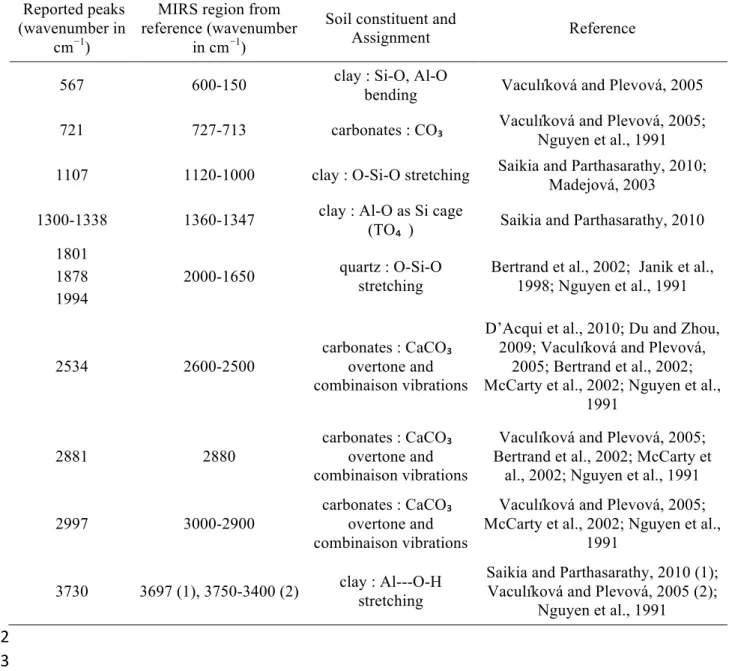
283Regarding pedological significance, the MIRS PTF uses mostly combination-overtones bands 284
of quartz ranging from 1800 to 2000 cm-1 (Table 4), to predict total Si concentration, which is 285
expected, as quartz is a mineral composed of Si and oxygen (O) atoms (SiO2)(Figure 8a).
286
This region of the spectrum presents the peak with the most important weight (>80%) around 287
2000 cm-1 followed by two other peaks around 1800 and 1900 cm-1 (> 40%, Figure 8b, Table 288
4). The carbonate concentration also has a role in the MIRS PTF, with carbonates bands 289
ranging from 2400 to 3100 cm-1, which correspond to CaCO3 bonds (Table 4). It exhibits
290
three peaks of average weight > 20%, one around 2500 and two around 3000 cm-1 (Figure 8b).
291
As shown in Figure 8a, samples with low Si concentration contain carbonates while samples 292
with high Si concentration do not. This link is due to the absence of Si in carbonates (Table 293
4). Bands related to Si-O bond ranging from 1400 to 400 cm-1 also presents a noticeable 294
weight in the PTF (Figure 8b). 295
14
For the pedological PTF, the two most important predictors are the organic carbon and the 296
carbonate concentrations, with an average weight of 78.6% and 73.6% respectively. 297
Carbonates as discussed for the MIRS PTF act as a diluent for Si, which is also the case of 298
organic carbon. No significant organic carbon contribution was observed in the MIRS PTF 299
probably because, in MIRS, "organic carbon cannot be identified with clearly separated peaks 300
but as a whole spectral region with overlapping bands", as stated by Grinand et al. (2012). In 301
the pedological PTF, an important influence of the sand fraction could be expected as a 302
positive correlation between total Si and both fine and coarse sand is observed (Kendall’s 303
correlation coefficient: tau = 0.17 and p-value = 3.585 10-11; tau = 0.11 and p-value = 3.108
304
10-5, respectively). Indeed, these two variables have an average weight of 37% in the 305
pedological PTF (Figure 9). In addition, the clay fraction also has an important weight in the 306
pedological PTF (60%) with a negative correlation between the total Si concentration and the 307
clay fraction (Kendall’s correlation coefficient: tau = - 0.46 and p-value < 2.2e-16). 308
As a conclusion, the two PTFs were mainly underlined by the same processes: dilution of the 309
Si concentration by carbonates, organic carbon and possibly the clay fraction to a lesser extent 310
and concentration due to the presence of quartz mainly in the sand fractions. 311
3.4- Domain of potential application of the developed PTFs
312We compared pedological PTF predictions of total Si concentration for the non-Si analysed 313
RMQS sites to that predicted by the MIRS PTF (Figure 10). The relative difference of 314
predictions between the two PTFs is small, 90% of the time, the difference between the 2 315
PTFS is less than 20%. This result highlights the consistency of the two PTFs and confirms 316
that despite less accurate, the pedological PTF gives a reasonable estimation of the soil Si 317
concentration for the whole dataset. The soil observations of this study came from a 318
systematic probability sampling which leads to good spatial coverage, i.e. the sites are 319
uniformly spread over France. This design proves to be efficient in providing accurate 320
15
estimates of means over the whole area and can be used to generalize the results for the whole 321
area of France (Brus and Saby, 2016). 322
We further investigated if the domain of application of our PTFs at the European scale by 323
comparing the Si concentrations statistical distribution of the Si measurements analytically 324
measured from the RMQS to that of the Geochemical Mapping of Agricultural Soils 325
(GEMAS) dataset (De Vos et al., 2006; Reimann et al., 2014). The GEMAS study provided a 326
few soil Si data over the French territory with one site every 2500 km², i.e. 214 sites for 327
France. Comparing those two distributions for France showed 1) a slight over-estimation of 328
the occurrence of soils with concentrations around 300 g kg⁻¹ ; 2) an under-estimation of soils 329
with concentrations around 400 g kg⁻¹ ; 3) a slight smaller median of the French soil Si 330
concentrations (320.7 g kg⁻¹). Nevertheless, the Mann and Whitney test shows no significant 331
difference between the two datasets (p-value = 0.5757). For the European territory, the 332
comparison is shown in Figure 11. The two datasets cover the same range of Si concentration 333
with an over-representation of the soils with Si concentration ranging from 350 to 400 g kg-1 334
in French compare to other European soils, resulting in contrasted median Si-concentrations 335
of 327.2 g kg-1 and 313.9 g kg⁻¹ respectively. When looking at the Si average, the Mann and 336
Whitney test also shows a small significant difference between the two datasets (0.05 > p-337
value = 0.02273 > 0.01). This result was expected since France is one of the countries 338
exhibiting the largest soil diversity in the world (Minasny et al., 2010). Thus, the established 339
PTFs can be applied at the Europeans scale to predict total soil Si concentrations at a higher 340
spatial density than that provided by the GEMAS study with the exception of some soil types 341
that are not represented in France, such as Chernozems, Kasternozem, Solonetz. 342
Finally, to better define the application range of our PTFs outside of Europe, future users can 343
determine the appropriate domain of application of a specific PTF to a new dataset using 344
distance metrics, such as the one presented by Tranter et al. (2009). 345
16
4- Conclusions
346
We developed PTFs based on either MIRS or pedological data to estimate the topsoil total Si 347
concentration. Both PTFs provide accurate estimations of the total Si concentration for French 348
soils. These PTFs are underlined by the link between Si and quartz, organic matter, and 349
carbonate contents. The PTF based on MIRS data produces a highly accurate and precise 350
estimates. Since the acquisition of MIRS data allows the estimation of a range of soil 351
properties, such as particle size fraction, major elements orchemical properties that are 352
related to surface solid characteristics like CEC, the use of MIRS PTF represents a powerful 353
tool for populating soil databases. The pedological PTF is less accurate, but still provides a 354
reasonable estimation of the Si concentration for French soils. It is an alternative method 355
when only pedological data are available and an approximate estimation of Si concentrations 356
is sufficient. This PTF can be applied to databases of legacy soil data to provide an initial 357
estimate of Si distribution. 358
Both PTFs can be readily applied at the European scale with the possible exclusion of a few 359
soil groups not represented in France. For these soil types, this study provides a pathway for 360
the development of new calibration PTFs procedure to local data. 361
This modelling approach yields very robust results with an adaptable method. Overall, this 362
work provides the first approach to estimate nation-wide topsoil total Si concentration and 363
opens the way for further works on Si in soils. 364
17
5- Acknowledgements
365
This work was performed in the frame of the French ANR BioSiSol project (ANR-14-CE01-366
0002). RMQS soil sampling and physico-chemical analyses were supported by the GIS Sol, 367
which is a scientific group of interest on soils involving the French Ministry for ecology and 368
sustainable development and Ministry of agriculture, the French National forest inventory 369
(IFN), ADEME (Agence de l'environnement et de la maîtrise de l'énergie, which is a French 370
government agency concerned with environmental protection and energy management), IRD 371
(Institut de recherche pour le développement, which is a French public research organization 372
dedicated to southern countries) and INRA (Institut national de la recherche agronomique, 373
which is a French public research organization dedicated to agriculture s.l.). Claudy Jolivet is 374
thanked for his strong involvement in the RMQS monitoring network. Manon Villeneuve, 375
Emmanuel Bourdon, Didier Brunet, Jérôme Lourd, and Clément Robin (IRD) are thanked for 376
their skillful technical assistance and strong investment in the tedious scanning process of the 377
RMQS soil library. 378
18
6- References
380
Alexandre, A., Meunier, J.-D., Colin, F., Koud, J.-M., 1997. Plant impact on the 381
biogeochemical cycle of silicon and related weathering processes. Geochim. 382
Cosmochim. Acta 61, 677–682. https://doi.org/10.1016/S0016-7037(97)00001-X 383
Arrouays, D., Jolivet, C., Boulonne, L., Bodineau, G., Ratié, C., Saby, N., Grolleau, E., 2003. 384
Le réseau de mesures de la qualité des sols (RMQS) de France. Etude Gest. Sols 10, 385
241. 386
Arrouays, D., Morvan, X., Saby, N., Richer de Forges, A., Le Bas, C., Bellamy, P.H., Üveges, 387
B., Freudenschu\s s, A., Jones, A.R., Jones, R.J.A., others, 2008. Environmental 388
Assessment of Soil for Monitoring. Volume IIa: Inventory & Monitoring. European 389
Communities. 390
Baldwin, D., Manfreda, S., Keller, K., Smithwick, E.A.H., 2017. Predicting root zone soil 391
moisture with soil properties and satellite near-surface moisture data across the 392
conterminous United States. J. Hydrol. 546, 393–404. 393
https://doi.org/10.1016/j.jhydrol.2017.01.020 394
Barnes, R.J., Dhanoa, M.S., Lister, S.J., 1989. Standard Normal Variate Transformation and 395
De-Trending of Near-Infrared Diffuse Reflectance Spectra. Appl. Spectrosc. 43, 772– 396
777. https://doi.org/10.1366/0003702894202201 397
Bartoli, F., 1983. The biogeochemical cycle of silicon in two temperate forest ecosystems. 398
Ecol. Bull. 469–476. 399
Bertrand, I., Janik, L.J., Holloway, R.E., Armstrong, R.D., McLaughlin, M.J., 2002. The rapid 400
assessment of concentrations and solid phase associations of macro-and micronutrients 401
in alkaline soils by mid-infrared diffuse reflectance spectroscopy. Soil Res. 40, 1339– 402
1356. 403
Blecker, S.W., McCulley, R.L., Chadwick, O.A., Kelly, E.F., 2006. Biologic cycling of silica 404
across a grassland bioclimosequence: GRASSLAND SILICA CYCLING. Glob. 405
Biogeochem. Cycles 20, n/a-n/a. https://doi.org/10.1029/2006GB002690 406
Boysworth, M.K., Booksh, K.S., 2008. Aspects of Multivariate Calibration Applied to Near-407
Infrared Spectroscopy, in: Handbook of Near-Infrared Analysis, Third Edition, 408
PRACTICAL SPECTROSCOPY SERIES. pp. 207–229. 409
Brier, G.W., 1950. Verification of forecasts expressed in terms of probability. Mon. Weather 410
Rev. 78, 1–3. 411
Brus, D.J., Saby, N.P.A., 2016. Approximating the variance of estimated means for 412
systematic random sampling, illustrated with data of the French Soil Monitoring 413
Network. Geoderma 279, 77–86. 414
Calaway, R., Corporation, M., Weston, S., Tenenbaum, D., 2017a. doParallel: Foreach 415
Parallel Adaptor for the “parallel” Package. 416
Calaway, R., Microsoft Corporation, Weston, S., 2017b. foreach: Provides Foreach Looping 417
Construct for R. 418
Carey, J.C., Fulweiler, R.W., 2012. The terrestrial silica pump. PLoS One 7, e52932. 419
Conley, D.J., Likens, G.E., Buso, D.C., Saccone, L., Bailey, S.W., Johnson, C.E., 2008. 420
Deforestation causes increased dissolved silicate losses in the Hubbard Brook 421
Experimental Forest. Glob. Change Biol. 14, 2548–2554. 422
Cornelis, J.-T., Ranger, J., Iserentant, A., Delvaux, B., 2010. Tree species impact the 423
terrestrial cycle of silicon through various uptakes. Biogeochemistry 97, 231–245. 424
De Vos, W., Tarvainen, T., Salminen, R., Reeder, S., De Vivo, B., Demetriades, A., Pirc, S., 425
Batista, M.J., Marsina, K., Ottesen, R.T., others, 2006. Geochemical Atlas of Europe: 426
19
Part 2: Interpretation of geochemical maps, additional tables, figures, maps, and 427
related publications. Geological Survey of Finland. 428
Gneiting, T., Balabdaoui, F., Raftery, A.E., 2007. Probabilistic forecasts, calibration and 429
sharpness. J. R. Stat. Soc. Ser. B Stat. Methodol. 69, 243–268. 430
Grinand, C., Barthès, B.G., Brunet, D., Kouakoua, E., Arrouays, D., Jolivet, C., Caria, G., 431
Bernoux, M., 2012. Prediction of soil organic and inorganic carbon contents at a 432
national scale (France) using mid-infrared reflectance spectroscopy (MIRS). Eur. J. 433
Soil Sci. 63, 141–151. https://doi.org/10.1111/j.1365-2389.2012.01429.x 434
Hersbach, H., 2000. Decomposition of the Continuous Ranked Probability Score for 435
Ensemble Prediction Systems. Weather Forecast. 15, 559–570. 436
https://doi.org/10.1175/1520-0434(2000)015<0559:DOTCRP>2.0.CO;2 437
Imrie, C.E., Korre, A., Munoz-Melendez, G., Thornton, I., Durucan, S., 2008. Application of 438
factorial kriging analysis to the FOREGS European topsoil geochemistry database. 439
Sci. Total Environ. 393, 96–110. https://doi.org/10.1016/j.scitotenv.2007.12.012 440
James, G., Witten, D., Hastie, T., Tibshirani, R., 2013. An Introduction to Statistical 441
Learning: with Applications in R. Springer Science & Business Media. 442
Janik, L., Skjemstand, J., Raven, M., 1995. Characterization and Analysis of Soils Using 443
Midinfrared Partial Least-Squares .1. Correlations with Xrf-Determined Major-444
Element Composition. Aust. J. Soil Res. 33, 621–636. 445
https://doi.org/10.1071/SR9950621 446
Janik, L.J., Skjemstad, J.O., Merry, R.H., 1998. Can mid infrared diffuse reflectance analysis 447
replace soil extractions? Aust. J. Exp. Agric. 38, 681. 448
https://doi.org/10.1071/EA97144 449
Jolivet, C., Arrouays, D., Boulonne, L., Ratié, C., Saby, N., 2006. Le réseau de mesures de la 450
qualité des sols de France (RMQS). Etat D’avancement Prem. Résultats Etude Gest. 451
Sols 13, 149–164. 452
Kuhn, M., Weston, S., Keefer, C., Coulter, N., 2016. Cubist: Rule- And Instance-Based 453
Regression Modeling ; R package version 0.0.19. C code for Cubist by Ross Quinlan. 454
Laboratory NCAR-Research Applications, 2015. verification: Weather Forecast Verification 455
Utilities. 456
Ligges, U., Short, T., Kienzle, P., Schnackenberg, S., Billinghurst, D., Borchers, H.-W., 457
Carezia, A., Dupuis, P., Eaton, J.W., Farhi, E., Habel, K., Hornik, K., Krey, S., Lash, 458
B., Leisch, F., Mersmann, O., Neis, P., Ruohio, J., III, J.O.S., Stewart, D., Weingessel, 459
A., 2015. signal: Signal Processing. 460
Loucaides, S., Behrends, T., Van Cappellen, P., 2010. Reactivity of biogenic silica: Surface 461
versus bulk charge density. Geochim. Cosmochim. Acta 74, 517–530. 462
Ma, J.F., Takahashi, E., 2002. Soil, fertilizer, and plant silicon research in Japan. Elsevier, 463
Amsterdam. 464
McCarty, G.W., Reeves, J.B., Reeves, V.B., Follett, R.F., Kimble, J.M., 2002. Mid-infrared 465
and near-infrared diffuse reflectance spectroscopy for soil carbon measurement. Soil 466
Sci. Soc. Am. J. 66, 640–646. 467
Minasny, B., Hong, S.Y., Hartemink, A.E., Kim, Y.H., Kang, S.S., 2016. Soil pH increase 468
under paddy in South Korea between 2000 and 2012. Agric. Ecosyst. Environ. 221, 469
205–213. https://doi.org/10.1016/j.agee.2016.01.042 470
Minasny, B., McBratney, A.B., 2008. Regression rules as a tool for predicting soil properties 471
from infrared reflectance spectroscopy. Chemom. Intell. Lab. Syst. 94, 72–79. 472
Minasny, B., McBratney, A.B., 2006. A conditioned Latin hypercube method for sampling in 473
the presence of ancillary information. Comput. Geosci. 32, 1378–1388. 474
https://doi.org/10.1016/j.cageo.2005.12.009 475
20
Minasny, B., Tranter, G., McBratney, A.B., Brough, D.M., Murphy, B.W., 2009. Regional 476
transferability of mid-infrared diffuse reflectance spectroscopic prediction for soil 477
chemical properties. Geoderma 153, 155–162. 478
https://doi.org/10.1016/j.geoderma.2009.07.021 479
Mohanty, B., Gupta, A., Das, B.S., 2016. Estimation of weathering indices using spectral 480
reflectance over visible to mid-infrared region. Geoderma 266, 111–119. 481
https://doi.org/10.1016/j.geoderma.2015.11.030 482
Monger, H.C., Kelly, E., 2002. Silica minerals, in: Soil Mineralogy with Environmental 483
Applications., Soil Science Society of America Book Series. Soil Science Society of 484
America Inc., Madison, Wisconsin, USA, pp. 611–636. 485
Morvan, X., Saby, N.P.A., Arrouays, D., Le Bas, C., Jones, R.J.A., Verheijen, F.G.A., 486
Bellamy, P.H., Stephens, M., Kibblewhite, M.G., 2008. Soil monitoring in Europe: A 487
review of existing systems and requirements for harmonisation. Sci. Total Environ. 488
391, 1–12. https://doi.org/10.1016/j.scitotenv.2007.10.046 489
Nguyen, T.T., Janik, L.J., Raupach, M., 1991. Diffuse reflectance infrared fourier transform 490
(DRIFT) spectroscopy in soil studies. Soil Res. 29, 49–67. 491
https://doi.org/10.1071/sr9910049 492
Quinlan, J.R., 1992. Learning with continuous classes, in: 5th Australian Joint Conference on 493
Artificial Intelligence. Singapore, pp. 343–348. 494
R core Team, 2017. R: A Language and Environment for Statistical Computing. R Foundation 495
for Statistical Computing, Vienna, Austria. 496
Reimann, C., Birke, M., Demetriades, A., Filzmoser, P., O’Connor, P., 2014. Chemistry of 497
Europe’s agricultural soils, part A. 498
Roudier, P., 2011. clhs: a R package for conditioned Latin hypercube sampling. 499
Savitzky, A., Golay, M.J., 1964. Smoothing and differentiation of data by simplified least 500
squares procedures. Anal. Chem. 36, 1627–1639. 501
Soriano-Disla, J.M., Janik, L., McLaughlin, M.J., Forrester, S., Kirby, J., Reimann, C., 2013. 502
The use of diffuse reflectance mid-infrared spectroscopy for the prediction of the 503
concentration of chemical elements estimated by X-ray fluorescence in agricultural 504
and grazing European soils. Appl. Geochem. 29, 135–143. 505
https://doi.org/10.1016/j.apgeochem.2012.11.005 506
Soriano-Disla, J.M., Janik, L.J., Viscarra Rossel, R.A., Macdonald, L.M., McLaughlin, M.J., 507
2014. The Performance of Visible, Near-, and Mid-Infrared Reflectance Spectroscopy 508
for Prediction of Soil Physical, Chemical, and Biological Properties. Appl. Spectrosc. 509
Rev. 49, 139–186. https://doi.org/10.1080/05704928.2013.811081 510
Struyf, E., Smis, A., Van Damme, S., Garnier, J., Govers, G., Van Wesemael, B., Conley, 511
D.J., Batelaan, O., Frot, E., Clymans, W., 2010. Historical land use change has 512
lowered terrestrial silica mobilization. Nat. Commun. 1, 129. 513
Trinh, B.N., Thielen-del Pozo, J., Thirel, G., 2013. The reduction continuous rank probability 514
score for evaluating discharge forecasts from hydrological ensemble prediction 515
systems: Reduction continuous rank probability score for HEPS. Atmospheric Sci. 516
Lett. 14, 61–65. https://doi.org/10.1002/asl2.417 517
Vaculikova, L., Plevova, E., 2005. Identification of clay minerals and micas in sedimentary 518
rocks. Acta Geodyn. Geomater. 2, 163. 519
Van Looy, K., Bouma, J., Herbst, M., Koestel, J., Minasny, B., Mishra, U., Montzka, C., 520
Nemes, A., Pachepsky, Y.A., Padarian, J., Schaap, M.G., Tóth, B., Verhoef, A., 521
Vanderborght, J., van der Ploeg, M.J., Weihermüller, L., Zacharias, S., Zhang, Y., 522
Vereecken, H., 2017. Pedotransfer Functions in Earth System Science: Challenges and 523
Perspectives. Rev. Geophys. 2017RG000581. https://doi.org/10.1002/2017RG000581 524
21
Vandevenne, F., Struyf, E., Clymans, W., Meire, P., 2012. Agricultural silica harvest: have 525
humans created a new loop in the global silica cycle? Front. Ecol. Environ. 10, 243– 526
248. 527
Viscarra Rossel, R.A., Walvoort, D.J.J., McBratney, A.B., Janik, L.J., Skjemstad, J.O., 2006. 528
Visible, near infrared, mid infrared or combined diffuse reflectance spectroscopy for 529
simultaneous assessment of various soil properties. Geoderma 131, 59–75. 530
https://doi.org/10.1016/j.geoderma.2005.03.007 531
Wedepohl, K.H., 1995. The composition of the continental crust. Geochim. Cosmochim. Acta 532
59, 1217–1232. 533
Wösten, J.H.M., Lilly, A., Nemes, A., Le Bas, C., 1999. Development and use of a database 534
of hydraulic properties of European soils. Geoderma 90, 169–185. 535
https://doi.org/10.1016/S0016-7061(98)00132-3 536
22
7- List of figures and tables:
538 Figures: 539- Figure 1: Location of the sampling sites of the French monitoring network of soil 540
quality (RMQS). Black triangles represent the sites for which Si measurements were 541
available. 542
- Figure 2: Schematic diagram of the modelling procedure. 543
- Figure 3: Distribution of the Si concentrations in the Si dataset: a- histogram; b- 544
boxplot. The dashed grey line represents the Si overall mean . 545
- Figure 4: Percentage of samples in different parent material classes for both the 546
French monitoring network of soil quality (RMQS) database and the Si dataset. 547
- Figure 5: Comparison of the empirical density estimates of the pedological properties 548
computed for all the sites (2088) of the French soil monitoring network (RMQS) and 549
those of the Si dataset (673 sample). 550
- Figure 6: Principal component analysis of the whole dataset (2088 sampling sites) for 551
two set of variables: Mid-infrared spectra (MIRS) (a and c) and pedological attributes 552
(b and d). Bivariate plot of the scores of PCs 1 and 2 (a and b). Most correlated MIRS 553
band are plotted in a. Score plot of first two components (c and d) (black points 554
correspond to the extrapolated dataset from the French soil monitoring network 555
(RMQS) and grey points to the Si dataset). 556
- Figure 7: Predicted versus measured Si concentrations (in g kg-1) for the first cross
557
validation replication of (a) the mid-infrared spectra (MIRS) and (b) the pedological 558
pedotransfer Functions (PTFs). In black, the one to one line and in red, the fitted 559
regression line. Black vertical error bars represent the prediction’s uncertainty and 560
blue horizontal error bars represent the analytical uncertainty. 561
23
- Figure 8: (a) Mid-infrared reflectance spectra (MIRS) of two sites randomly selected 562
among those with low Si concentrations (in grey) and high Si concentration (in black) 563
respectively; (b) average importance based on cubist models of spectral region for the 564
prediction of total Si concentration. Most important wavelengths (vertical lines) are 565 identified in Table 4. 566 - Figure 9: Average importance based on cubist model of the variables used for the 567 prediction of total Si concentration by pedological attributes. 568
- Figure 10: Scatterplot of the total Si concentration (in g kg-1) predicted by the
569
pedological PedoTransfer Function (PTF) versus those predicted by the mid-infrared 570
spectra PTF. The samples correspond to the non-Si analysed sites of the French 571
monitoring network of soil quality (RMQS) (1407 sites). 572
- Figure 11: Empirical density estimate of Si concentrations obtained for the sites of the 573
French monitoring network of soil quality (RMQS) (this study) to those obtained for 574
French and European sites in GEMAS (Reimann et al., 2014). Vertical lines represent 575
the median values: 327.2 g kg-¹, 320.7 g kg-¹ and 313.9 g kg-¹ respectively. 576
24
Tables: 578
- Table 1 : Analytical methods employed for the selected soil properties 579
- Table 2: Summary statistics of pedological attributes for the two datasets: the RMQS 580
and Si dataset. 581
- Table 3: Summary statistics of performance indicators of the cross-validation for the 582
two PTF models. RMSE, bias and CRPS are in g kg⁻¹.
583
- Table 4: Important wavelengths in MIRS along with reported peaks and their 584
assignments. 585
25 587 Figure 1 588 589
26 590 Figure 2 591 592
27 593 Figure 3 594 595
28 596 Figure 4 597 598
29 599 Figure 5 600 601 Figure 6 602 603 604 Fugure 7 605 606
30 607 Figure 8 608 609 Figure 9 610 611
31 612 Figure 10 613 614 Figure 11 615 616
32
Table 4 : Analytical methods employed for the selected soil properties 617
618
Soil properties Method Source
Clay, fine silt, coarse silt, fine
sand, coarse sand Robinson’s pipette after water sieving (NF X 31-107) RMQS
CEC Cobalthexammine extraction (NF X 31-130) RMQS
pH Water (ISO 10390) RMQS
Organic carbon Dry combustion (NF ISO 10694) RMQS
Carbonates Volumetric method (NF X 31-106) RMQS
Total Si ICP-AES after sodium peroxide fusion This study
MIR Sectra Diffusive Reflectance Fourier Transform
Spectrophotometer from 4000 to 400 cm-1 (Grinand et al., 2012)
619 620
33 621 622 623 624
Table 5: Summary statistics of pedological attributes for the two datasets: the RMQS and Si dataset.
Properties Units RMQS, n=2088 Si dataset, n=673 Wilcox-test p-value
range Median range Median
Clay g kg-¹ 2 - 819 211 5 - 819 212 0.65 Fine silt g kg-¹ 1 - 539 231 1 - 539 231 0.99 Coarse silt g kg-¹ 1 - 551 146 1 - 518 144 0.81 Fine sand g kg-¹ 3 - 722 115 4 - 677 118 0.43 Coarse sand g kg-¹ 1 - 970 140 2 - 966 137 0.83 CEC cmol kg-¹ 0.3 - 64 10 0.5 - 60 10 0.36 pH - 3.7 - 9.2 6.2 3.8 - 8.9 6.2 0.61 OC g kg-¹ 0.6 - 243 19.3 2.6 - 243 18.8 0.36 carbonates g kg-¹ 0.5 - 866 0.5 0.5 - 866 0.5 0.57
34
Table 6: Summary statistics of performance indicators of the cross-validation for the two PTF models. RMSE, bias 625 and CRPS are in g kg⁻¹. 626 627 628 629
Model statistics R2 RMSE Bias CRPS
pedological Min. 0.85 23.21 0.43 53.47 Max. 0.90 28.57 5.63 64.88 1st Qu. 0.86 25.50 1.19 55.62 3rd Qu. 0.87 27.39 3.66 60.07 Median 0.86 26.95 1.94 57.68 Mean 0.87 26.48 2.37 58.04 Var. 0.2 10-3 2.47 3.12 13.16 sd. 0.01 1.57 1.77 3.63 MIRS Min. 0.94 11.41 -0.12 17.43 Max. 0.98 17.67 3.71 29.65 1st Qu. 0.95 14.21 0.20 19.74 3rd Qu. 0.96 17.07 2.06 24.59 Median 0.95 16.04 0.64 21.25 Mean 0.96 15.31 1.15 22.36 Var. 0.2 10-3 4.70 1.57 14.32 sd. 0.01 2.17 1.25 3.78
35
Table 7: Important wavelengths in MIRS along with reported peaks and their assignments. 630
631
Reported peaks (wavenumber in
cm−1)
MIRS region from reference (wavenumber
in cm−1)
Soil constituent and
Assignment Reference
567 600-150 clay : Si-O, Al-O
bending Vaculíková and Plevová, 2005 721 727-713 carbonates : CO₃ Vaculíková and Plevová, 2005; Nguyen et al., 1991 1107 1120-1000 clay : O-Si-O stretching Saikia and Parthasarathy, 2010;
Madejová, 2003 1300-1338 1360-1347 clay : Al-O as Si cage
(TO₄ ) Saikia and Parthasarathy, 2010 1801
2000-1650 quartz : O-Si-O stretching Bertrand et al., 2002; Janik et al., 1998; Nguyen et al., 1991 1878
1994
2534 2600-2500 carbonates : CaCO₃ overtone and combinaison vibrations
D’Acqui et al., 2010; Du and Zhou, 2009; Vaculíková and Plevová,
2005; Bertrand et al., 2002; McCarty et al., 2002; Nguyen et al.,
1991
2881 2880 carbonates : CaCO₃ overtone and combinaison vibrations
Vaculíková and Plevová, 2005; Bertrand et al., 2002; McCarty et
al., 2002; Nguyen et al., 1991
2997 3000-2900 carbonates : CaCO₃ overtone and combinaison vibrations
Vaculíková and Plevová, 2005; McCarty et al., 2002; Nguyen et al.,
1991
3730 3697 (1), 3750-3400 (2) clay : Al---O-H stretching
Saikia and Parthasarathy, 2010 (1); Vaculíková and Plevová, 2005 (2);
Nguyen et al., 1991
632 633