HAL Id: cea-02397446
https://hal-cea.archives-ouvertes.fr/cea-02397446
Submitted on 6 Dec 2019HAL is a multi-disciplinary open access
archive for the deposit and dissemination of sci-entific research documents, whether they are pub-lished or not. The documents may come from teaching and research institutions in France or abroad, or from public or private research centers.
L’archive ouverte pluridisciplinaire HAL, est destinée au dépôt et à la diffusion de documents scientifiques de niveau recherche, publiés ou non, émanant des établissements d’enseignement et de recherche français ou étrangers, des laboratoires publics ou privés.
Use of nanoprobes to identify iron-silicates in a
glass/iron/argillite system in deep geological disposal
Charly Carrière, Philippe Dillmann, Eddy Foy, Delphine Neff, J.J. Dynes, Y.
Linard, N. Michau, C. Martin
To cite this version:
Charly Carrière, Philippe Dillmann, Eddy Foy, Delphine Neff, J.J. Dynes, et al.. Use of nanoprobes to identify iron-silicates in a glass/iron/argillite system in deep geological disposal. Corrosion Science, Elsevier, 2019, 158, pp.108104. �10.1016/j.corsci.2019.108104�. �cea-02397446�
Use of nanoprobes to identify iron-silicates in a glass/iron/argillite system in deep
geological disposal
C. CARRIERE1,2, P. DILLMANN1, E. FOY1, D. NEFF1, J.J. DYNES3, Y. LINARD2, N. MICHAU2, C. MARTIN2 1 LAPA-IRAMAT, NIMBE, CEA, CNRS, Université Paris-Saclay, CEA Saclay 91191 Gif-sur-Yvette Cedex, France
2 Andra, Research & Development Division, 1/7 rue Jean Monnet, 92298 Châtenay-Malabry, France
3 Canadian Light Source, 44 Innovation Boulevard, Saskatoon, SK, S7N 2V3, Canada
Keywords: SON68 nuclear glass, iron corrosion, glass alteration layer, STXM, Si K-edge, phyllosilicate,
Abstract
The understanding of glass alteration mechanisms in contact with iron is a major issue to study the long-term behavior of radioactive waste package in repository conditions. A glass/iron/claystone system was altered in contact with COx water at 50°C for 4.5 years in Andra's underground research laboratory in Bure, France. Multiscale and multitechnical (SEM-EDX, µRaman, STXM and TEM) characterization of the system revealed the presence of nanometric crystalline Fe(III)-rich smectite, assimilated to nontronite, in the glass alteration layer and in corrosion products. These phyllosilicates were identified by STXM using a comparative approach with a database of reference spectra obtained on iron-silicate.
Introduction
Glass is commonly used in many applications, such as optic fibers [1], medieval stained glass [2,3], dental glass [4,5], and vitrification of radioactive waste [6,7] due to its durability. Nevertheless, it is subject to alteration processes, especially in water. To set up a reliable prediction of its behavior, glass alteration mechanisms must be understood in detail. In the specific context of French nuclear industry, the French National Radioactive Waste Management Agency (Andra), designs a repository for the disposal of High Level Radioactive Waste (HLW) in a clay medium [8].
Performance assessment of the glass matrix strongly depends on several parameters: temperature, water composition and its renewal rate, chemical interactions with elements in solution, near field-environment, etc [9,10]. Leaching is the most probable process for nuclear glass (R7T7-type) alteration [11]. It begins with the penetration of water into the glass associated with the release of alkali in the solution according to the hydratation/interdiffusion mechanism [12]. In parallel, glass hydrolysis, always induced by water, depolymerizes and dissolves the glass by breaking the Si-O-Si and Si-O-Al bridging bonds, for example. These two stages generate a high dissolution rate, called the initial dissolution rate, which tends to fall by several orders of magnitude when a protective gel is formed on the glass surface, between pristine glass and solution. It is formed when the solution is saturated in silicon, in addition to a condensation of hydrolysed Si within the gel [13].
The French concept to dispose and confine HLW relies on a borosilicate glass matrix in a stainless steel canister, enclosed in a carbon steel overpack and emplaced into a low permeability clay host rock. The aim of these packages is to prevent glass alteration and to limit migration of radionuclides released under the action of water over a timescale of a few thousand years [8]. After an initial resaturation transient, clay water will inevitably corrode steel overpack, reach up to glass and cause its hydrolysis. Iron corrosion and glass hydrolysis release iron and silica in solution. These elements could precipitate to form Fe-O-Si phases and modify the chemical equilibria. These phases could be considered as phyllosilicates which have been shown to play a major role in the dissolution of glass [14–19]. These laboratory experiments studies exhibited the deleterious effect of such phases regarding the glass alteration kinetics. Indeed the precipitation of Fe-O-Si phases in the glass alteration layer (GAL) or in Iron Corrosion Products (ICP) can lower the concentration of Si in solution and prevent the formation of a protective gel layer. The knowledge of the exact nature of these neoformed phases is crucial for modelling the long-term alteration of glass. Although models exist (GRAAL [9], GM2001 [20]), considering the long-time scale, predictions need to be validated by representative samples altered in the same environment expected in the future nuclear waste disposal site. Unfortunately, there is little information about the nature of these phases neoformed under repository conditions. Consequently, it is necessary to perform extensive characterization on
representative systems. For these reasons, a glass alteration in a glass/iron system in contact with water and claystone altered at 50°C for 4.5 years in the Andra’s Undergrounds Research Laboratory (URL) has been studied. The aim of the present paper is to improve the methodology presented by Carrière et al. [21] in order to characterize at the nanoscale Fe-O-Si neoformed phases in the experimental system. This methodology is based on a combination of Scanning Transmission X-ray Microscopy (STXM) at the Fe L and Si K-edges including the study of new reference spectra of phyllosilicates and Transmission Electron Microscopy (TEM) [16,19,21–30].
Materials and methods
Glass/iron/argillite system
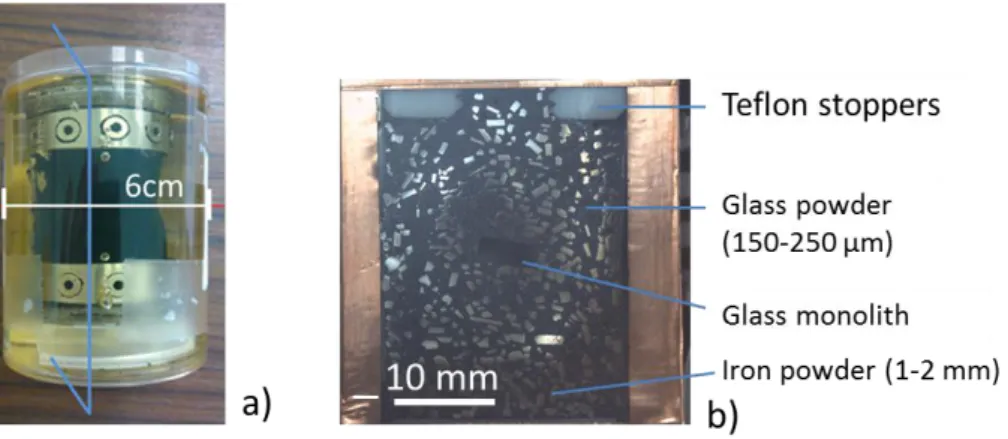
“MVE1201” is an in-situ experiment (acronym for glass-environment materials, in French) performed in the test interval of a 10 m long vertical descending borehole in the Andra’s URL (490 meters deep). The test interval was initially filled with a mixture of glass powder (particle size: 150-250 μm, composition in Table 1) and iron filings (particle size: 1-2 mm, composition given in Table 2). The test interval was initially saturated with a synthetic water simulating the porewater chemistry of the surrounding Callovo-Oxfordian argillaceous rock (COx), dopped with iodine and deuterium. The interval pressure was raised to 40 bars (close to the pressure of the rock surrounding the sealed interval). Due to the lack of hydraulic pressure difference between the interval and the surrounding rock, the transport of dissolved elements was mainly diffusive. In contact with the same water, four cells fixed at the extremity of rods were filled with the same glass/iron mixture to allow to sample the solid phases at four times. Around the vessel, a heater system maintained a temperature of 50°C. A closed water circulation was maintained at flow rate equal to 5 mL/minute between the interval and a module located in the drift. This module was made of a circulation pump, a flowmeter, several sampling cells used to get samples of the leachate and monitor its chemical evolution.
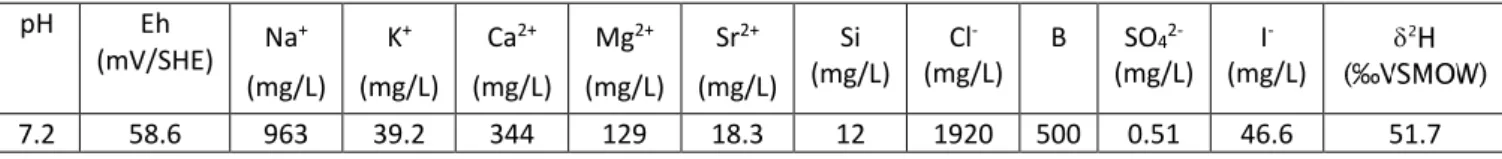
Sample used in this study was leached for 54 months. The average pH of the alteration solution measured over time was 6.98 ± 0.11 [31]. The temperature was constant, and its measured value was between 50 and 55 °C. Composition of COx water measured just before dismantling is given in Table 3.
After the 2-hour dismantling, the system was frozen at -20°C for 48 hours and then lyophilized under vacuum for 3 days to eliminate water. The MVE system was embedded in a tri-component epoxy resin Flucka (resin + hardener + accelerator) under vacuum. It was cut and polished to 1 µm roughness under a N2 atmosphere in glove box (oxygen content less than 100 ppm). The Figure 1 shows the embedded system and the section obtained after cutting according to the blue vertical axis (with copper adhesive tape for SEM observations).
Analytical techniques
SEM-EDS
Scanning electron microscopy coupled with dispersive energy spectroscopy (SEM-EDS) was used to observe the alteration of the glass and iron particles, which can be identified by the GAL and ICP. The morphology and elemental chemistry analyses of the polished cross-section samples previously coated with carbon by depositing a layer approximately 15 nm thick in order to avoid charge accumulation on the glass surface, were conducted using a Jeol JSM-7001F Field Effect Scanning Electron Microscope (SEM-FEG). Electrons are produced from LaB6 and accelerated to adjust the sensitivity to the resolution or intensity of the signal. Two detectors equip the SEM, one detects backscattered electrons to obtain images that are sensitive to the chemical composition while the other collects the secondary electrons. The microscope is also coupled to an EDS SDD detector (Silicon Drift Detector) for chemical analysis and quantification of elements using mainly hyperspectral mapping (each pixel in the image is associated with an EDS spectrum). The acquisitions and the processing were done with Aztec from Oxford Instruments. These maps were obtained using an acceleration voltage of 15 kV so that all the characteristic lines of the elements of interest can be excited.
MicroRaman spectroscopy
Raman analyzes were carried out on an Invia Renishaw micro-spectrometer equipped with a Nd-YAG green laser doubled with 532 nm wavelength and equipped with a CCD detector associated with a 2400-line array. Laser power was filtered at 0.1 mW. The beam was focused using a Leica DMLM optical microscope with 5 lenses (x5, x20, x50, x50 long distance and x100). At x50 the size of the beam was approximately 1 μm² and the depth probed was of the order of a micrometer. Raman spectra were recorded with a resolution of 2 cm-1 and the spectrometer was calibrated on a silicon wafer with a main vibration band at 520.5 cm-1.
Spectra acquisition and processing were done using Wire 3.4 software. Spectra acquisitions in point mode are recorded between 200 and 1300 cm-1 and / or between 3200 and 3900 cm-1. Cosmic lines were removed and the baseline is sometimes adjusted to overcome the effects of fluorescence. The oxygen-sensitive sample was placed in an anoxic cell before analyses [32].
FIB
The areas of interest identified by previous techniques were cut perpendicular to the surface to prepare thin foils using an electron-ion double-column microscope (SEM-FIB). Two focused ion beams were used. The first, brand FEI Helios Nanolab 660 from CIMAP / GANIL in Caen, France, with a variable acceleration voltage from 0.5 kV to 30 kV and an ion current of 1 pA and 65 nA. The second, a FEI Strata DB 235 at IEMN Lille, France, of which voltage varies from 0.2 kV to 30 kV and a
current intensity ranging from 1 pA to 20 nA. The double electronic / ionic column allows identification and machining of FIB foils. Platinum (Pt) was deposited on the surface of zone of interest with the electron and ion beam to protect from irradiation and ensure the mechanical strength of the foil during thinning. Thinning was performed on each faces of the foil with the Ga+ to obtain the desired thickness. A "cleaning" of the 2 faces at 5, 2 and 1 keV punctuated the preparation of the foils to eliminate the layer of damage and contamination. Firstly, the foil was thinned to 1 µm for STXM analyses at Si K-edge. Then it was re-thinned to 100 nm for STXM investigations at Fe L-edge then TEM observations.
TEM
Transmission electron microscopy (TEM) was carried out at 200 keV with a JEOL 2010 F electron gun at CIMAP / GANIL Caen, France. It was also equipped with a diode EDAX X-ray microanalysis, which allows chemical analysis in addition to imaging or electron diffraction to characterize nanoscale phases. Electron diffraction was used on nanometric phases which have a composition close to silicate. Selected area electron diffraction (SAED) ring pattern obtained provides information on crystallinity. Furthermore, in real space, d-values were calculated for each ring with ImageJ software, and then compared to the d-values (corresponding to hkl indices) with diffraction data from American Mineralogist Crystal Structure Database (AMCSD). The error of the measurement was 0.05 Å.
STXM
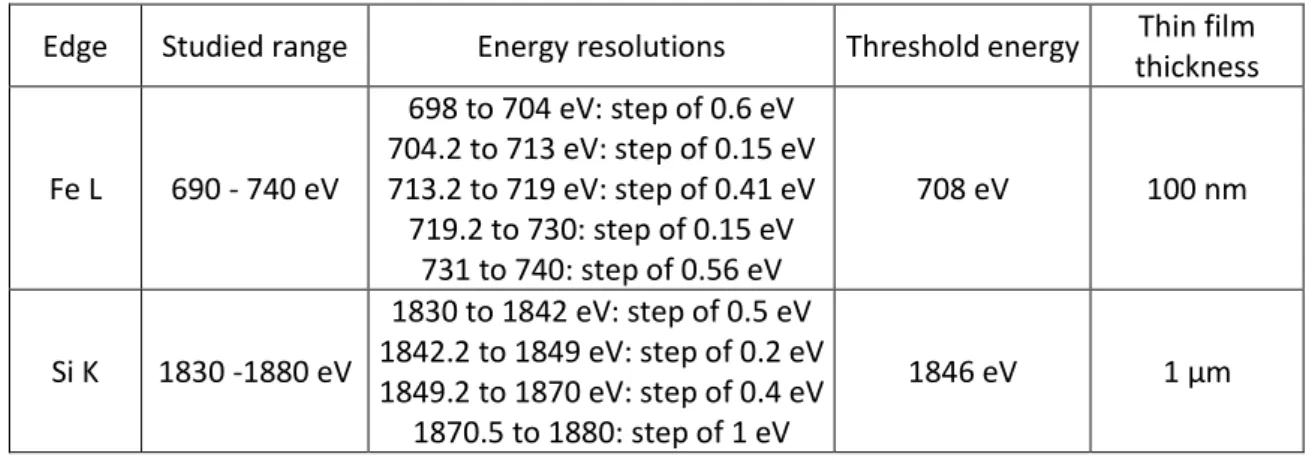
The scanning transmission X-ray microscopy (STXM) data collection was performed on the Canadian Light Source (CLS) SM 10ID-1 beamline at the University of Saskatchewan (Canada). The high energy accelerator includes a 300 MeV linear accelerator, a 2.9 GeV synchrotron and a storage ring that operates at 1.9 GeV at a current of 250 mA. STXM is a technique based on the absorption of X-rays around the absorbing atom. The spatial resolution is close to 30 nm, corresponding to the size of the beam for a flux of 108 photons/s. The technique provides spatial information on the nanostructure, the chemical environment or the valency of phases. The chemical environment of silicon is probed at the K-edge and allows the atomic environment around the absorber atom to be determined at a distance greater than 5 or 6 Å [33–36]. Fe L-edge gives the valence and speciation of this element contained in alteration layers of glass, iron corrosion products and ferro-silicate phases [37–39]. The energy ranges of these edges, the step corresponding to the energy resolution, as well as the thicknesses of the foils specific to each edge are given in Table 4.
Between 100 and 200 hyperspectral images (stacks) were collected on the foils at different energies by scanning the desired range (Table 4). At first, the drift of each hyperspectral image was corrected by performing an alignment. Then they were converted into optical density images (OD = -ln (I / I0)
where I represents the intensity of each pixel of the sample and I0 the incident intensity measured in an area devoid of sample. Principal component analysis (PCA) of the stack allowed us to find regions with the same spectral signal, from which average spectra were derived [40]. Spectra were calibrated in energy by using a reference phase (1846.6 eV for quartz at Si K-edge, 708.3 eV and 710.0 eV for L3-a L3-and L3-b respectively for mL3-aghemite L3-and siderite L3-at Fe L-edge). Using reference spectrL3-a normL3-alized to an absolute linear absorbance corresponding to a phase thickness of 1 nm (expressed in optical density [38]), experimental spectra were then decomposed using a least squares method. This decomposition was done using standard reference spectra from the database created during this work. The best fit using the smaller number of reference spectra was then selected based on statistical parameters such as chi², correlation coefficient, total thickness. Since each spectrum obtained from the references were normalized to a thickness of 1 nm, the total thickness obtained for the model spectra is an estimate of the total thickness of the foil or the phase. The consistency with the real thickness ensure to the quality of the decomposition analysis. All analyses were conducted using aXis2000.
Reference compounds
Silicate reference compounds were chosen in order to implement a comparative approach with the Si species detected in the altered glass/iron/claystone system. The chosen Si species were the most probable at the temperature and pressure conditions expected in Andra's URL in Bure, and in agreement with the literature (especially with the thermochemistry database developed by Andra [41]). Thereby the choice was restricted to phyllosilicates belonging to serpentine-kaolinite (1:1 group), smectite and mica (2:1 group), and chlorite (2:1:1 group). Table 5 specifies the formula and source of each reference phases. Berthierine, greenalite, cronstedtite and chamosite come from Excalibur Mineral Corporation. Saponite FeIII and saponite FeAl were synthetized by IMPMC (Sorbonne University, Paris, France) by a hydrothermal treatment of hydrolyzed gel Na, Mg, Al and Si hydroxides [42]. They contain Fe3+ and Fe3+ plus Al3+ in tetrahedral site respectively. Georgia kaolinite (KGa-1), California chlorite (CCa-2), California hectorite (SHCa-1) and Australia nontronite (NAu-2) were provided by the Clay Mineral Society. Muscovite was provided courtesy of ISTeP (Sorbonne University, Paris, France), and nontronite Garfield came from Garfield, Washington, USA. Saponite B46 is an autohydrothermal ferroan saponite [43].
Each compound was identified by X-ray diffraction in our laboratory (not shown). The samples for STXM analyses were prepared according to the procedure described by Rivard et al. [29], namely a silicate or iron powder in an alcoholic solution placed on a carbon-coated copper TEM grid and air-dried.
Results
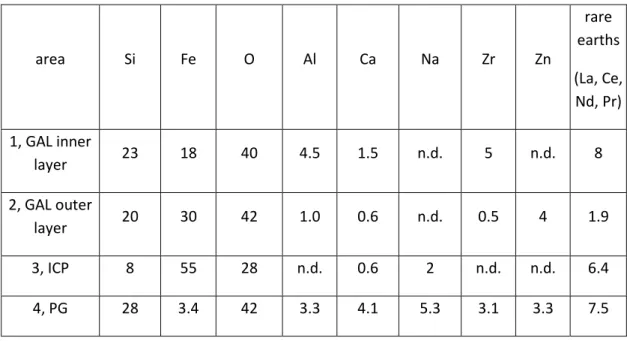
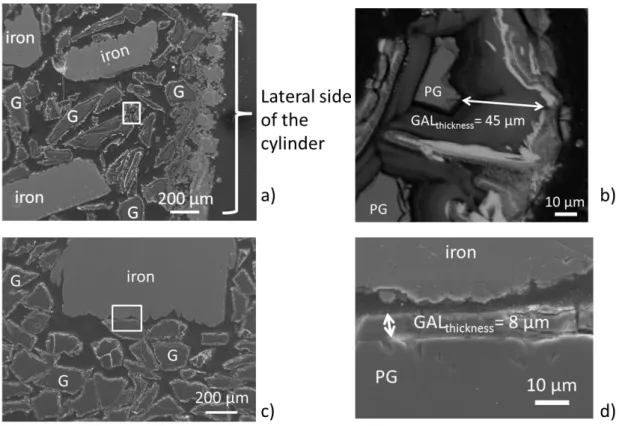
The SEM micrograph presented in Figure 2 shows a representative distribution of glass and iron powder. Distance between iron and glass particles does not exceed 600 µm in two dimensions. The GAL thicknesses were observed to vary depending on their location in the system. Along the sides of the cylinder, the GAL are thicker (sometimes reaching 50 µm, see Figure 3-a and b) than in the center of the cylinder (about 10 µm, Figure 3-c and d). At the outer surface of the GAL, (Figure 3-b) the typical presence of heavier elements appears in brighter layers on the SEM micrograph because of their high atomic number. All glass particles present the same alteration faces, except along the sides. A closer observation of the GAL by SEM coupled to EDS suggests that it is made of two different layers (Figure 4). The inner layer is thicker than the outer layer, around 6 and 2 µm respectively. GAL is easily identified and localized on cross section by the absence of Na caused by glass hydration and interdiffusion mechanism [12,44], while this element is present in the pristine glass (PG) (Table 6). Because Zr has a low solubility in water [9,13], it is considered as the last element to decrease in content in the GAL during the alteration of glass in water. The Si/Zr ratio between PG and GAL-inner layer provides information on the alteration process, decreasing from the PG (where it is close to 10) to the inner GAL (4.5). A decrease of Si/Zr ratio means a silicon concentration decrease in the GAL compared to the PG, which suggests glass hydrolysis [9,45]. Furthermore the inner layer contains 8 wt.% of rare earths elements (i.e. lanthanides: Nd, La, Ce for the most representative) against only 2 wt.% in the outer layer, as they are locally precipitated. Moreover the outer layer does not contain Zr, and few quantities of rare earths (lanthanides), suggesting a dissolution/reprecipitation process for this layer. Otherwise, the iron content shows a sharp increase in the GAL compared to the PG, and moreover is distributed differently in the outer and inner layers of the GAL (respectively 18 and 30 wt.%, see Table 6). Si/Fe ratios are higher in the inner part of the GAL (0.8) compared to the outer part (1.5).
In summary, from these observations it appears that GAL consists of 2 layers. The inner one related to the gel with a low retention of Si, from which the alteration rate can be determined, and an outer one on the gel surface considered as a precipitated layer.
A layer of Iron Corrosion Products (ICP) was found along the metallic iron grains, averaging about 2 µm in thickness, and not exceeding 5 µm. EDS measurements made on the ICP (Figure 4, location 3 and Table 6) show that, in addition to the presence of oxygen and iron, the ICP layer is enriched in Si, with a Fe/Si ratio close to 7, and to a lesser extent with Na (2 wt.%) and Ca (1 wt.%).
MicroRaman spectroscopy was performed at different locations on the transverse section (Figure 5). The spectra obtained from the ICP have an intense vibration band at 1069 cm-1, and two less intense
bands at 300 and 380 cm-1. These bands are characteristic of chukanovite Fe2(OH)2CO3, an iron carbonate [46]. No iron-silicate phases were identified by this method, despite the presence of silicon in the ICP. This was attributed to the extremely weak Raman scattering of these phases [26]. The spectra obtained on the GAL only shows the characteristic broadbands of a glassy structure around 285 and 930 cm-1, again, no iron-silicate phases were identified by this method.
To perform investigations on these silicon containing phases at the nanoscale, a thin foil was sampled by FIB in an area containing the PG, ICP and GAL layers (Figure 6). STXM and TEM analyses were performed on the same foil. To avoid potential irradiation damage caused by electrons (amorphization of potential crystallized phases), STXM characterization were performed first at the Si K-edge on the 1.0 ± 0.2 µm thick foil. Then, after a slimming to a thickness of 100 ± 20 nm by FIB, first STXM at Fe L-edge then TEM analyses were performed. TEM observations in the GAL and in ICP show the presence of nanometric particles (about 100 nm in length) only in the inner part of the GAL (Figure 7-a). TEM-EDS analyses on the particles (Table 7) revealed that they consisted mostly of oxygen (28 wt.%), silicon (17 wt.%) and iron (24 wt.%). The Fe/Si ratio is 1.4. Minor elements such as Ca, Na, Al and Zn were also detected. Note the presence of rare earth elements (18 wt.% i.e. 4 at.%) in the glass matrix. SAED was performed on crystallites (Figure 7-b). The presence of distinct rings indicates the crystallinity of the particles. Measured inter-reticular distances were compared to AMCSD and International Center for Diffraction Data (ICDD) based on x-ray diffraction data of silicates, iron oxides and rare earths oxides. Despite the lack of precision of electron diffraction and the fact that the diffracted intensities do not correspond to the one of X ray diffraction, the best similarity is obtained with the most intense lines of Garfield nontronite (AMCSD-007180 Table 8),
Na0.4FeIII2(Si, Al)4O10(OH)2, an iron aluminosilicate of the smectite group. However the typical lines of
dehydrated smectites corresponding to long inter-reticular distances, for example around 10 Å for d[001], are not visible on the SAED pattern probably because they are located too close to the direct beam, forbidding the unambiguous identification of nontronite with this method.
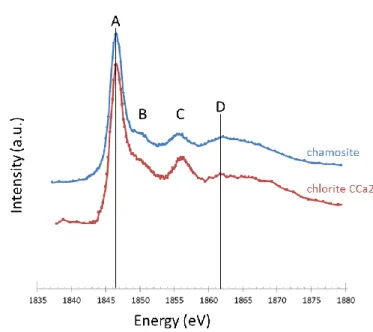
For STXM analyses, spectra were first collected at the Si K and Fe L-edges on iron oxides, carbonates and silicates reference materials (Table 5). Figure 8 to Figure 11 present STXM spectra collected at the Si K-edge for serpentines-kaolinite group, smectites group, chlorites group, mica and pristine nuclear glass SON68. All these phases have the most intense peak at 1846.6 eV (noted A) due to Si fourfold coordinated by O [47]. Except for cronstedtite and pristine glass, an intense peak is also present around 1855-1857 eV (noted C). The shape and intensity of the peak around 1850 eV (noted B) varies. It is present as a shoulder or a sharper oscillation for serpentines-kaolinite group, chlorites group and for mica. For smectites group, it is present for the 3 saponites but totally absent for the 2 nontronites (Garfield and NAu-2), montmorillonite (SWy-2) and hectorite (SHCa-1). It is also absent in
the nuclear glass spectrum. A more or less intense broad band around 1862 eV (noted D) is present for all phases and is due to the contribution of neighboring O [16].
Figure 12-a shows the Si K-edge map (subtraction of two images, one acquired at the maximum absorption threshold of the element at 1846.6 eV, and a second taken before the edge, at 1835 eV) from the entire thin foil of the experimental sample. It clearly shows the PG, GAL and ICP layers (Figure 12-a), corresponding to various Si concentration. Stacks from which Si K-edge spectra were extracted were then collected at different locations in the PG, the inner and outer part of the GAL, and in the ICP part which contain Si (Figure 12b). Spectra obtained at any location in the inner, outer GAL or ICP have the same general features and differ from the one obtained in the PG. The latter spectrum corresponds to amorphous SiO2. The structure observed on the other spectra reflects the crystallinity, at least in part, of the Si-containing phases in GAL and ICP. The peaks observed at the A (1846.60 eV), C (1856.5 eV) and D (1862.6 eV) positions on the silicate references are present on the experimental spectra, while the B oscillation (1850 eV) is absent. Thus, a qualitative comparison with the database of silicate references promotes the smectites group (nontronite, montmorillonite, hectorite). Indeed, only these phases present A, C and D oscillations and absence of the B oscillation. Note also that the intensities of the oscillations C and D are equivalent, contrary to what is observed on smectite-group spectra. Nevertheless, a qualitative comparison between references and experimental spectra exclude the presence of chlorites, mica, serpentines, kaolinite and saponites. Linear regression fits of the experimental spectra were performed using references (nontronite NAu-2, nontronite Garfield, hectorite SHCa-1, montmorillonite SWy-2 and pristine glass). Spectra were decomposed following the procedure indicated in the methodology part with several combinations of reference spectra. The best fit is shown in Figure 13 and Table 9. It is obtained with combination of two reference phases only: nontronite Garfield (an iron-silicate of smectite group (Na0,4FeIII2(Si,Al)4O10(OH)2)) and amorphous glass spectrum. Compared to the experimental spectra,
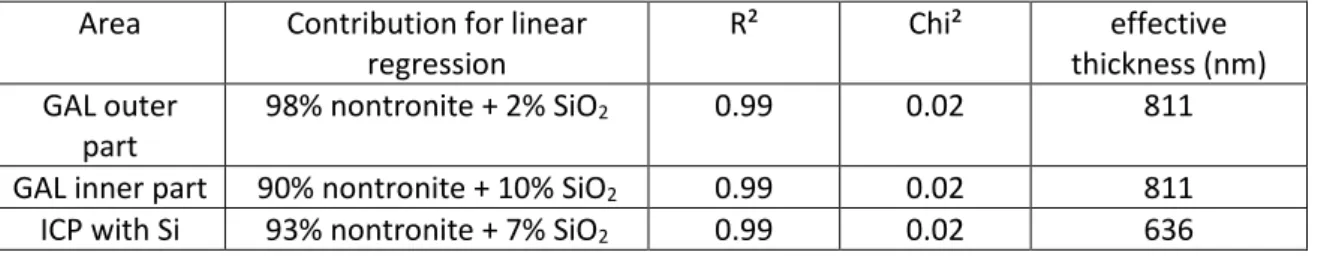
there is no energy shift, and the intensities of oscillations in position A, C and D (around 1846 eV, 1855 eV and 1862 eV) are the same. Correlation coefficient and chi² equal to 0.99 and 0.02 respectively also testify to the good quality of the fit. Regarding inner part of GAL, linear regression analysis indicated it was 90% nontronite Garfield and 10% SiO2 (expressed in equivalent thickness following the methods proposed by Dynes et al. [38] – see methodological part), versus 98% nontronite Garfield and 2% SiO2 in the outer layer. The total thickness, 811 nm, of the simulated spectrum is in good agreement with the thickness of the foil (1.0 ± 0.2 µm), suggesting a reliable fit. Note that in both cases the contribution of amorphous SiO2 spectrum is essential for a satisfactory decomposition, and in particular to respect relative intensities of A, C, and especially the intensity in D position. Concerning ICP, best result was obtained with nontronite Garfield (93%) and SiO2 (7%).
The total thickness, around 640 nm, is lower than the thin foil thickness which can be explained by the fact that silicon containing phases are not the majority phase throughout the ICP, where chukanovite was identified by microRaman as the majority phase.
The Fe L-edge spectra were obtained after collecting stacks respectively on ICP and GAL (Figure 14-a). Note that there is no difference between spectra obtained in the inner and outer part of GAL. The spectrum obtained in the ICP corresponds to a Fe(II)/Fe(III) mixed oxidation degree. On the contrary, the spectra obtained in the GAL corresponds more to a phase with a high Fe(III) content. Because the Fe L-edge is affected by the valence [37,48,49], we chose to fit the spectra by a linear combination of pure Fe(II) and Fe(III) reference phases (siderite and maghemite, Fig. 14) and the Fe(II)/Fe(III) proportion is deduced following the procedure presented in the methodological part. The same fit was made on the nontronite reference spectra. The results confirm that the main part of iron contained in nontronite Garfield is Fe(III), around 90% versus 10% of Fe(II), as expected in Fe-rich dioctahedral phyllosilicate (Table 7). Iron valency in GAL is also 90% Fe(III) and 10% Fe(II) which is consistent with the valency of iron in the glass (Fe(III)) and the presence of nontronite. On the contrary, a mixed valence around 50% Fe(III) and 50% Fe(II) is observed in ICP, according to the presence of nontronite and iron carbonate respectively (Table 10).
Discussion
The maximum ICP layer thickness measured on the metallic iron particles was 5 µm. In addition to Fe and O, ICP layer contained around 10 wt.% of silicon, with an Fe/Si ratio close to 7. Traces of Ca and Na were also present. Only chukanovite (Fe2(OH)2CO3), an Fe(II) carbonate, was identified in the ICP layer by microRaman spectroscopy. This Fe(II) valency was in agreement with a carbonated and anoxic environment under the conditions of the experiment. This phase, formed by precipitation of aqueous carbonates with Fe(II), was observed by numerous authors associated with generalized corrosion [16,19,26,27,49–52]. In addition to this carbonate, structural information given by X-ray absorption spectroscopy at the Si K-edge also suggested that dioctahedral Fe(III)-rich smectites which contain silicon were present in the ICP layer. Therefore Fe(II)/Fe(III) ratio detected at Fe L-edge in the ICP layer was probably due to concomitant presence of nontronite (Fe(III)) and iron carbonate (Fe(II)). Ca and Na were associated with nontronite. Note that these two elements, as well as silicon, could come from both COx solution in equilibrium with claystone and glass alteration.
There was an altered layer of glass on all the surfaces of the glass particles. All glass particles showed the same alteration faces, except along the sides of the system, thus pointing to homogeneous alteration, with a GAL thickness at around 8-10 µm. Despite alteration (as proven by the Na
disappearance and the Si depletion), the inner layer, related to the gel, has conserved some glass feature as it contains rare earths (RE) and Zr (elements that are the last released during alteration process). The Si/Zr ratio in the inner layer was about 5 compared to non-altered glass (Si/Zr ratio = 10), in accordance with hydration and hydrolysis mechanisms releasing the glass network former and modifier elements [11]. On the contrary, the outer part of the alteration layer did not have the signature of the glass, since Al and Zr were present only in traces, and RE locally precipitated as they are retained on the glass surface [53]. The absence (or low amount) of Al and Zr, and precipitated lanthanides suggested a dissolution/reprecipitation formation process.
Although SON68 glass contains some iron, significantly higher concentrations of this element were measured in GAL layer (both inner and outer), with a Fe/Si ratio close to 1 (compared to 0.12 in the PG), indicating that this element in the GAL layer came from the corroded iron particles. Indeed, iron incorporation into GAL porosity was already observed in previous studies of alteration of glass/iron/clay and glass/iron systems both at 50°C and 90°C [16–19,27]. The iron source (metallic iron, oxide, carbonate) and the glass to iron distance were presented as factors influencing the thickness of the GAL as well as the amount of iron in the GAL layer.
The combination of two nanometric chemical and structural analytical techniques enabled the identification of iron phyllosilicate phases with good confidence. First, the TEM observation showed the presence of crystallized nanoparticles which precipitated locally in GAL, the TEM-EDX indicating an atomic ratio Si/Fe of 1.4, compatible with phyllosilicates TOT [26]. Results of electron diffraction showed inter-reticular distances in good agreement with the ones of nontronite (Na,Ca)0.3Fe3+2(Si,Al)4O10(OH)2•n(H2O). The resolution of the STXM (30 nm) experiment did not allow for isolation of the nanoparticles identified by TEM. Nevertheless, the investigation of larger zones was undertaken. The comparison of spectra acquired by STXM at the Si K-edge in GAL, to phyllosilicate reference phases belonging to several structural groups (i.e. serpentine, kaolinite, di and trioctahedral smectite, chlorite, mica) suggested a mixture of nontronite and amorphous SiO2. A part of amorphous silica seemed to be slightly higher in inner layer of GAL than in outer layer, 10% and 2% in equivalent thickness respectively. A proportion of the amorphous silica in the inner layer could be attributed to the glass matrix, i.e. glassy framework depleted in Si compared to pristine glass, in which nano Fe-rich silicates had precipitated. This was confirmed by the presence of Zr and RE in the inner layer. The small part of amorphous silica observed in the outer layer could be due to the amorphization of a few tens of nanometers in thickness of each faces of the foil, during the FIB preparation [54,55]. But, the very low proportion of amorphous silica confirms that this layer corresponds to a reprecipitation zone, as already suggested by the absence of Zr. STXM observations at Fe L-edge, showed that iron bearing phases in the inner and outer layer of GAL contained mostly
Fe(III). This valence was compatible with that measured in the reference of Garfield nontronite. Thus dioctahedral Fe(III)-rich smectites, assimilated to nontronite, precipitate and crystallize in GAL, likely in the pores of the inner GAL [17,18], or after a dissolution reprecipitation process in the outer GAL. According to the literature [56,57], silicon, iron, and aluminum are the 3 essential elements for nontronite formation and the Si/Al/Fe ratio can directly affect the crystalline nature of the nontronites. These authors also suggested that other elements such as calcium enable the formation of well-ordered alumina nontronite. On the other hand, the use of potassium or sodium as a substitute for calcium forms poorly ordered nontronites. In the present study, the nontronites of the inner layer seem to be more crystallized, contrary to those of the outer layer and in the ICP which do not diffract. The presence of Al and Ca in inner layer and conversely the absence (or small quantity) of these elements in the outer layer and ICP could explain the crystalline nature of the nontronites (Table 6).
Although present in solution (Table 3), the absence of Mg in the GAL and in ICP (Table 6) layers could explain the absence of saponites (trioctahedral Fe-rich smectite) in the glass/iron/clay system [56,57], which could be formed under the conditions of temperature, pressure and potential of the URL. In addition, the initial pH for the formation of magnesium silicates must be greater than 8 at 50°C [56,58] which is not the case here, with a measured stable pH of 6.98 ± 0.11 [31].
Nontronites formation depends on the geochemical parameters, whether formed in the laboratory or in a natural formation. Near neutral pH, for temperatures below 100°C and pressures of a few bars, reducing conditions are required to synthesize and form nontronite [56,57,59]. Similar conditions, at pH close to neutrality and in reducing medium from -0.1 to -0.2 V/SHE, have resulted in the formation of nontronites in Lake Malawi in South Africa at 25 bars and 22°C [60], as well as in the Atlantis II deep in the Red Sea, for a temperature in the order of 100°C and a pressure of 200 bar [61–63]. Whether synthetic or natural nontronites, these formation conditions are close to those imposed by the COx in the present study (50°C, -190 mV/SHE and neutral pH).
Although Petit et al. [64] indicated that nontronite can be synthetized in laboratory in conditions from ambient to 200°C temperature, influence of temperature seems even more crucial in iron/claystone and/or glass/iron/claystone experiments. Indeed, studies showed that serpentines are preferentially formed at 90°C in such experiments, and at about 50°C the serpentines are no longer stable [16,23,24,26,30,50,65–67]. It could explain that at 50°C in our study only smectites were identified, and not serpentines.
Despite reducing conditions imposed by the COx, nontronites contain a majority of Fe(III). The literature mentions that Fe(III) predominates in the structure of this phase [68,69], confirmed by STXM at the Fe L-edge. Although some authors manage to synthetize nontronites in reducing conditions [56,57,70,71], mechanisms of Fe(II) oxidation to Fe(III) under anoxic and reducing conditions during nontronites formation are not clearly reported. The origin of iron oxidation could be explained by the reduction of water [72,73]. It could also result from a charge transfer after aqueous Fe(II) has been adsorbed and incorporated in the structure of the clay [59], as compensation of the charges during the oxidation which can cause the departure of metallic cations from the structure [74].
Note that iron rich phyllosilicates have already been observed in glass alteration layers. For example, Burger et al. [18] (glass/iron/claystone system at 50°C) and Michelin et al. [49] (glass/iron system at 30°C or 50°C) detected Fe-rich silicates phases but did not identify them, unlike Dillmann et al. [19] (glass/iron system at 50°C), Gin et al. [75] (Glass leached for 26 years in granitic groundwater at 90°C) and Aréna et al. [58] (glass + FeCl2 at 50°C) who detected respectively greenalite (serpentine group), TOT structure (smectite group) and trioctahedral smectite. Carrière et al. [21] highlighted Fe-rich phyllosilicates in GAL, assimilated to chlorites. But the comparison of their published data with the more complete database suggests clearly that the published spectrum is in better agreement with a mix of Fe(III)-rich nontronite and a small part of amorphous silica, as in the present study. Otherwise, basaltic glasses from hydrothermal magmatism, often used as natural analogue altered on the long term, contain crystallized smectites within alteration layer named palagonite [76,77].
Finally regarding the thickness of the inner layer of GAL, and assuming a constant rate, the dissolution rate of the glass was estimated at 1.0 to 1.4.10-2 g.m-2.d-1. It is lower than the initial dissolution rate of SON68 glass in COx water at 50°C, noted 𝑉0 𝐶𝑂𝑥50°𝐶 , equals to 9.3.10-2 g.m-2.d-1 [11]. Therefore, after 4.5 years of alteration, the average glass alteration rate, calculated from the gel thickness, was divided by almost 10 (V0/7 to V0/9 precisely). However it is higher than the residual dissolution rate, corresponding to a decrease of alteration kinetic of several orders of magnitude, obtained in saturation conditions of the silicon in solution at 90°C [15,78–82]. This is probably due to the presence of Fe in the gel which precipitates with hydrolyzed Si to form nontronite. The presence of Fe probably delays glass passivation and maintains a relatively high dissolution rate preventing condensation of hydrolyzed Si in the gel and saturation of the solution in Si [13,15–18,45,78–83].
Conclusion and prospect
A glass/iron system in contact with claystone was altered at 50 ° C for 4.5 years at -490 meters in the Andra’s underground research laboratory of Bure. It was characterized in order to identify the Fe-rich silicate phases that form during glass alteration and iron corrosion. The physicochemical parameters were monitored and remained stable over the period the system was in the drill hole (T °C, pH, pressure).
Multitechnical nanometric characterizations (STXM at Si K-and Fe L-edges, TEM) were performed on the same FIB foil and identified Fe-O-Si neoformed phases in the glass alteration layer and iron corrosion products. These phases correspond to Fe(III)-rich smectites assimilated to nontronite, consistently with the iron valence measured by STXM at the Fe L-edge. The average glass dissolution rate, calculated after 4.5 years from the gel thickness, corresponds to V0/10 and not to a residual rate. This could be explained by the presence of smectite in the gel, which consumes the hydrolyzed silica. The latter does not condense in the gel and the silica saturation conditions of the solution are not reached. Indeed these steps are necessary to form a protective gel that reduces the dissolution rate by several orders of magnitude.
At this stage of the study, it is not possible to determine the origin of the silicon detected in the ICP layer. It could come from either glass alteration or the solution (in equilibrium with claystone), while the iron contained in the GAL comes mainly from iron corrosion. Moreover, if Fe(II) phases were observed in the ICP layer, in good agreement with the literature, it appears that the nontronites contain Fe(III). Subsequently, it will be necessary to identify the mechanism by which Fe(II) oxidizes to Fe(III), a metallic cation contained in nontronite. Finally, if nontronites were detected for an alteration temperature of 50°C, it will be important to consider their stability according to the variations of the temperature within the waste package to reinforce the understanding of waste package behavior on the long term.
Acknowledgment
The CLS is supported by NSERC, CIHR, NRC, the Province of Saskatchewan, WEDC and the University of Saskatchewan. We thank Michel Schlegel and Benoit Dubacq for providing us silicate references, and we are grateful to Jean Louis Robert (deceased) for the saponites syntheses. These silicates have helped to establish a reference spectra database necessary for our work. Thanks to David Troadec (IEMN, Univeristy of Lille, France), Emmanuel Gardes and Delphine Levavasseur for cutting and thinning the FIB foils. Isabelle Monnet (Cimap, GANIL, ENSICAEN, France) acknowledge the French state managed by the National Research Agency through the “Investissements d'Avenir” programme
which reference is “ANR-11-EQPX-0020”, by the Normandie Region and the "Fonds Européen de Développement Régional" FEDER.
Tables
Table 1: Average composition of SON68 glass (in weight per cent, wt.%) obtained by X-ray fluorescence and inductively coupled plasma) Element wt.% Si 21.24 Ca 3.22 Li 0.8067 Zn 1.977 B 5.35 Cs 1.063 Al 2.56 K 0.4567 Sr 0.3433 Ba 0.615 Na 7.823 Sn 0.0257 Co 0.1833 Cr 0.0437 Ni 0.17 Fe 0.31 Mn 0.3567 La 1.753 Nd 2.093 Ce 4.15 Pr 0.5767 Zr 2.14 Mo 1.417 P 0.0823 O rest
Table 2: iron powder composition (certified by Alfa Aesar)
Element wt.%
Carbon 0.0006%
Sulfur 0.0010%
Iron Balance (>99.98%)
Table 3: chemical composition of COx groundwater measured just before dismantling
pH Eh (mV/SHE) Na + (mg/L) K+ (mg/L) Ca2+ (mg/L) Mg2+ (mg/L) Sr2+ (mg/L) Si (mg/L) Cl -(mg/L) B SO4 2-(mg/L) I -(mg/L) 7.2 58.6 963 39.2 344 129 18.3 12 1920 500 0.51 46.6 51.7
Table 4: energies for Si K-and Fe L-edges
Edge Studied range Energy resolutions Threshold energy Thin film thickness Fe L 690 - 740 eV 698 to 704 eV: step of 0.6 eV 704.2 to 713 eV: step of 0.15 eV 713.2 to 719 eV: step of 0.41 eV 719.2 to 730: step of 0.15 eV 731 to 740: step of 0.56 eV 708 eV 100 nm Si K 1830 -1880 eV 1830 to 1842 eV: step of 0.5 eV 1842.2 to 1849 eV: step of 0.2 eV 1849.2 to 1870 eV: step of 0.4 eV 1870.5 to 1880: step of 1 eV 1846 eV 1 µm
Table 5: phyllosilicates used for comparative approach
Layer Group
Chemical formulas *from webmineral
**from Data Handbook for Clay Minerals[84]
Provenance
1:1
Berthierine Excalibur
trioctahedral Serpentine (Fe2+,Fe3+,Al,Mg)2-3(Si,Al)2O5(OH)4*
Excalibur Mont St. Hilaire, Quebec, Canada Greenalite
trioctahedral Serpentine (Fe2+;Fe3+)2‐3Si2O5(OH)4*
Excalibur
La Union,
Murcia, Spain Kaolinite KGa-1b
dioctahedral Serpentine
(Mg0.02Ca0.01Na0.01K0.01)(Al3.86Fe0.023+Ti0.11)(Si3.83Al0.17)O10(OH)8
** Source clay Repository, Washington County, Georgia, USA Cronstedtite
trioctahedral Serpentine Fe2+2Fe3+(Si,Fe3+)O5(OH)4*
Excalibur (unspecified location)
2:1
Nontronite Garfield
dioctahedral Smectite Na0,3Fe3+2(Si, Al)4O10(OH)2.n(H2O)**
Garfield, Washington, USA Nontronite NAu-2
dioctahedral Smectite
M+0.97(Si7.57Al0.1Fe0.42)(Al0.52Fe3.32Mg0.7)O20(OH)4
M+=(Ca, Na, K)**
Uley Mine, South Australia Montmorillonite SWy-2,
dioctahedral Smectite (Ca0.12Na0.32K0.05)(Al3.01Fe0.413+Mg0.54)(Si7.98Al0.02)O20(OH)4**
County of Crook, State of Wyoming, USA Hectorite SHCa-1, trioctahedral Smectite
(Mg0.56Na0.42K0.05)(Mg4.6Li1.39)(Si7.75Al0.17Fe0.053+)O20(OH)4**
San Bernardino County, California, USA Saponite B46
trioctahedral Smectite Ca0.3(Fe2+,Mg,Fe3+)3(Si,Al)4O10(OH)2•4(H2O)*
Late Variscan Saar-Nahe Basin, SW Germany Saponite FeIII trioctahedral Smectite
Ca0.3(Fe2+,Mg,Fe3+)3(Si,Al)4O10(OH)2•4(H2O)*
Fe3+ in tetrahedra Synthetized
by IMPMC Saponite FeIIIAl
trioctahedral Smectite
Ca0.3(Fe2+,Mg,Fe3+)3(Si,Al)4O10(OH)2•4(H2O)*
Al et Fe3+ in tetrahedra Synthetized
by IMPMC Muscovite
dioctahedral Mica KAl2(Si3Al)O10(OH,F)2* ISTeP
2/1/1
Chamosite,
tri-trioctahedral Chlorite (Fe2+;Mg;Fe3+)5Al(Si3Al)O10(OH;O)8*
Excalibur unspecified location. California or Wyoming, USA Chlorite CCa-2 ,
trioctahedral Chlorite Ca0.05(Mg4.44Al0.6Fe3.473+Fe3.022+Ti0.06)(Si4.51Al13.49]O20(OH)16**
Flagstaff Hill,
El Dorado
County, California, USA
Table 6: SEM-EDX chemical composition analysis (wt.%) of the GAL, PG, and ICP obtained in rectangular areas shown on figure 4 (n.d. not detected)
area Si Fe O Al Ca Na Zr Zn rare earths (La, Ce, Nd, Pr) 1, GAL inner layer 23 18 40 4.5 1.5 n.d. 5 n.d. 8 2, GAL outer layer 20 30 42 1.0 0.6 n.d. 0.5 4 1.9 3, ICP 8 55 28 n.d. 0.6 2 n.d. n.d. 6.4 4, PG 28 3.4 42 3.3 4.1 5.3 3.1 3.3 7.5
Table 7: TEM-EDX chemical composition analysis (wt.%) of the nanoparticles identified on Figure 7
Element Si Fe O Al Ca Na Zr Zn rare earths (La, Ce, Pr, Nd) Wt.% 17 24 28 1.0 1.5 2 5.7 2.6 18.2
Table 8: comparison between measured distances on the SAED pattern and most intense d[hkl] of nontronite Garfield (AMCSD-007180), montmorillonite, saponite, chlorite, greenalite, magnetite and chukanovite
measured distance (Å) Garfield nontronite reference
montmorillonite saponite chlorite greenalite magnetite chukanovite
distance (Å) d[hkl] distance (Å) distance (Å) distance (Å) distance (Å) distance (Å) distance (Å) 9.6 001 9.69 12.3 14.37 7.08 4.57 020 4.84 6.15 7.18 4.72 4.3 4.37 -111 4.49 4.58 4.79 4.43 2.53 6.14 3.2 3.20 003 4.2 3.1 4.39 3.54 2.10 5.14 3.0 3.04 112 2.46 2.63 3.89 2.52 1.62 3.76 2.6 2.60 -131 2.53 3.59 2.15 1.48 3.73 2.4 2.40 -132 1.53 2.87 1.78 2.92 2.1 2.12 202 2.63 1.8 1.86 -134 2.57
Table 9: Parameters of the best linear regression at Si K-edge performed with smectite reference spectra and SON68 spectrum to fit experimental spectra in corrosion products and glass alteration layer
Area Contribution for linear regression R² Chi² effective thickness (nm) GAL outer part 98% nontronite + 2% SiO2 0.99 0.02 811
GAL inner part 90% nontronite + 10% SiO2 0.99 0.02 811
ICP with Si 93% nontronite + 7% SiO2 0.99 0.02 636
Table 10: valence of iron in glass alteration layer, in iron corrosion products and in the nontronite Garfield reference obtained with linear regression on Fe L-edge spectra
sample Fe(III) Fe(II) R² chi²
GAL 88 % 12 % 0.93 0.04
ICP 51 % 49 % 0.97 0.40
Figures
Figure 1: (a) photograph of the glass/iron/claystone system embedded in resin before cutting along the blue axis. (b) optical photograph of the cross section of the system. In black: SON68 glass powder and in bright iron powder
Figure 3: FEG-SEM micrograph of iron and glass particles (named G) along the side of the glass/iron cylinder (a, and zoom in white in rectangle b) and at the center (c, and zoom in white rectangle d) showing glass alteration layers thicknesses
Figure 4: SEM micrograph in secondary electron and EDX elementary mapping on representative facies of alteration in the glass/iron system
Figure 5: (a) backscattered electron micrograph with localization, in red and blue, of µRaman analyses. (b) µRaman spectra obtained in ICP (red) of iron powder assimilated to chuckanovite Fe2(CO3)(OH)2 and in GAL (blue)
Figure 6: (a) localization, in red, and FIB cross section of the sample. Pristine glass, glass alteration layer, iron corrosion products and iron are present simultaneously
Figure 7: (a) TEM bright field micrograph on black nanoparticles found in GAL inner layer and SAED pattern (b) with the identified d-spacings
Figure 9: Si K-edge spectra obtained on 7 smectites (saponite B46, 2 synthetized saponites, Garfield nontronite, NAu2 nontronite, montmorillonite SWy2, hectorite SHCa1)
Figure 12: Si K-edge spectra (a) and STXM Si K-edge cartography (b) obtained in the pristine glass (green), inner (blue) and outer part (purple) of the glass alteration layer, in nontronite Garfield (black) and in ICP (red) which contain silicon (ICP* does not contain Si)
Figure 13: experimental and fitted spectra obtained at Si K-edge in glass alteration layer (inner part) and in iron corrosion products
Figure 14: (a) Fe L-edge experimental spectra obtained on iron corrosion products (red) and on glass alteration layer (blue). See Fig. 12 for the location of areas from which the spectra are extracted. (b) Fe L-edge spectra obtained on references of iron II (siderite FeCO3). iron III (maghemite γ-Fe2O3) and nontronite Garfield
References
[1] Y.-F. Niu, J.-P. Guin, T. Rouxel, A. Abdelouas, J. Troles, F. Smektala, Aqueous Corrosion of the GeSe4 Chalcogenide Glass: Surface Properties and Corrosion Mechanism, J. Am. Ceram. Soc. 92 (2009) 1779–1787. doi:10.1111/j.1551-2916.2009.03132.x.
[2] M. Melcher, M. Schreiner, Statistical evaluation of potash-lime-silica glass weathering, Anal. Bioanal. Chem. 379 (2004) 628–639.
[3] L. Gentaz, T. Lombardo, A. Chabas, C. Loisel, D. Neff, A. Verney-Carron, Role of secondary phases in the scaling of stained glass windows exposed to rain, Corros. Sci. (n.d.). doi:10.1016/j.corsci.2016.04.005.
[4] G.J. Mount, Buonocore Memorial Lecture. Glass-ionomer cements: past, present and future., Oper. Dent. 19 (1994) 82–90.
[5] U. Lohbauer, Dental glass ionomer cements as permanent filling materials?–Properties, limitations and future trends, Materials (Basel). 3 (2009) 76–96.
[6] M.I. Ojovan, W.E. Lee, New developments in glassy nuclear wasteforms, Nova Publishers, 2007.
[7] I.W. Donald, Waste immobilization in glass and ceramic based hosts: radioactive, toxic and hazardous wastes, John Wiley & Sons, 2010.
[8] ANDRA, Evaluation of the feasibility of a geological repository in an argillaceous formation, 2005.
[9] P. Frugier, S. Gin, Y. Minet, T. Chave, B. Bonin, N. Godon, J.-E. Lartigue, P. Jollivet, A. Ayral, L. De Windt, G. Santarini, SON68 nuclear glass dissolution kinetics: Current state of knowledge and basis of the new GRAAL model, J. Nucl. Mater. 380 (2008) 8–21. doi:http://dx.doi.org/10.1016/j.jnucmat.2008.06.044.
[10] B. Grambow, Nuclear Waste Glasses - How durable ?, Elements. 2 (2006) 357–364.
[11] P. Jollivet, S. Gin, S. Schumacher, Forward dissolution rate of silicate glasses of nuclear interest in clay-equilibrated groundwater, Chem. Geol. 330 (2012) 207–217. doi:http://dx.doi.org/10.1016/j.chemgeo.2012.09.012.
[12] B.C. Bunker, G.W. Arnold, D.E. Day, P.J. Bray, The effect of molecular structure on borosilicate glass leaching, J. Non. Cryst. Solids. 87 (1986) 226–253.
[13] S. Gin, I. Ribet, M. Couillard, Role and properties of the gel formed during nuclear glass alteration: importance of gel formation conditions, J. Nucl. Mater. 298 (2001) 1–10. doi:http://dx.doi.org/10.1016/S0022-3115(01)00573-6.
[14] S. Gin, P. Jollivet, M. Fournier, F. Angeli, P. Frugier, T. Charpentier, Origin and consequences of silicate glass passivation by surface layers, Nat. Commun. 6 (2015) 6360. http://dx.doi.org/10.1038/ncomms7360.
[15] L. Neill, S. Gin, T. Ducasse, T. Echave, M. Fournier, P. Jollivet, A. Gourgiotis, N.A. Wall, Various effects of magnetite on international simple glass (ISG) dissolution: implications for the long-term durability of nuclear glasses, Npj Mater. Degrad. 1 (2017) 1.
[16] G. De Combarieu, M.L. Schlegel, D. Neff, E. Foy, D. Vantelon, P. Barboux, S. Gin, Glass–iron– clay interactions in a radioactive waste geological disposal: an integrated laboratory-scale
experiment, Appl. Geochemistry. 26 (2011) 65–79.
[17] D. Rébiscoul, E. Burger, F. Bruguier, N. Godon, J.-L. Chouchan, J.-P. Mestre, P. Frugier, J.-E. Lartigue, S. Gin, Glass-Iron-Clay interactions in a radioactive waste geological disposal: a multiscale approach, MRS Proc. 1518 (2013) 185–190. doi:10.1557/opl.2013.67.
[18] E. Burger, D. Rebiscoul, F. Bruguier, M. Jublot, J.E. Lartigue, S. Gin, Impact of iron on nuclear glass alteration in geological repository conditions: A multiscale approach, Appl. Geochemistry. 31 (2013) 159–170. doi:10.1016/j.apgeochem.2012.12.016.
[19] P. Dillmann, S. Gin, D. Neff, L. Gentaz, D. Rebiscoul, Effect of natural and synthetic iron corrosion products on silicate glass alteration processes, Geochim. Cosmochim. Acta. 172 (2016) 287–305. doi:10.1016/j.gca.2015.09.033.
[20] B. Grambow, R. Müller, First-order dissolution rate law and the role of surface layers in glass performance assessment, J. Nucl. Mater. 298 (2001) 112–124. doi:http://dx.doi.org/10.1016/S0022-3115(01)00619-5.
[21] C. Carriere, D. Neff, E. Foy, C. Martin, Y. Linard, N. Michau, J. Dynes, P. Dillmann, Influence of iron corrosion on nuclear glass alteration processes: nanoscale investigations of the iron-bearing phases, Corros. Eng. Sci. Technol. 52 (2017) 166–172. doi:10.1080/1478422X.2017.1306962.
[22] H.G. Changela, J.C. Bridges, Alteration assemblages in the nakhlites: Variation with depth on Mars, Meteorit. Planet. Sci. 45 (2010) 1847–1867.
[23] R. Mosser-Ruck, M. Cathelineau, D. Guillaume, D. Charpentier, D. Rousset, O. Barres, N. Michau, Effects of temperature, pH, and iron/clay and liquid/clay ratios on experimental conversion of dioctahedral smectite to berthierine, chlorite, vermiculite, or saponite, Clays Clay Miner. 58 (2010) 280–291.
[24] M. Perronnet, M. Jullien, F. Villiéras, J. Raynal, D. Bonnin, G. Bruno, Evidence of a critical content in Fe (0) on FoCa7 bentonite reactivity at 80 C, Appl. Clay Sci. 38 (2008) 187–202. [25] L. Zhao, H. Dong, R. Kukkadapu, A. Agrawal, D. Liu, J. Zhang, R.E. Edelmann, Biological
oxidation of Fe(II) in reduced nontronite coupled with nitrate reduction by Pseudogulbenkiania sp. Strain 2002, Geochim. Cosmochim. Acta. 119 (2013) 231–247. doi:https://doi.org/10.1016/j.gca.2013.05.033.
[26] M.L. Schlegel, C. Bataillon, K. Benhamida, C. Blanc, D. Menut, J.-L. Lacour, Metal corrosion and argillite transformation at the water-saturated, high-temperature iron–clay interface: A microscopic-scale study, Appl. Geochemistry. 23 (2008) 2619–2633.
[27] A. Michelin, E. Burger, D. Rebiscoul, D. Neff, F. Bruguier, E. Drouet, P. Dillmann, S. Gin, Silicate glass alteration enhanced by iron: origin and long-term implications, Environ. Sci. Technol. 47 (2012) 750–756.
[28] A. Michelin, E. Leroy, D. Neff, J. Dynes, P. Dillmann, S. Gin, Archeological slag from Glinet: An example of silicate glass altered in ananoxic iron-rich environment, Chem. Geol. 41 (2015) 28– 43.
[29] C. Rivard, E. Montargès-Pelletier, D. Vantelon, M. Pelletier, C. Karunakaran, L.J. Michot, F. Villieras, N. Michau, Combination of multi-scale and multi-edge X-ray spectroscopy for investigating the products obtained from the interaction between kaolinite and metallic iron in anoxic conditions at 90 °C, Phys. Chem. Miner. 40 (2013) 115–132.
doi:10.1007/s00269-012-0552-6.
[30] I. Pignatelli, F. Bourdelle, D. Bartier, R. Mosser-Ruck, L. Truche, E. Mugnaioli, N. Michau, Iron– clay interactions: Detailed study of the mineralogical transformation of claystone with emphasis on the formation of iron-rich T–O phyllosilicates in a step-by-step cooling experiment from 90° C to 40° C, Chem. Geol. 387 (2014) 1–11.
[31] Y. Linard, C. Martin, M. Schlegel, P. Jollivet, MVE – “Rate Drop” experiment: progress report on an in situ glass dissolution test at the Andra’s URL., 2015. doi:10.13140/RG.2.1.3632.9842. [32] Y. Leon, M. Saheb, E. Drouet, D. Neff, E. Foy, E. Leroy, J.J. Dynes, P. Dillmann, Interfacial layer
on archaeological mild steel corroded in carbonated anoxic environments studied with coupled micro and nano probes, Corros. Sci. 88 (2014) 23–35. doi:10.1016/j.corsci.2014.07.005.
[33] D. Cabaret, P. Sainctavit, P. Ildefonse, A.-M. Flank, Full multiple scattering calculations of the X-ray absorption near edge structure at the magnesium K-edge in pyroxene, Am. Mineral. 83 (1998) 300–304.
[34] D. Cabaret, M. Le Grand, A. Ramos, A.-M. Flank, S. Rossano, L. Galoisy, G. Calas, D. Ghaleb, Medium range structure of borosilicate glasses from Si K-edge XANES: a combined approach based on multiple scattering and molecular dynamics calculations, J. Non. Cryst. Solids. 289 (2001) 1–8.
[35] A. Fontaine, Spectroscopie d’absorption X (EXAFS et XANES) Application du rayonnement synchrotron, Tech. l’ingénieur. (1989).
[36] C. Levelut, D. Cabaret, M. Benoit, P. Jund, A.-M. Flank, Multiple scattering calculations of the XANES Si K-edge in amorphous silica, J. Non. Cryst. Solids. 293 (2001) 100–104.
[37] F. Bourdelle, K. Benzerara, O. Beyssac, J. Cosmidis, D.R. Neuville, G.E. Brown, E. Paineau, Quantification of the ferric/ferrous iron ratio in silicates by scanning transmission X-ray microscopy at the Fe L2,3 edges, Contrib. to Mineral. Petrol. 166 (2013) 423–434. doi:10.1007/s00410-013-0883-4.
[38] J.J. Dynes, T. Tyliszczak, T. Araki, J.R. Lawrence, G.D.W. Swerhone, G.G. Leppard, A.P. Hitchcock, Speciation and Quantitative Mapping of Metal Species in Microbial Biofilms Using Scanning Transmission X-ray Microscopy, Environ. Sci. Technol. 40 (2006) 1556–1565. doi:10.1021/es0513638.
[39] A. Michelin, E. Drouet, E. Foy, J.J. Dynes, D. Neff, P. Dillmann, Investigation at the nanometre scale on the corrosion mechanisms of archaeological ferrous artefacts by STXM, J. Anal. At. Spectrom. 28 (2013) 59–66.
[40] M. Lerotic, C. Jacobsen, T. Schäfer, S. Vogt, Cluster analysis of soft X-ray spectromicroscopy
data, Ultramicroscopy. 100 (2004) 35–57.
doi:http://dx.doi.org/10.1016/j.ultramic.2004.01.008.
[41] E. Giffaut, M. Grivé, P. Blanc, P. Vieillard, E. Colàs, H. Gailhanou, S. Gaboreau, N. Marty, B. Made, L. Duro, Andra thermodynamic database for performance assessment: ThermoChimie, Appl. Geochemistry. 49 (2014) 225–236.
[42] E. Rinnert, C. Carteret, B. Humbert, G. Fragneto-Cusani, J.D.F. Ramsay, A. Delville, J.-L. Robert, I. Bihannic, M. Pelletier, L.J. Michot, Hydration of a Synthetic Clay with Tetrahedral Charges: A Multidisciplinary Experimental and Numerical Study, J. Phys. Chem. B. 109 (2005) 23745–
23759. doi:10.1021/jp050957u.
[43] H.G. Dill, R. Dohrmann, S. Kaufhold, Disseminated and faultbound autohydrothermal ferroan saponite in Late Paleozoic andesites of the Saar-Nahe Basin, SW Germany: Implications for the economic geology of intermediate (sub)volcanic rocks, Appl. Clay Sci. 51 (2011) 226–240. doi:https://doi.org/10.1016/j.clay.2010.11.024.
[44] E.Y. Vernaz, J.L. Dussossoy, Current state of knowledge of nuclear waste glass corrosion mechanisms: the case of R7T7 glass, Appl. Geochemistry. 7 (1992) 13–22.
[45] S. Gin, J.P. Mestre, SON 68 nuclear glass alteration kinetics between pH 7 and pH 11.5, J. Nucl. Mater. 295 (2001) 83–96.
[46] M. Saheb, D. Neff, L. Bellot-Gurlet, P. Dillmann, Raman study of a deuterated iron hydroxycarbonate to assess long-term corrosion mechanisms in anoxic soils, J. Raman Spectrosc. 42 (2011) 1100–1108. doi:10.1002/jrs.2828.
[47] D. Li, G.M. Bancroft, M.E. Fleet, X.H. Feng, Silicon K-edge XANES spectra of silicate minerals, Phys. Chem. Miner. 22 (1995) 115–122. doi:10.1007/bf00202471.
[48] P.A. van Aken, B. Liebscher, V.J. Styrsa, Quantitative determination of iron oxidation states in minerals using Fe L2,3-edge electron energy-loss near-edge structure spectroscopy, Phys. Chem. Miner. 25 (1998) 323–327. doi:10.1007/s002690050122.
[49] A. Michelin, E. Burger, E. Leroy, E. Foy, D. Neff, K. Benzerara, P. Dillmann, S. Gin, Effect of iron metal and siderite on the durability of simulated archeological glassy material, Corros. Sci. 76 (2013) 403–414.
[50] M. Schlegel, C. Bataillon, F. Brucker, C. Blanc, D. Prêt, E. Foy, M. Chorro, Corrosion of metal iron in contact with anoxic clay at 90°C: Characterization of the corrosion products after two years of interaction, Appl. Geochemistry. 51 (2014) 1–14.
[51] Y. Leon, P. Dillmann, D. Neff, M.L. Schlegel, E. Foy, J.J. Dynes, Interfacial layers at a nanometre scale on iron corroded in carbonated anoxic environments, RSC Adv. 7 (2017) 20101–20115. doi:10.1039/C7RA01600J.
[52] M. Saheb, P. Berger, L. Raimbault, D. Neff, P. Dillmann, Investigation of iron long-term corrosion mechanisms in anoxic media using deuterium tracing, J. Nucl. Mater. 423 (2012) 61– 66.
[53] O. Ménard, T. Advocat, J.P. Ambrosi, A. Michard, Behaviour of actinides (Th, U, Np and Pu) and rare earths (La, Ce and Nd) during aqueous leaching of a nuclear glass under geological disposal conditions, Appl. Geochemistry. 13 (1998) 105–126.
[54] S. Rajsiri, B.W. Kempshall, S.M. Schwarz, L. Giannuzzi, FIB damage in silicon: Amorphization or redeposition, Microsc. Microanal. 8 (2002).
[55] L.A. Giannuzzi, R. Geurts, J. Ringnalda, 2 keV Ga+ FIB milling for reducing amorphous damage in silicon, Microsc. Microanal. 11 (2005) 828.
[56] V.C. Farmer, G.S.R. Krishnamurti, P.M. HtJANG, Synthetic allophane and layer-silicate formation in SiO2-Al2O3-FeO-Fe2O3-MgO-H2O systems at 23°C and 89°C in a calcareous environment, Clays Clay Miner. 39 (1991) 561–570.
[58] H. Aréna, N. Godon, D. Rébiscoul, R. Podor, E. Garcès, M. Cabie, J.P. Mestre, Impact of Zn, Mg, Ni and Co elements on glass alteration: Additive effects, J. Nucl. Mater. 470 (2016) 55–67. doi:10.1016/j.jnucmat.2015.11.050.
[59] R.B. Merola, E.D. Fournier, M.M. McGuire, Spectroscopic investigations of Fe2+ complexation on nontronite clay, Langmuir. 23 (2007) 1223–1226.
[60] G. Müller, U. Förstner, Recent iron ore formation in Lake Malawi, Africa, Miner. Depos. 8 (1973) 278–290.
[61] T.G. Cole, The nature and origin of smectite in the Atlantis II Deep, Red Sea, Can. Mineral. 26 (1988) 755–763.
[62] J.L. Bischoff, others, A ferroan nontronite from the Red Sea geothermal system, Clays Clay Miner. 20 (1972) 217–223.
[63] E.T. Degens, D.A. Ross, Hot brines and recent heavy metal deposits in the Red Sea: a geochemical and geophysical account, Springer-Verlag, 2013.
[64] S. Petit, F. Baron, A. Decarreau, Synthesis of nontronite and other Fe-rich smectites: a critical review, Clay Miner. 52 (2017) 469–483.
[65] S. Lantenois, B. Lanson, F. Muller, A. Bauer, M. Jullien, A. Plançon, Experimental study of smectite interaction with metal Fe at low temperature: 1. Smectite destabilization, Clays Clay Miner. 53 (2005) 597–612.
[66] I. Pignatelli, E. Mugnaioli, J. Hybler, R. Mosser-Ruck, M. Cathelineau, N. Michau, A multi-technique characterization of cronstedtite synthesized by iron–clay interaction in a step-by-step cooling procedure, Clays Clay Miner. 61 (2013) 277–289.
[67] J.C. Wilson, S. Benbow, H. Sasamoto, D. Savage, C. Watson, Thermodynamic and fully-coupled reactive transport models of a steel–bentonite interface, Appl. Geochemistry. 61 (2015) 10– 28.
[68] A. Manceau, D. Chateigner, W.P. Gates, Polarized EXAFS, distance-valence least-squares modeling (DVLS), and quantitative texture analysis approaches to the structural refinement of Garfield nontronite, Phys. Chem. Miner. 25 (1998) 347–365. doi:10.1007/s002690050125. [69] A. Manceau, B. Lanson, V.A. Drits, D. Chateigner, W.P. Gates, J. Wu, D. Huo, J.W. Stucki,
Oxidation-reduction mechanism of iron in dioctahedral smectites: I. Crystal chemistry of oxidized reference nontronites, Am. Mineral. 85 (2000) 133–152.
[70] V.C. Farmer, W.J. McHardy, F. Elsass, M. Robert, hk-Ordering in Aluminous Nontronite and Saponite Synthesized Near 90 C: Effects of Synthesis Conditions on Nontronite Composition and Ordering, Clays Clay Miner. 42 (1994) 180–180.
[71] A. Decarreau, D. Bonnin, Synthesis and crystallogenesis at low temperature of Fe (III)-smectites by evolution of coprecipitated gels: experiments in partially reducing conditions, Clay Miner. 21 (1986) 861–877.
[72] G. Schikorr, Über Eisen (II)-hydroxyd und ein ferromagnetisches Eisen (III)-hydroxyd, Zeitschrift Für Anorg. Und Allg. Chemie. 212 (1933) 33–39.
[73] M.S. Odziemkowski, T.T. Schuhmacher, R.W. Gillham, E.J. Reardon, Mechanism of oxide film formation on iron in simulating groundwater solutions: Raman spectroscopic studies, Corros.
Sci. 40 (1998) 371–389. doi:10.1016/S0010-938X(97)00141-8.
[74] R.A. Eggleton, Nontronite topotaxial after hedenbergite, Am. Mineral. 60 (1975) 1063–1068. [75] S. Gin, C. Guittonneau, N. Godon, D. Neff, D. Rebiscoul, M. Cabié, S. Mostefaoui, Nuclear Glass
Durability: New Insight into Alteration Layer Properties, J. Phys. Chem. C. 115 (2011) 18696– 18706. doi:10.1021/jp205477q.
[76] J.-L. Crovisier, T. Advocat, J.-L. Dussossoy, Nature and role of natural alteration gels formed on the surface of ancient volcanic glasses (Natural analogs of waste containment glasses), J. Nucl. Mater. 321 (2003) 91–109. doi:http://dx.doi.org/10.1016/S0022-3115(03)00206-X.
[77] C.C. Cockell, H.G. Changela, C. Bryce, A.J. Brearley, SEM-TEM Study of Icelandic Palagonite: Application to Hydrated Silicate gel Interfaces in the Nakhlite Meteorites and Secondary Processes on Mars., in: Lunar Planet. Sci. Conf., 2014: p. 2890.
[78] S. Gin, Protective effect of the alteration gel: a key mechanism in the long-term behavior of nuclear waste glass, MRS Online Proc. Libr. Arch. 663 (2000).
[79] S. Gin, P. Jollivet, G.B. Rossa, M. Tribet, S. Mougnaud, M. Collin, M. Fournier, E. Cadel, M. Cabie, L. Dupuy, Atom-Probe Tomography, TEM and ToF-SIMS study of borosilicate glass alteration rim: A multiscale approach to investigating rate-limiting mechanisms, Geochim. Cosmochim. Acta. 202 (2017) 57–76.
[80] K. Ferrand, A. Abdelouas, B. Grambow, Water diffusion in the simulated French nuclear waste glass SON 68 contacting silica rich solutions: Experimental and modeling, J. Nucl. Mater. 355 (2006) 54–67.
[81] J.P. Icenhower, C.I. Steefel, Experimentally determined dissolution kinetics of SON68 glass at 90 C over a silica saturation interval: Evidence against a linear rate law, J. Nucl. Mater. 439 (2013) 137–147.
[82] J. Neeway, A. Abdelouas, B. Grambow, S. Schumacher, Dissolution mechanism of the SON68 reference nuclear waste glass: new data in dynamic system in silica saturation conditions, J. Nucl. Mater. 415 (2011) 31–37.
[83] M. Fournier, S. Gin, P. Frugier, Resumption of nuclear glass alteration: State of the art, J. Nucl. Mater. 448 (2014) 348–363. doi:10.1016/j.jnucmat.2014.02.022.
[84] H. Van Olphen, J.-J. Fripiat, Data handbook for clay materials and other non-metallic minerals: providing those involved in clay research and industrial application with sets of authoritative data describing the physical and chemical properties and mineralogical composition of the ava, Pergamon, 1979.