Constraint-Based Navigation
for Safe, Shared Control of Ground Vehicles
by
Sterling J Anderson
Bachelor of Science in Mechanical Engineering Brigham Young University, 2007
Master of Science in Mechanical Engineering Massachusetts Institute of Technology, 2009
Submitted to the
Department of Mechanical Engineering
in partial fulfillment of the requirements for the degree of
Doctor of Philosophy in Mechanical Engineering
at the
Massachusetts Institute of Technology
February, 2013
0 2013 Massachusetts Institute of Technology All rights reserved
~$ CHU0EYS INSTITUTErONrv
Signature of Author
k/Department of Mechanical Engineering December 31, 2012 Certified By
Karl Iagnemma Principal Research Scientist
Th Supervisor
Accepted By
-' PrioAessor David Hardt Chairman, Committee on Graduate Studies
Constraint-Based Navigation
for Safe, Shared Control of Ground Vehicles by
Sterling J Anderson
Submitted to the Department of Mechanical Engineering
on December 31, 2012, in partial fulfillment of the requirements for the degree of Doctor of Philosophy in Mechanical Engineering
Abstract
Human error in machine operation is common and costly. This thesis introduces, develops, and experimentally demonstrates a new paradigm for shared-adaptive control of human-machine systems that mitigates the effects of human error without removing humans from the control loop. Motivated by observed human proclivity toward navigation in fields of safe travel rather than along specific trajectories, the planning and control framework developed in this thesis is rooted in the design and enforcement of constraints rather than the more traditional use of reference paths.
Two constraint-planning methods are introduced. The first uses a constrained Delaunay triangulation of the environment to identify, cumulatively evaluate, and succinctly circumscribe the paths belonging to a particular homotopy with a set of semi-autonomously enforceable constraints on the vehicle's position. The second identifies a desired homotopy by planning - and then laterally expanding - the optimal path that traverses it. Simulated results show both of these constraint-planning methods capable of improving the performance of one or multiple agents traversing an environment with obstacles.
A method for predicting the threat posed to the vehicle given the current driver
action, present state of the environment, and modeled vehicle dynamics is also presented. This threat assessment method, and the shared control approach it facilitates, are shown in simulation to prevent constraint violation or vehicular loss of control with minimal control intervention. Visual and haptic driver feedback mechanisms facilitated by this constraint-based control and threat-based intervention are also introduced.
Finally, a large-scale, repeated measures study is presented to evaluate this control framework's effect on the performance, confidence, and cognitive workload of 20 drivers teleoperating an unmanned ground vehicle through an outdoor obstacle course. In 1,200 trials, the constraint-based framework developed in this thesis is shown to increase vehicle velocity by 26% while reducing the occurrence of collisions by 78%, improving driver reaction time to a secondary task by 8.7%, and increasing overall user confidence and sense of control by 44% and 12%, respectively. These performance improvements were realized with the autonomous controller usurping less than 43% of available vehicle control authority, on average.
Thesis Supervisor: Karl Iagnemma Title: Principal Research Scientist
ACKNOWLEDGEMENTS
I would like to thank Dr. Karl lagnemma for guiding this research. Working with
Karl has felt more like a partnership than a typical advisor-advisee relationship, and I've appreciated the autonomy and confidence that's afforded me immensely.
I would also like to thank Professors John Leonard and Emilio Frazzoli for their
contributions as members of my thesis committee, and all of the guys at Quantum Signal,
LLC, for their help in setting up the experimental vehicle and conducting experiments.
James Walker in particular has been invaluable to this effort. From troubleshooting communication problems to wrangling test drivers and dealing with intems and exploded ice packs, James is a big part of this testing's success. Thanks also to Sisir Karumanchi, Steve Peters, Rob Lupa, Kevin Melotti, Phil Munie, Bryan Johnson, Dan Rice, Victor Perlin, Steve Rohde, Mitch Rohde, and all of the test drivers for their help.
I would also like to thank the United States Army Research Office (contract
W911NF-11-1-0046) and DARPA DSO (contract W911NF-11-C-0101) for providing financial support for this work.
Finally, I would like to thank my family. For everything.
TABLE OF CONTENTS
ACKNOW LEDGEMENTS... 3
TABLE OF CONTENTS... 4
LIST OF FIGURES ...-... 6
CHAPTER 1: INTRODUCTION ... 10
1.1 BACKGROUND AND MOTIVATION... 10
1.2 P REV IO U S W O RK ... 11
1.2. 1 Driver Assistance Systems ... 12
1.2.2 A utonom ous System s ... 16
1.2.3 Shared Control and the Case Against Full Automation ... 17
1.3 PROPOSED APPROACH ... 21
1.4 OUTLINE AND CONTRIBUTIONS OF THIS THESIS ... 24
CHAPTER 2: HOMOTOPY-BASED CONSTRAINT PLANNING ... 26
2 .1 PA TH H O M O TO PIES ... . -... ... 27
2.1.1 Traditional Uses of Homotopy Relations in Path Planning ... 28
2.1.2 Proposed Use of Path Homotopies in Constraint-Based Vehicle Control... 29
2.2 CONSTRAINT DESIGN WITH DELAUNAY TRIANGULATION ... 29
2.2.1 Homotopy Identification ... 33
2.2.2 Homotopy Evaluation ... 36
2.2.3 Constraint-Based Navigation with Multiple Agents ... 46
2.3 CONSTRAINT DESIGN WITH PATHS... 55
2.3.1 State Reduction via Ackermann Point Transformation ... 55
2.3.2 Consideration of Driving Objectives and Environmental Disturbances ... 58
2.3.3 Simulated Traversal of an Optimal Homotopy ... 61
2 .4 C O N C LU SIO N S ... 7 1 CHAPTER 3: THREAT-BASED CONSTRAINT ENFORCEMENT ... 72
3 .1 IN TRO D U CTIO N ... 72
3.2 MODEL-BASED THREAT ASSESSMENT ... 72
3.2.1 Model Predictive Control ... 73
3.2 .2 V eh icle M od el ... 76
3.2.3 Threat Assessment... 79
3.3 THREAT-BASED SHARED AUTONOMY... 80
3.4 D RIVER FEEDBACK... 83
3.4. 1 Visual ... 84
3.4.2 H aptic... 84
3.5 SIM ULATION STUDY ... 86
3.5.1 Setup... 86
3.5.2 Results... 88
3.5.3 Conclusions... 92
CHAPTER 4: EXPERIMENTAL USER STUDIES... 93
4.1 INTRODUCTION ... 93
4.2 SETUP ... 94
4.2.1 Vehicle... 94
4.2.2 Operator Control Unit and User Interface... 97
4.2.3 Course Setup & Operator Tasks ... 99
4.2.4 Test D rivers and Incentive Structure ... 101
4.2.5 Q ualitative Surveys and User Confidence ... 103
4.2.6 Training and Test Schedule ... 105
4.2.7 Hypotheses ... 106
4.3 RESULTS... 107
4.3. 1 Navigation Perform ance ... 109
4.3.2 User Confidence... 116
4.3.3 Learning and Trust Effects ... 119
4.4 CONCLUSION ... 133
C H A PTER 5: C O N C LU SIO N S... 135
5.1 CONTRIBUTIONS OF THIS THESIS ... 135
5.2 FUTURE W ORK ... 136
R EFER EN C ES... 138
APPENDIX A: ADAMS MODEL PARAMETERS ... 148
APPENDIX B: UTILITY VEHICLE PARAMETERS... 150
APPENDIX C: DETAILED USER STUDY RESULTS ... 152
APPENDIX D: REACHABLE SETS AND DISCRETIZATION ... 154
LIST OF FIGURES
FIGURE 1.1. ILLUSTRATION OF TIME- AND ACCELERATION-BASED THREAT ASSESSMENT METRICS ... 14
FIGURE 1.2. ILLUSTRATION OF STEERING (BLUE DASHED), AND BRAKING (GREEN SOLID) MANEUVERS COMMONLY ASSUMED BY THREAT ASSESSMENT METHODS AND THE MORE REALISTIC (BLACK) MANEUVER REQUIRED TO AVOID OBSTACLES C AND B. ... 15
FIGURE 1.3. ILLUSTRATION OF THE CLOSED-LOOP RRT MOTION PLANNER SHOWING MOTION CONTROL POINTS (BLUE), INFEASIBLE PATHS (RED), AND FEASIBLE PATHS (GREEN) ... 17
FIGURE 1.4. ILLUSTRATION OF THE LEVEL OF AUTONOMY AND SAFETY CONTRIBUTION OF TODAY'S DRIVER ASSISTANCE SYSTEMS (RED), PROPOSED AUTONOMOUS SYSTEMS (BLUE), EXISTING SHARED CONTROL SYSTEMS (DARK GRAY) AND THE UNREALIZED POTENTIAL OF ADAPTIVELY AUTONOMOUS SYSTEMS (L IG H T G R A Y )... 19
FIGURE 1.5. ILLUSTRATION OF PROMINENT HOMOTOPIES AS THEY MIGHT BE PERCEIVED BY THE HUMAN D R IV ER ...- ... ---... ....-... 22
FIGURE 1.6. VISUALIZATION OF PROMINENT HOMOTOPIES AVAILABLE TO A HUMAN OPERATOR (IMAGE BEST V IEW ED IN C O LO R)...----. ----... --... 23
FIGURE 1.7. BLOCK DIAGRAM OF A CONSTRAINT-BASED, SHARED CONTROL SYSTEM ... 24
FIGURE 2.1. ILLUSTRATION OF A "FIELD OF SAFE TRAVEL" AS ENVISIONED BY [62] ... 26
FIGURE 2.2. VORONOI DIAGRAM FOR A SET OF POINTS, P, WITH CELLS R, SHADED ... 30
FIGURE 2.3. GENERALIZED VORONOI DIAGRAM IN AN ENVIRONMENT WITH OBSTACLES ... 31
FIGURE 2.4. DELAUNAY TRIANGULATION FOR A SET OF POINTS, P, WITH DELAUNAY TRIANGLES SHADED... 32
FIGURE 2.5. GENERALIZED VORONOI DIAGRAM (THIN BLACK LINES) AND CORRESPONDING CONSTRAINED DELAUNAY TRIANGULATION (BLUE) OF AN ENVIRONMENT WITH OBSTACLES (BLACK RECTANGLES).. 33
FIGURE 2.6. ILLUSTRATION OF TRIANGULATED ENVIRONMENT HIGHLIGHTING ONE OF ITS HOMOTOPIES ... 36
FIGURE 2.7. TRIANGULATED ENVIRONMENT ILLUSTRATING THE RELATIONSHIP BETWEEN THE MEDIAL PATH HEURISTIC USED TO ESTIMATE HOMOTOPY LENGTH AND THE VORONoI DIAGRAM ... 37
FIGURE 2.8. ILLUSTRATION OF A TRIANGULATED HOMOTOPY AND THE HEURISTICS USED TO DESCRIBE ITS CONSTRAINT RESTRICTIVENESS AND DYNAMIC FEASIBILITY ... 39
FIGURE 2.9. ILLUSTRATION OF EFFECTIVE TARGET SETS AS EDGES OF CONSTRAINED DELAUNAY TRIA N G U LA TIO N ... 40
FIGURE 2.10. ILLUSTRATION SHOWING A) TRIANGULARIZED ENVIRONMENT WITH OBSTACLES (GRAY AND BLACK), AND B) AVOIDANCE ACCELERATION MAPPED TO STEERING COMMANDS (WITH GRAY AND BLACK BLOCKS CORRESPONDING TO OBSTACLES IN (A)... 43
FIGURE 2.11. DIAGRAM OF A VEHICLE WITH DETECTION SHELL Rs, NORMAL VECTOR TO NEAREST OBSTACLE (N) AND CORRESPONDING CONTROL FORCES ... 48
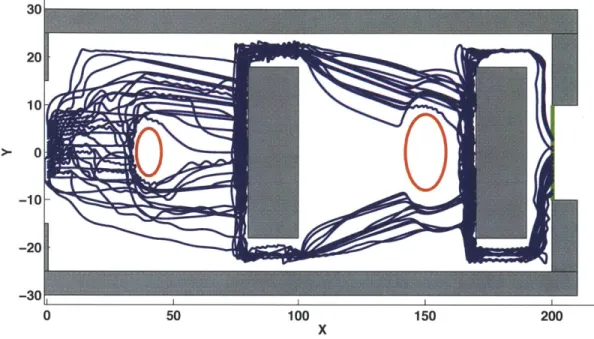
FIGURE 2.12. SIMULATION RESULTS SHOWING TRACES OF THE PATHS TAKEN BY 30 VEHICLES WITHOUT
CORRIDOR PLANNING CAPABILITY ... 51
FIGURE 2.13. SIMULATION RESULTS SHOWING TRACES OF THE PATHS TAKEN BY 30 VEHICLES WITH CORRIDOR PLANNING CAPABILITY ... 52
FIGURE 2.14. COURSE COMPLETION TIME FOR CONTROLLERS WITH AND WITHOUT A HOMOTOPY REFERENCE ... 5 3 FIGURE 2.15. ILLUSTRATION OF A "HEAD-ON" COLLISION INCIDENT... 54
FIGURE 2.16. PERCENT OF TOTAL COURSE TIME SPENT AVOIDING HEAD-ON COLLISION FOR CONTROLLERS WITH AND WITHOUT A HOMOTOPY REFERENCE... 55
FIGURE 2.17. ILLUSTRATION OF VEHICLE MODEL USED IN CONSTRAINT PLANNING ... 56
FIGURE 2.18. ILLUSTRATION OF SLOPED ROAD SHOULDER AND ASSOCIATED PARAMETERS ... 61
FIGURE 2.19. ILLUSTRATION OF DP-GENERATED COST SURFACE, PATH, AND CONSTRAINT PLAN... 63
FIGURE 2.20. ILLUSTRATION OF OBJECTIVE FUNCTION COST IN THE STATE CUBE ... 64
FIGURE 2.21. SNAPSHOT OF AN OBSTACLE AVOIDANCE SIMULATION (OBSTACLES STATIONARY)... 65
FIGURE 2.22. SNAPSHOT OF A SIMULATION WITH PENALTIES APPLIED FOR DEVIATION INTO AN ONCOMING L A N E ... 6 6 FIGURE 2.23. SNAPSHOT OF A SIMULATION WITH PENALTIES APPLIED FOR DEVIATION INTO AN ONCOMING L A N E ... 6 8 FIGURE 2.24. SNAPSHOTS OF A SIMULATION WITH MOVING OBSTACLES ... 70
FIGURE 2.25. SIMULATION OF A VEHICLE TRAVELING NEAR A (500) SLOPED SHOULDER ... 71
FIGURE 3.1. M ODEL PREDICTIVE CONTROL ILLUSTRATION ... 73
FIGURE 3.2. ILLUSTRATION OF VEHICLE MODEL USED IN MPC CONTROLLER ... 77
FIGURE 3.3. TIRE CORNERING STIFFNESS DEFINITION AND APPROXIMATION... 78
FIGURE 3.4. OBSTACLE AVOIDANCE SCENARIO ILLUSTRATING LOW- (1) AND HIGH- (2) THREAT PREDICTIONS REQUIRED TO REMAIN WITHIN THE SAFE HOMOTOPY (OUTLINED BY DASHED LINES) ... 81
FIGURE 3.5. GENERAL FORM OF CONTROL ALLOCATION SCHEMES... 83
FIGURE 3.6. ILLUSTRATION OF THE OPERATOR CONTROL INTERFACE SHOWING THE HOMOTOPY OVERLAY (GREEN) AND STEERING INDICATORS (RED AND CYAN LINES AT BOTTOM CENTER) ... 84
FIGURE 3.7. SCENARIO ILLUSTRATION SHOWING THE RESPONSE OF THE RESTORING TORQUE FUNCTION AS A VEHICLE SUCCESSIVELY APPROACHES A HAZARD FROM BEHIND ... 86
FIGURE 3.8. ILLUSTRATION OF PURE PURSUIT DRIVER MODEL ... 87
FIGURE 3.9. BLOCK DIAGRAM OF SHARED CONTROL SYSTEM WITH A PURE-PURSUIT DRIVER MODEL TRACKING A PREDEFINED REFERENCE, Y ps ... 88
FIGURE 3.10. SIMULATION RESULTS DEMONSTRATING CONSTRAINT-BASED SHARED AUTONOMY THROUGH A N O BSTA C LE FIELD ... 89
FIGURE 3.11. SIMULATION RESULTS DEMONSTRATING CONSTRAINT-BASED SHARED AUTONOMY THROUGH A N O B STA C LE FIELD ... 90
FIGURE 3.12. SIMULATION RESULTS COMPARING THE PERFORMANCE OF AN UNASSISTED DRIVER (SIMULATED BY A PURE-PURSUIT CONTROLLER) WITH THE PERFORMANCE OF THAT SAME DRIVER IN THE PRESENCE
OF COMMUNICATION LATENCY AND WITH THE ASSISTANCE OF A CONSTRAINT-BASED CONTROLLER .. 91
FIGURE 4.1. EXPERIM ENTAL PLATFORM ... 95
FIGURE 4.2. SENSING AND CONTROL ARCHITECTURE ... 96
FIGURE 4.3. LIDAR, GPS, AND COMMUNICATION ANTENNAE... 97
FIGURE 4.4. O PERATOR CONTROL UNIT ... 98
FIGURE 4.5. OPERATOR CONTROL UNIT INTERFACE WITH (A) AND WITHOUT (B) DRIVER FEEDBACK ... 99
FIGURE 4.6. PICTURE OF TEST ENVIRONMENT ... 100
FIGURE 4.7. SECONDARY MONITORING TASK BUTTON STATES... 101
FIGURE 4.8. TEST DRIVER COM POSITION ... . ---... 102
FIGURE 4.9. SUBSET OF THE POST-TRIAL QUESTIONNAIRE PERTAINING TO "UNASSISTED" CONTROL C O N FIG U RA TIO N ... 104
FIGURE 4.10. FEEDBACK MODALITY QUESTIONS AND OPTIONAL, FREE-FORM FEEDBACK QUESTIONS PROVIDED AT THE END OF EACH DAY'S SURVEY ... 105
FIGURE 4.11. EXPERIMENTAL SEQUENCE AND ORDERING ...---... ... 106
FIGURE 4.12. PLOT OF A TYPICAL RUN SHOWING LEVEL OF INTERVENTION AND ITS EFFECT ON THE STEERING AN G LE SEEN BY THE V EHICLE ... 108
FIGURE 4.13. EFFECT OF SHARED CONTROL AND DRIVER FEEDBACK ON THE COLLISION FREQUENCY, BRUSH FREQUENCY, AVERAGE VELOCITY, AND COURSE COMPLETION TIME OF STUDY PARTICIPANTS... 110
FIGURE 4.14. EFFECT OF SHARED CONTROL AND DRIVER FEEDBACK ON THE DRIVER AND VEHICLE STEER V O LA T IL IT Y ... 111
FIGURE 4.15. RECEIVER OPERATING CHARACTERISTIC FOR EACH SYSTEM CONFIGURATION ... 112
FIGURE 4.16. SECONDARY TASK REACTION TIME (MEAN AND STANDARD ERROR) BY CONFIGURATION TYPE ... 1 1 2 FIGURE 4.17. AVERAGE PREDICTED THREAT (MEAN AND STANDARD ERROR) BY CONFIGURATION TYPE... 113
FIGURE 4.18. OVERALL DRIVER PERFORMANCE SCORE (MEAN AND STANDARD ERROR) BY CONFIGURATION T Y P E ... 1 14 FIGURE 4.19. MEAN AND STANDARD ERROR OF SUBJECTIVE MEASURES OF OPERATOR CONFIDENCE ... 117
FIGURE 4.20. USER IMPRESSIONS OF THE HELPFULNESS OF VISUAL AND HAPTIC FEEDBACK MODALITIES AS REPORTED IN POST-TRIAL SURVEYS ... 119
FIGURE 4.21. EFFECT OF EXPERIENCE ON AVERAGE VELOCITY FOR THE FOUR CONTROL/FEEDBACK C O N FIG U RA T IO N S...120
FIGURE 4.22. EFFECT OF EXPERIENCE ON AVERAGE DRIVER STEER VOLATILITY FOR THE FOUR CONTROL/FEEDBACK CONFIGURATIONS-.. ---... ... 121
FIGURE 4.23. EFFECT OF EXPERIENCE ON AVERAGE COURSE COMPLETION TIME FOR THE FOUR CONTROL/FEEDBACK CONFIGURATIONS.... --... ... 122
FIGURE 4.24. EFFECT OF EXPERIENCE ON AVERAGE COLLISION RATE FOR THE FOUR CONTROL/FEEDBACK CO N FIG U RA TIO N S... 12 3
FIGURE 4.25. EFFECT OF EXPERIENCE ON AVERAGE DRIVER SCORE FOR THE FOUR CONTROL/FEEDBACK CO N FIG U RA TIO N S... 124 FIGURE 4.26. TRENDS IN OPERATOR SENTIMENT ABOUT EACH CONTROL CONFIGURATION AS IT AFFECTED THE EASE OF THE NAVIGATION TASK ... 125 FIGURE 4.27. TRENDS IN OPERATOR SENTIMENT ABOUT EACH CONTROL CONFIGURATION AS IT AFFECTED
THEIR SENSE OF CONTROL OVER THE VEHICLE'S BEHAVIOR ... 126
FIGURE 4.28. TRENDS IN OPERATOR SENTIMENT ABOUT EACH CONTROL CONFIGURATION AS IT AFFECTED THE SPEED AT WHICH THE OPERATOR FELT COMFORTABLE TRAVELING ... 127
FIGURE 4.29. TRENDS IN OPERATOR CONFIDENCE THAT THE COMBINED SYSTEM WOULD "DO THE RIGHT THING" BROKEN DOWN BY CONTROL CONFIGURATIONS ... 128
FIGURE 4.30. CORRELATIONS BETWEEN THE OPERATOR'S CONFIDENCE THAT THE VEHICLE WOULD "DO THE RIGHT THING" AND MEASURED PERFORMANCE (MEAN AND STANDARD ERROR FOR ROUNDS 2 & 3).
METRICS PLOTTED IN RED CORRESPOND TO THE SECONDARY Y-AXIS. ... 129
FIGURE 4.31. OPERATOR-REPORTED EASE OF NAVIGATION VS. MEASURED PERFORMANCE (MEANS AND
STANDARD ERRORS FOR ROUNDS 2 & 3). METRICS PLOTTED IN RED CORRESPOND TO THE SECONDARY Y -A X IS ... 13 0
FIGURE 4.32. OPERATOR-PERCEIVED SENSE OF CONTROL VS. MEASURED PERFORMANCE (MEANS AND
STANDARD ERRORS FOR ROUNDS 2 & 3). METRICS PLOTTED IN RED CORRESPOND TO THE SECONDARY Y -A X IS ... 13 1 FIGURE 4.33. OPERATOR-REPORTED COMFORTABLE SPEED OF TRAVEL VS. MEASURED PERFORMANCE (MEANS
AND STANDARD ERRORS FOR ROUNDS 2 & 3). METRICS PLOTTED IN RED CORRESPOND TO THE
SECO N D A RY Y -A X IS ... 132 FIGURE 4.34. AVERAGE SENTIMENT OF OPERATOR SURVEY RESPONSES VS. MEASURED PERFORMANCE
(MEANS AND STANDARD ERRORS FOR ALL ROUNDS). METRICS PLOTTED IN RED CORRESPOND TO THE SECO N D A RY Y -A X IS ... 133
9 List of FiguresList of Figures
1
CHAPTER
1:
INTRODUCTION1.1
BACKGROUND AND MOTIVATIONHumans make mistakes. When humans control dynamic systems, the rate and ramifications of those mistakes increase. Whether it occurs while driving a car, flying an airplane, teleoperating an unmanned vehicle, controlling industrial machinery, or manipulating medical devices, human error can lead to costly and often deadly consequences. In 2010, over 32,000 people were killed and another 2.2 million injured in motor vehicle accidents in the United States alone [1]. During Operation Iraqi Freedom
(2003 - 2011), vehicle crashes killed more than twice as many service members as the
next leading cause of non-combat fatalities [2]. Even the manufacturing sector is susceptible to human error; forklift operation alone is estimated to claim 100 lives and cause 94,500 injuries each year in the United States [3].
Perhaps nowhere is the effect of human error more evident than in teleoperated systems. Operators of Unmanned Ground Vehicles (UGVs) and Unmanned Aerial Vehicles (UAVs) must not only cope with the challenges inherent to manned navigation, but must also perform many of its same functions with a restricted field of view, limited depth perception, potentially disorienting camera viewpoints, and significant time delays [4]. Remotely operating a vehicle under these conditions while monitoring the vehicle's health status, its task completion, and the condition of the environment is challenging and prone to high failure rates - even for trained operators. In studies conducted to date, the average mean time between UGV failure ranges from six to twenty hours - implying that in their present state, many of today's UGVs cannot complete even one standard (12-20
hour) shift without experiencing a mechanical failure or human/controller-caused accident [5]. In UAVs, the mishap rate is estimated at 12-100 times greater than that of their manned counterparts, with 71% of collisions attributed to human error [6], [7].
Roughly categorized, human error is caused by deficiencies in recognition, decision, or performance [8]. Recognition errors result from a human's inability to properly perceive or comprehend a situation. Common causes of recognition errors include inattention, inadequate surveillance, and internal or external distractions, among others. Decision errors arise when a human takes an improper course of action or fails to act when action is necessary. In ground vehicle applications, these errors are typically made when the human drives the vehicle faster or more aggressively than the circumstances (vehicle, environment, etc.) allow. Finally, performance errors refer to miscalculations in low-level control functions, often due to insufficient reaction time. Drivers of ground vehicles often make these errors by overcompensating or applying improper directional control. In a nationally representative sample of 5,471 crashes conducted from 2005 to 2007, the United States National Highway Traffic Safety Administration (NHTSA) attributed roughly 41 percent of vehicle crashes to recognition errors, 34 percent to decision errors, and 10 percent to performance errors [9]. While insufficient training and challenging scenarios or environments can exacerbate each of these error types, the human-machine control allocation and methods can also significantly affect the combined system's ability to respond quickly and appropriately to safety imperatives [10].
In this thesis, we address the challenge of reducing the frequency and effects of human error via shared-adaptive control. While the implementation presented in this thesis is designed specifically for manned and unmanned ground vehicles, the framework that results is also relevant, and can be adapted to, human-machine systems generally.
1.2
PREVIOUS WORKIn recent years, improvements in sensing, control, and computation capabilities have facilitated the development of driver assistance, autonomous, and shared-adaptive control systems designed to aid, replace, or correct human operator and thereby reduce or eliminate the effect of human error [11]-[13]. While distinct in their intended outcomes,
the inability of these systems to effectively share control with a human driver or capitalize on human-machine synergies has its root in a common, basic building block: each assumes the presence of a single path that the vehicle should follow. Regardless of the planning method used to obtain it (sampling, graph searches, potential fields, etc.) [14]-[16] or the control method employed to track it (PID schemes, linear-quadratic regulators, nonlinear fuzzy controllers, model predictive controllers, etc.) [17]-[20], this path identifies, evaluates, and seeks to limit the vehicle to just one of the many trajectory options available to the human operator. The subsections that follow describe how three broad categories of modem vehicle control architectures use these paths and how this usage affects their ability to effectively aid the human driver.
1.2.1 DRIVER ASSISTANCE SYSTEMS
In recent years, the focus of vehicle safety has shifted from measures designed to reduce the effects of collisions on vehicle occupants (eg. seat belts, air bags, roll cages, and crumple zones) to driver assistance systems designed to prevent those collisions from happening altogether. Driver assistance systems generally fall into one of two categories:
reactive safety systems such as antilock brakes, traction controllers, electronic stability
controllers, and lane-assist systems monitor the current state of the vehicle and apply low-level control actions to meet some safety-critical criteria. For example, stability controllers monitor the lateral acceleration, yaw, and wheel rotational speeds, and apply asymmetric torques to the wheels when estimated lateral or longitudinal tire slip exceeds a prespecified threshold. In order to avoid collisions, these systems rely on the human's ability to 1) foresee, 2) judge, and 3) respond appropriately to impending hazards to trigger intervention. This reliance on driver actions renders reactive safety systems vulnerable to human recognition and decision errors; for drivers who do not recognize and correctly respond to hazards, these systems can do very little. As estimated in NHTSA's study these errors make up a sizable portion (~75%) of vehicle accidents [9], [21].
Predictive safety systems, on the other hand, consider not only the current state of
the ego vehicle, but also the predicted state evolution of the vehicle and environmental hazards through a finite preview horizon. These systems then preemptively assist the
driver in identifying, assessing the threat posed by, and in some cases avoiding an impending hazard. Recent work in predictive safety has resulted in systems that use audible warnings [22], haptic alerts [23], [24] and steering torque overlays [25] to help the driver avoid collisions [26]-[28], instability [29], or lane departure [12], [30].
In contrast to the strategic planning of a human driver that inherently considers multiple hazards, active safety systems take a more tactical approach, seeking only to avoid the most imminent threat. To estimate which of many possible scenarios (i.e. lane/road departure, frontal collision, loss of control, etc.) is most imminent and determine the appropriate type and degree of driver assistance, active safety systems use various threat assessment metrics. Threat metrics described in the literature predominantly use time-, distance-, and acceleration-based measures [31]-[38]. Time-based threat measures project time to collision (TTC) Time-based on current speeds, positions, trajectories, and (in some formulations) other vehicle states [32]-[34]. Distance-based metrics are generally calculated using prevailing range and vehicle speeds and employ constant velocity/acceleration assumptions and simple hazard geometry [36], [37]. Acceleration-based metrics assess the threat of a given maneuver based on the minimum (and often assumed constant) lateral or longitudinal acceleration that a simple avoidance maneuver would require, given the current position, velocity, and acceleration of both host and hazard [31], [35]. Figure 1.1 illustrates the threat that might be assessed by time-and acceleration-based measures in a scenario with moving hazards.
13 Chapter 1: Jntroduction
w
Figure 1.1. Illustration of time- and acceleration-based threat assessment metrics
While these threat metrics have been shown to provide useful estimates of the danger posed by a simple maneuver, they are not well suited to consider multiple hazards, complex vehicle dynamics, or complicated environmental geometry with its attendant constraints. The geometrically-simple (straight-line or constant-radius-curve) avoidance maneuvers they assume may also misestimate the true threat posed by scenarios in which the physically-achievable vehicle trajectory would require a curve of varying radii or non-constant velocity/acceleration, such as cases in which a lane boundary requires that the trajectory straighten out after passing an obstacle.
The threat-assessment method presented in [31] illustrates common deficiencies in existing approaches. This method estimates the lateral acceleration required to avoid a
single obstacle via a constant radius evasive maneuver given the host vehicle's current position, velocity, and heading, and compares this value to the longitudinal acceleration required to avoid the obstacle by braking. When either of these threat metrics reaches a predefined threshold, corresponding countermeasures may be implemented to assist the human driver. As Figure 1.2 illustrates, this approach's failure to consider 1) the driver's
intended maneuver, and 2) the effect of present evasive actions on future threat scenarios can make its threat assessment inaccurate. For example, a driver assistance system seeking to prevent a rear-end collision with obstacle C might assess threat based on a leftward passing maneuver while the human or a more strategic controller might instead
choose to stop or pass on the right. In addition to this threat assessment ambiguity, the simplified geometry of the assumed lateral avoidance maneuver (blue dashed arc of Figure 1.2) fails to consider both the lateral acceleration required to straighten out in the opposing lane as well as the vehicle's ability to successfully complete the passing maneuver before colliding with Obstacle B (illustrated by black solid line).
Figure 1.2. Illustration of steering (blue dashed), and braking (green solid) maneuvers commonly assumed by threat assessment methods and the more realistic
(black) maneuver required to avoid Obstacles C and B.
The local focus of existing active safety systems, together with the inherent difficulty of assimilating distinct sources of threat into a single, actionable metric has led to solutions that operate purely or primarily in one dimension. Whether governing longitudinal dynamics (traction controllers, anti-lock braking systems, or adaptive cruise controllers), monitoring lateral dynamics (lane-assist systems), or assisting in stability control (yaw/roll stability controllers), these systems largely fail to consider threats from a holistic or integrated perspective. Consequently, when placed on the same vehicle, their warnings and/or control inputs can be suboptimal at best or contradictory at worst.
15 Chapter 1: Introduction
1.2.2 AUTONOMOUS SYSTEMS
Made possible in recent years by developments in onboard sensing, lane detection, obstacle recognition, and drive-by-wire capabilities, and promoted by competitions such as the DARPA grand challenge, autonomous planning and control frameworks for ground vehicle navigation seek to control a vehicle without requiring - or generally accepting - inputs from the human operator. The typical architecture for these systems consists of a perception layer, a strategic motion planning layer, and a tactical execution layer [39]. The perception layer commonly uses a combination of onboard sensors, such as radar, LIDAR, and camera-based feedback to identify, localize, and predict the motion of environmental hazards such as road edges and collision threats [40]. Within the workspace thus mapped by the perception layer, the motion planner designs a hazard-free trajectory to a desired goal or waypoint using any of several motion planning techniques configured to satisfy vehicular task requirements. Common methods used to design these paths include sampling, graph search, and potential fields [14]-[16]. The paths that result from the motion planning layer are often geometric in nature, and do not consider the dynamic or kinematic constraints of the vehicle. As such, tactical re-planning is typically performed at a lower, execution layer to locally "smooth" or convert the path plan into a control reference compatible with the vehicle's kinematic and dynamic constraints [11], [41]-[43]. This control reference is then tracked using any of a number of low-level controllers [17]-[19]. When model-based methods such as Model Predictive Control (MPC) or closed-loop RRT are used, replanning and control are performed in the same calculation [44]-[47]. In [48], for example, the authors use a model-based, finite-horizon constrained optimal controller to simultaneously generate and track an optimal trajectory that satisfies lane constraints and control limitations.
MIT's DARPA Urban Challenge vehicle illustrates the path-based hierarchy many of today's autonomous systems [11]. As shown in Figure 1.3, its RRT-based motion planner samples potential branches from feasible regions of the drivability map generated from onboard sensing. The motion planner then generates kinodynamically feasible trajectories to each of this tree's nodes by forward-simulating the vehicle's dynamics assuming pure-pursuit steering and proportional-integral (PI) speed control.
Finally, it checks the resulting path against the drivability map and uses these same controllers to track the trajectory generated in simulation.
Figure 1.3. Illustration of the closed-loop RRT motion planner showing motion control points (blue), infeasible paths (red), and feasible paths (green)
While many variations of path-based planning and control have proven effective in autonomous implementation, their inability to account for the planning preferences and control inputs of a human operator in either stage of the navigation task make them ill-suited for human-in-the-loop or "semi-autonomous" control. Incorporating a human into the control loop, particularly when the vehicle command was designed to track a specific reference trajectory, is non-trivial. Without contingencies in the trajectory plan specifically accounting for the alternative goals implied by the human driver, the control inputs s/he provides, or the threat those inputs pose to the vehicle, path-based planning and control methods designed for autonomous implementation are not suitable for semi-autonomous operation.
1.2.3 SHARED CONTROL AND THE CASE AGAINST FULL AUTOMATION
Despite the frequent occurrence and significant socioeconomic costs of human error, and the promise of fully autonomous systems, humans will continue to control
i I
Chapter 1: Introduction 17
dynamic systems for the foreseeable future. Their superior judgment and robust reasoning capabilities, together with high automation costs and powerful social pressures create a compelling need for humans to remain "in the loop". Complete automation often requires expensive and coordinated infrastructural changes such as the re-tooling of production facilities, the re-working of highways and traffic management systems, and redrafting of legislation to accommodate a fundamentally new definition of liability. While these changes are in some cases feasible, the social acceptance hurdles that must be surmounted to achieve complete automation may not be quite so tractable. Automating traditionally human-controlled tasks eliminates jobs. On this premise alone, labor unions such as the National Air Traffic Controllers Association have fiercely opposed the introduction of even low-level automation [49], with other groups such as transportation and manufacturing unions sure to follow suit in the advent of a credible automation threat.
Perhaps more compelling than practical arguments against full automation of traditionally human-controlled machines is the prospect of improved semi-autonomous performance through the exploitation of human-automation synergies. As originally published in 1951 [50] and widely discussed since [51], humans and automation are uniquely well suited to specific types of tasks [52], [53]. Whereas automation excels at responding quickly and precisely to well-defined or repetitive control objectives, humans tend to make more mistakes as the frequency and complexity of the control task increase. Conversely, humans have the unique ability to detect and contextualize patterns and new information, reason inductively, and adapt to new modes of operation, whereas automation typically struggles at these tasks. The goal of semi-autonomy or "shared-adaptive" control is to exploit these synergies in the abilities of both humans and automation to improve planning and control performance of the combined system and
-where possible - the actors therein [54]. To be effective, shared-adaptive systems should provide intuitive, intention-preserving assistance without increasing the human's mental workload, over-restricting the human's control freedom, reducing vigilance, or inducing a false sense of security [52], [55], [56].
Figure 1.4 illustrates the autonomy chasm that exists between the minimal level of decision-making and control required by today's driver assistance systems (described in
Section 1.2.1) and the complete control required by fully autonomous systems (detailed in Section 1.2.2). Shared-adaptive, or "adaptively autonomous" control systems have the potential to bridge this gap, replacing active driver assistance, passive driver assistance, and autonomous vehicular control with a single assistance strategy that adapts its level of autonomy (and corresponding safety contribution) as circumstances require.
j4
Safety
Contribution
Ariver
Assistance
chasm
AutonomousControl
Level of
Autonomy
Figure 1.4. Illustration of the level of autonomy and safety contribution of today's driver assistance systems (red), proposed autonomous systems (blue), existing
shared control systems (dark gray) and the unrealized potential of adaptively autonomous systems (light gray)
Similar to autonomous control systems, shared control methods proposed in the literature today also rely on specific paths and must therefore choose, infer, or accept (typically from a human operator) a specific goal or end point. In supervisory control, these waypoints are often explicitly designated prior to, or during the navigation task. Other methods infer them from the operator's control actions.
In [57], the authors introduce a hierarchical control strategy that considers human inputs at various levels of the wheelchair navigation task. At the "deliberative", or motion
Chapter 1: Introduction 19
planning layer, users designate a desired goal, which the controller sets as the target of a potential field. The controller then navigates toward the target via gradient descent on the potential field, modifying the user's command only when that command deviates by more than 90' from the field gradient or comes within a pre-configured proximity of an obstacle. When the latter occurs, a reactive controller modifies the direction of the human input to satisfy the constraint. Urdiales et al. [58] use a similar, potential-field-based approach to assist a human user while accommodating some human input at both the motion planning and execution levels. In their embodiment, control authority is allocated between the human and the PFA controller based on assessments of the "smoothness" (angle between robot's current direction and that of the provided motion vector), "directiveness" (angle between the current wheelchair heading and the vector to the goal), and "safety" (distance to the closest obstacle with respect to the wheelchair heading) of the human's input. Besides being subject to the local minima common to potential-fields-based approaches, the ad hoc assistance modulation employed by both of these strategies requires considerable tuning and does not guarantee 100% obstacle avoidance.
In contrast to supervisory or reactive control strategies that require a priori knowledge of the user's target, other control strategies have been proposed that infer the user intention from the operator's control actions. This approach is used in [59], for example, where the authors interpret the human user's desired goal with inverse reinforcement learning and adjust the level of autonomy based on the certainty of this goal estimation. When prediction certainty is high, the robot is allocated a greater degree of control. When certainty is low, the user retains more autonomy. Other approaches which rely similarly on a specific goal estimate to control the vehicle have also been proposed [60], [61]. The reliance of these systems on prediction accuracy in order to determine appropriate control allocation makes them ill-suited to assist the human in unplanned or emergency scenarios where the actual human intent is either 1) predictable but not safe (as in cases where the human fails to identify a hazard and continues to operate as before), or 2) difficult to ascertain or predict. In such scenarios, rather than take more control, systems whose intervention and control actions rely on the certainty of a path prediction can actually take less. Further, in low-threat scenarios, where direct
control by the human operator would be sufficient to keep the vehicle safe, these approaches effectively reduce the human's role to a supervisory one - not following his/her commands directly, but using the control inputs s/he provides to infer a desired
goal.
1.3
PROPOSED APPROACHThe work presented in this thesis builds on the premise that adaptive autonomy based on constraints, rather than inferred goals and associated motion paths, is better suited to share control with humans whose planning and control strategy is better represented by operating constraints and fields of safe travel than by specific paths [62]. Such fields contain an infinite number of continuously deformable trajectory candidates, or path homotopies of similar perceived "goodness", as illustrated in Figure 1.5. Identifying and circumscribing these homotopies by constraints, then allocating control authority as necessary to satisfy them neither over restricts the human operator in safe scenarios nor fails in risky ones, but instead ensures that the driver retains as much direct control freedom as possible without allowing the vehicle to lose control or collide with obstacles.
21 Chapter 1: Introduction
Driver-Perceived Field of Safe Travel - Homotopy Class 1
Goal / Target Region - - Homotopy Class 2
-- Homotopy Class 3
Figure 1.5. Illustration of prominent homotopies as they might be perceived by the human driver
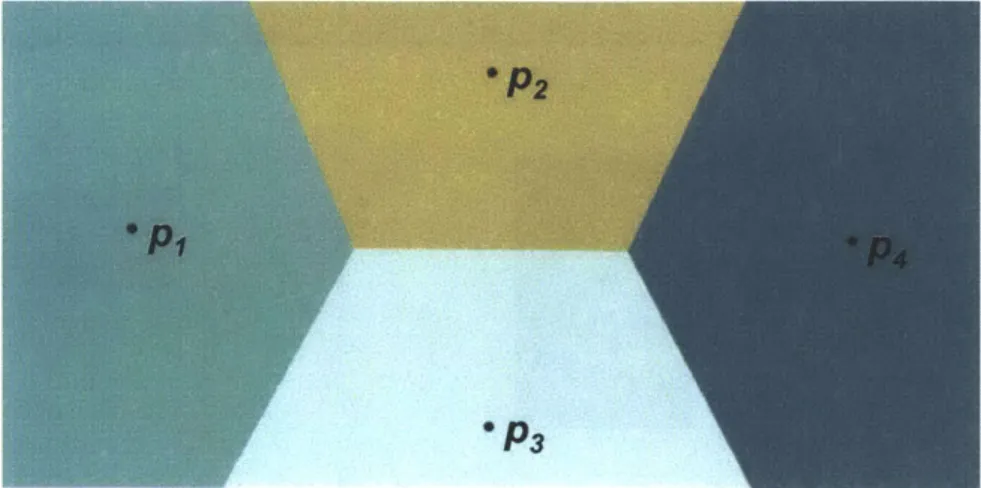
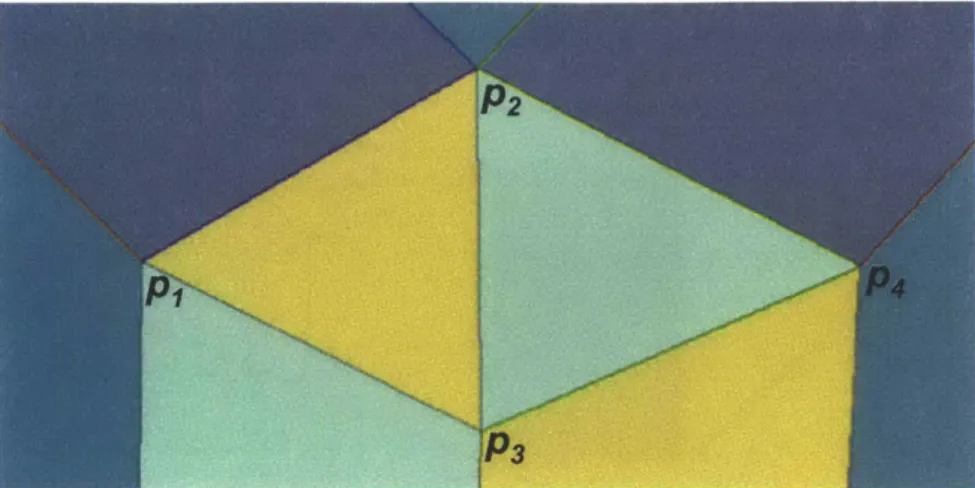
Figure 1.6 illustrates how three prominent homotopies in a cluttered environment might be perceived by a human operator. In off-road environments, the desired homotopy may not be as clearly delineated, though vehicle dynamic constraints require that it exclude any region through which the vehicle cannot travel without colliding with obstacle(s).
Figure 1.6. Visualization of prominent homotopies available to a human operator (image best viewed in color)
In addition to homotopy-imposed position constraints, the approach proposed in this thesis enforces stability-imposed state constraints and actuator-imposed input constraints on the vehicle. Together, these constraints bound an n-dimensional tube through the vehicle state space. The threat-based intervention system focuses its planning and control strategy on disallowing dangerous maneuvers or departure from the safe or controllable state envelope (which can be objectively defined given knowledge of vehicle dynamics and estimates of the environmental topology and conditions) rather than imposing a non-unique and potentially unsafe avoidance maneuver. Instead of telling the system what to do, the constraint-based system determines what not to do, given the current state of the vehicle, driver, and environment. Rather than forcing the driver to track a specific path, which is in many cases arbitrary from the human perspective, the constraint-based approach allows the driver to take any of an infinite number of safe (collision-free and dynamically-stable) paths through the environment. Figure 1.7 shows the basic architecture of a constraint-based, shared control system.
23 Chapter 1: Introduction
Map of regions, surface properties
.11'
focus of researich
Figure 1.7. Block diagram of a constraint-based, shared control system
While potentially better suited for shared, human-in-the-loop control, constraint-based semi-autonomy also presents significant challenges. Similar to its path-constraint-based counterpart, planning in constraint or "homotopy space" requires the identification of homotopies and an evaluation of their goodness. However, because the constraints bounding a path homotopy admit an infinite number of paths, identifying these constraints and assessing their goodness requires a new set of evaluation criterion from those commonly used in path planning. For example, whereas the goodness or optimality of a specific path is well defined using metrics such as length, curvature, and dynamic feasibility, corresponding measures lose their traditional meaning when applied to a set of constraints and the many paths they admit. Further, planning methods typically used to design paths, such as grid-based search, potential fields, and sampling-based algorithms, will not necessarily work to plan constraints since the latter must be designed to
circumscribe - rather than simply remain within - a safe operating region.
1.4
OUTLINE AND CONTRIBUTIONS OF THIS THESISThis thesis develops, simulates, and experimentally evaluates a constraint-based approach to shared human-machine control. Chapter 2 describes two methods for identifying, evaluating, and circumscribing path homotopies with semi-autonomously enforceable constraints and illustrates these method in single- and multi-agent target tracking and obstacle avoidance. Chapter 3 then describes a method for assessing the
threat, or likelihood of violating position and stability constraints and using that threat assessment to allocate control authority between the human and an onboard controller. This chapter also illustrates a threat-based control allocation method in shared control of a simulated ground vehicle. Chapter 4 then presents the setup and results of a 1,200-trial study conducted to assesses the effect of constraint-based navigation and associated driver feedback on the teleoperation performance of twenty drivers navigating an unmanned ground vehicle through an outdoor obstacle course. Finally, Chapter 5 closes the thesis with general conclusions and a proposal for future work.
25 Chapter Chapter P: Introduction]. Introduction 25
2
CHAPTER
2:
HOMOTOPY-BASED CONSTRAINT PLANNINGIn 1938, James Gibson, and Laurence Crooks postulated that rather than plan and track a specific path, human drivers identify and seek to remain within a field of safe
travel comprised of "...all possible paths which the car may take unimpeded" [62]. As
envisioned by Gibson and Crooks, this field extended "[like a] sort of tongue protruding forward along the road" (see Figure 2.1). This thesis extends their conception of human planning behavior to incorporate consideration of the many possible collision-free fields and their associated path homotopies existing within an environment with obstacles. If path homotopies can be identified, and their goodness evaluated, vehicle position constraints can be designed at the edges of a desired or optimal homotopy to circumscribe the set of paths it contains and ensure that the vehicle remains safely within it.
Figure 2.1. Illustration of a "field of safe travel" as envisioned by [62]
This chapter defines path homotopies, explains their significance to the vehicle navigation problem and notes how they have been used in traditional, path-based approaches to vehicle control. It then describes two new methods for identifying and evaluating the desirability of these homotopies, given the vehicle dynamics and control
constraints, and demonstrates each method in simulated studies of one or more ground vehicles.
The methods introduced in this chapter assume that the location, velocity, and size of obstacles in the environment are known over a finite preview horizon. In practice, obstacle information provided by onboard sensing is uncertain and range-limited. Improving the accuracy and coverage of these predominantly radar-, LIDAR-, infrared-, and camera-based sensing techniques is an active research area with significant implications for planning and control techniques that rely on these sensors [63], [64]. As demonstrated in several autonomous vehicle initiatives in recent years, these sensing systems have reached an acceptable level of accuracy for use in vehicular collision avoidance applications [11], [40], [65], [66]. As inter-vehicle communication techniques and protocols are implemented in the coming years, the accuracy, range, and robustness of environmental data is anticipated to improve further [67], [68].
The homotopic path planning techniques presented in this chapter also assume that the vehicle operates on a two-dimensional plane unless otherwise specified. This assumption is relaxed in Section 2.3.2.
2.1 PATH HOMOTOPIES
A path homotopy is a topological equivalence relation comprising multiple
obstacle-avoiding paths that can be continuously deformed into one another without encroaching on obstacles [69]. More formally, a path homotopy in topological space X consists of a family of paths h: I * X, indexed by t such that: 1) hj(0) = x, and h,(1)= x,
are fixed, and 2) the map H: I x I- X given by H(s, t) = h,(s) is continuous [70].
In the context of vehicle control, all paths spanning from the vehicle's current position X to a goal location Xg are said to be homotopic if they pass through the obstacles in the same manner. Visualized another way, a path homotopy spanning Xs to
XG is a subset of the field of safe travel that does not contain any holes. Thus, the on-road environment illustrated in Figure 1.5 contains at least four path homotopies; one passes to the right of both Obstacle C and Obstacle B, while another passes both obstacles to the
Chapter 2: Homotopy-Based Constraint Planning 27
left. Yet another homotopy passes to the left of Obstacle C and to the right of Obstacle B, and the final passes to the right of Obstacle C and to the left of Obstacle B.
2.1.1 TRADITIONAL USES OF HOMOTOPY RELATIONS IN PATH PLANNING
In robotic applications, homotopies have traditionally been employed as a topological guide to the path planning step of hierarchal motion planners [71]-[73]. In [74], Jenkins uses homotopy classes to simplify the shortest path problem (which in the presence of obstacles does not lend itself to exhaustive search) by partitioning the workspace into a set of mutually exclusive and collectively exhaustive classes, within each of which a shortest path solution may be found. Hernandez [75] extends Jenkin's method by introducing a Homotopic RRT to search within each homotopy class for a desired path. This use of homotopy classes to partition the planning calculation or reduce the search space of probabilistic path planners is not uncommon; various methods have been proposed using homotopy classes to reduce the size of probabilistic roadmaps while ensuring that they capture the multiple-connectedness of a robot's configuration space
[76]-[78].
Still other path planning approaches use visibility graphs, Voronoi diagrams, or Delaunay triangles to identify homotopies and thereby facilitate sample-based or optimal path planning [12], [15], [79]-[82]. In [83], the authors present a method for quickly assessing the homotopy to which any path belongs, independent of the method used to derive it, by defining a complex function that is analytical everywhere in the two-dimensional vehicle plane except for at distinct points placed at obstacle locations. This approach then allows one to verify the homotopy to which any path belongs by simply integrating this function along it and verifying the value of the result. This allows for relatively simple integration with existing sampling or graph search methods, since path plans derived from any of a variety of methods can be retained or discarded according to their homotopy equivalence.
2.1.2 PROPOSED USE OF PATH HOMOTOPIES IN CONSTRAINT-BASED VEHICLE CONTROL
In contrast to existing approaches, the constraint-based navigation framework proposed in this thesis plans and evaluates path homotopies as a proxy for the myriad of trajectory options each homotopy presents to the human driver. Rather than use topological equivalence to facilitate the planning of a single path, the proposed solution identifies and characterizes path homotopies in order to design and evaluate a set of position constraints bounding a heuristically-optimal, or driver-preferred set of collision-free paths. To this end, two approaches to homotopy-based constraint design are presented here. In the first, the environment is discretized into constrained Delaunay triangles, with path homotopies represented by sequences of adjacent triangles, across whose unconstrained edges every possible vehicle trajectory belonging to that homotopy must pass. Geometric and reachability heuristics are presented as a means of evaluating the "goodness" and dynamic feasibility of competing homotopies and establishing position constraints to bound the optimal class. The second uses a rectangular cell decomposition to discretize a reduced vehicle state space and facilitate calculation of a reachable and optimal homotopy by dynamic programming.
2.2
CONSTRAINT DESIGN WITH DELAUNAY TRIANGULATIONOne particularly useful tool for revealing the topological structure of the workspace is the Voronoi Diagram [84]. As illustrated in Figure 2.2, the Voronoi diagram for a set of points, P, partitions configuration space C into a set of cells R, such that every point within cell R, is closer to Pi than to any other point in P. The line segments at the boundaries of these cells trace out the topological skeleton, or medial axes of the free workspace; points along these axes are equidistant from the nearest obstacles [85].
Chapter 2: Homotopy-Based Constraint Planning 29
Figure 2.2. Voronoi diagram for a set of points, P, with cells R; shaded
Besides providing an effective means of planning paths that meet specific clearance requirements [86], the Voronoi diagram also provides a provably complete method for capturing the connectedness of a workspace or designing a roadmap that traverses it [87], [88]. As a result, the lateral expansion of each medial axis in a Voronoi diagram describes a unique homotopy class with that axis's start and end points. For example, in the workspace illustrated in Figure 2.3, all paths connecting the start position,
S, with a particular goal position G. will belong to one of two possible homotopies: the
first passing to the left of Obstacle A, and the second passing to its right. The Voronoi segment existing within each represents the path of maximal clearance belonging to the homotopy.
-
G
Figure 2.3. Generalized Voronoi diagram in an environment with obstacles
Various methods have been proposed for calculating Voronoi diagrams in worst-case 0(nlogn) time and with O(n) complexity [89], [90] and for using the result to plan collision-free paths [86], [91], [92]. While well suited for identifying homotopies and calculating maximal-clearance paths through obstacles, Voronoi diagrams do not encode the aggregate properties of the homotopies they delineate [80], [91]-[94]. In the paragraphs that follow, we introduce the Voronoi diagram's geometric dual - the Delaunay triangulation - as a more succinct representation of the paths existing within each homotopy that retains the connectedness information embedded in the Voronoi diagram.
The Delaunay triangulation for a set of points in a plane is a triangulation (or homogenous simplicial 2-complex) in which no point lies within the circumcircle of any triangle [95]. Its dual relationship with the Voronoi diagram captures the homotopy classes identified by the Voronoi; when connected by straight lines, the centers of the Delaunay triangulation's circumcircles form the medial axis of the Voronoi diagram.
Chapter 2: Homotopy-Based Constraint Planning 3 1
Figure 2.4. Delaunay triangulation for a set of points, P, with Delaunay triangles shaded
The Constrained Delaunay Triangulation (CDT) of a planar, straight-line graph G
is a triangulation of the vertices, P, of G that includes the edges, e, of G (such as those existing along obstacle boundaries) as part of the triangulation but otherwise remains as close as possible to the Delaunay triangulation [96] (see Figure 2.5). Introduced in 1934, the CDT has been used in various path planning algorithms [97]. In [81], the authors construct a channel from a sequence of triangles. Within this channel, a modified version of Hershberger and Snoeyink's funnel algorithm plans a minimum length path with requisite clearance from the channel's vertices [72]. Others have similarly used the constrained Delaunay triangulation to design a convex polygon or dual graph within which a minimum length or dynamically feasible path may be calculated using potential fields [98], model predictive control [79], or graph search algorithms [99]. These methods are similar in technique, though very different in purpose and execution from the usage proposed in this thesis.
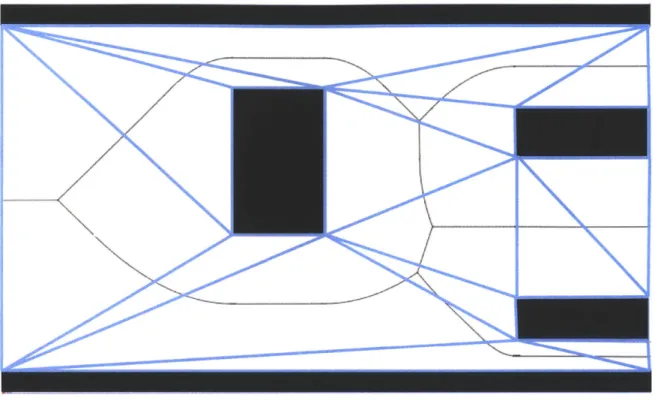
Figure 2.5. Generalized Voronoi diagram (thin black lines) and corresponding constrained Delaunay triangulation (blue) of an environment with obstacles (black
rectangles)
The constraint-based planning and control approach presented here uses the exact discretization and topological information provided by the constrained Delaunay triangulation to: 1) identify the edges across which paths belonging to specific homotopies must pass, the constraints they must satisfy, and the "control freedom" they provide, 2) evaluate the dynamic feasibility of transitions between those edges, and 3) design vehicle position constraints to circumscribe a desired homotopy. Each of these considerations is discussed below.
2.2.1 HOMOTOPY IDENTIFICATION
In this work, we identify homotopies by decomposing a two-dimensional
configuration space C2 E R2 into a homogenous simplicial 2-complex of constrained Delaunay triangles. Because the CDT provides an exact decomposition of C2, each sequence of adjacent triangles existing within it uniquely describes a single path homotopy connecting any point lying within the first triangle of that sequence with any
point lying within the last. Paths traversing each of these homotopies, while not necessarily remaining within the unconstrained boundaries of the triangulated channel, must cross each of the adjacent edges shared by its triangles. In this section, we present a method of simplifying this triangle connectedness to create a dual graph with nodes N corresponding to triangles T and edges ei representing adjacent and unconstrained triangle edges E.
The constrained Delaunay triangulation of an environment with polygonal obstacles 0 consists of three types of triangles, each of which can be classified by the number of vertices, Pi., it shares with obstacles in the workspace. Triangles with three vertices corresponding to the same obstacle, O, do not contain any free space and thus do no admit collision-free paths. For the present purpose, we label these triangles "Type 3" and exclude them from subsequent consideration in homotopy evaluation and constraint planning decisions.
Those with only two vertices per obstacle contain both free space and a constrained edge; simple paths that traverse them via their unconstrained edges are homotopic with respect to those edges. That is, any path through Ti that begins on edge Ei,1, ends on E,2, and does not violate the constrained edge E,3 or encroach on the vertex
opposite this edge may be continuously deformed into any other such path. For the sake of convenience, this thesis labels these triangles "Type 2".
Finally, triangles whose vertices span three different obstacles contain free space but do not describe a single homotopy by their unconstrained edges. With respect to starting and ending edges, these "Type 1" cells describe a bifurcation in the two homotopies that begin at any of their three free edges. Table 2.1 summarizes and illustrates this classification.
Table 2.1. Triangle classification method and implications for planning Type/Illustration Characteristic Utility/Implications
3 Shares three vertices with Prohibited region (excluded from
a single obstacle search)
2 Ei Shares two vertices with a Simple paths that traverse it via its single polygonal obstacle unconstrained edges are homotopic (one constrained edge) with respect to those edges
1 Vertices lie on three Describes a bifurcation in the
different obstacles (zero homotopy search space constrained edges)
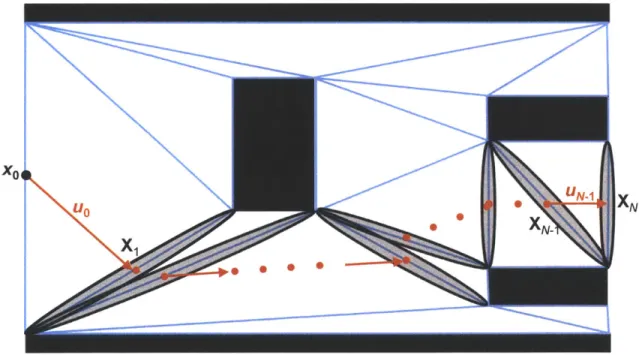
With triangle types defined, we construct the dual graph of the CDT to delineate each homotopy existing in the workspace. Triangles in the CDT are represented by nodes in the dual graph, while edges in the graph represent the connectivity of those triangles across their adjacent edges, Ei. Any feasible homotopy containing the vehicle's current position X, and the position of the goal location, XG, may be defined as a sequence Hn of adjacent triangles TO... Tn extending from the triangle circumscribing the vehicle's current position (To in Figure 2.6) to any of the triangles containing the goal location(s). This goal may be described by a single point or by a given region of R2, such as the distal edge
of the local sensing window illustrated in red in Figure 2.6.
Chapter 2: Homotopy-Based Constraint Planning 3 5
Obstacles - Generalized Voronoi Diagram
Selected Homotopy Delaunay Triangulation
Target Region
Figure 2.6. Illustration of triangulated environment highlighting one of its homotopies
2.2.2 HOMOTOPY EVALUATION
In order to plan a set of constraints circumscribing a desired homotopy, metrics describing homotopy goodness must be defined and ascribed to individual triangles (node costs) and transitions between them (edge costs) to enable graph search over the dual graph. This thesis proposes three distinct heuristics for evaluating homotopy goodness: an estimate of the average "distance" traveled by paths belonging to the homotopy, an estimate of the control freedom available to an operator while navigating within the homotopy, and the dynamic reachability of the homotopy's paths from the vehicle's current state. We note that because the human driver's eventual path through any given homotopy is not known, evaluations of that homotopy's goodness necessarily require some assumption of the general shape and direction of the driver's path, as well as generalizations about the control freedom it provides and the dynamic feasibility it allows.