Distributive
Creating Cleavages:
Politics and Electoral Alignment
by
Jiyoon Kim
B.A. in Political Science
Yonsei Univeristy, 1994
Master in Public Policy
The University of California at Berkeley, 1997
SUBMITTED TO THE DEPARTMENT OF POLITICAL SCIENCE IN PARTIAL
FULFILLMENT OF THE REQUIREMENTS FOR THE DEGREE OF
DOCTOR OF PHILOSOPHY IN POLITICAL SCIENCE
AT THE
MASSACHUSETTS INSTITUTE OF TECHNOLOGY
JUNE 2005
© 2005 Jiyoon Kim. All rights reserved.
The author hereby grants to MIT permission to reproduce and to distribute publicly paper and electronic
copies of this thesis document in whole or in part.
Signature of Author:
Certified by:
J
Department of Political ScienceApril 4, 2005
(
// Stephen D. Ansolabehere
Professor of Political Science Thesis Supervisor
Accepted by :
MASSACHUSETTS INSTITUTE OF TECHNOLOGY OCT 17 2005LIBRARIES
Roger Peterson Professor of Political Science Chairman, Graduate Program CommitteeARCHIVES.,
ICreating Cleavages:
Distributive Politics and Electoral Alignment
By Jiyoon Kim
Submitted to the Department of Political Science
On April 4, 2005 in partial fulfillment of the Requirements for the Degree of Doctor of Science in Political Science
ABSTRACT
Distributive politics plays an important role for political elites for their electoral goal. Since the resources that politicians can distribute are limited, they have to decide how to distribute them in order to maximize their utility. And region becomes one of the most important yardsticks. Politicians first distribute public goods where they are supported. Economically rational voters react to what they receive and cast votes for those who have brought most benefits to them. This establishes the relationship between politicians and voters in a region, and solidifies regional voting behavior further. Therefore, regional voting is the product of politician's strategic distributive politics and rational voters' behavior.
Regionalism does not only arise from economic or social cleavages that we are able to observe, but they are also intentionally cultivated. There are numerous possible reasons why regionalism started in the first place. It could have been from ethnic cleavages, unequal economic
development or historical and political events that occurred in the past. However, whether or not to breed regionalism is determined by how regionalism works for the political purpose.
As in the case of Korea, regionalism has been the best political tool for political parties to decide where to focus for their electoral success. It has been used for the efficient redistribution and deepened the regional cleavage in Korea as a result. Therefore, it can be said that regionalism worked for political parties' electoral goals, which has been well received by electorates, who are interested in what they receive in return.
In the second part of the dissertation, I question the claim that ethnically fragmented community is more likely to have poor fiscal policy. Scholars have raised many problems of this ethnically diversified society, and a lagged economic development and inefficient government spending are one of them. Many studies have speculated the negative effect of ethnic fragmentation on economies of scale. With a new study design, I show that previous studies on the relationship between ethnic fragmentation and provision of public goods and services can be misleading or be exaggerating the effect of ethnic diversification at most.
Thesis Supervisor: Stephen D. Ansolabehere Title: Professor of Political Science
Acknowledgments
It was a long journey. The journey started on one day of September in 1998, and is about to end. Of course, I know so well that a new one will start soon. It was not an easy road and I stumbled so many times during the journey. Sometimes it was exciting and fun, but there were other times that were pretty rocky, which made me feel like throwing a towel. Here, I would like to mention some of names whose support made me go through hard times to show my gratitude. Without these people, I would never have written this part of my thesis.
First of all, I would like to thank my committee members. Prof. Stephen
Ansolabehere, who is also my advisor, has always been there for me. Without his warm support and invaluable advices, it would have never been possible for me to finish my study at MIT. He did not just intellectually direct me as my advisor, but also cared about me in so many ways. With his office door opened, he never complained my unexpected visit with so many questions. Whenever I felt like giving up, he encouraged me with unbelievable patience. I would never know how to thank him.
I also thank to Prof. James Snyder, who made me realize that being super-smart and being super-nice can coexist. He can never imagine how much I was intimidated by his intellect when I first met him. Soon, I realized that he was one of the sweetest guys I have ever met. Like Steve, I thank him so much for not having complained at all when I dropped by his office with silly questions without notice. He always welcomed me with a big smile and over-answered to my questions, which eventually brought me back to him again with more questions.
Prof. Jonathan Rodden should be also mentioned here. He joined in the
committee member last, but showed so many interests in my research. Jonathan always directed me to look at the question with various and interesting perspectives. His sincere care for my study and my personal well-being is much appreciated. I also have to say that I so much enjoyed the presence of his son, Nathaniel, in my defense, although he gave me incorrect information that babies are calm, quiet and very peaceful. I realized that it was completely wrong only after I had my own.
I thank to Susan Twarog, our beloved graduate administrator. She not only helped me with administrative process, but also cared for me so much. Being apart from my family in Korea has never been easy for me. Susan has always been there for me just like my mother. I cannot thank her enough.
My officemates have enriched my life at MIT. Amos Zehavi, Rachael Cobbs, Rachel Gisselquist, David Konisky, Boaz Atzili, and Michiko Ueda are only few of them. I cannot forget the time we shared in our no-window and depression-producing office. I also would like to thank to Brett Kubicek, Doug Fuller and Yutaka Kashiwabara for being there as my friends. In particular, the friendship that Doug and Yutaka showed me to fly over to attend my wedding should never be forgotten.
Some of my Korean friends should be mentioned here, too. Sungeun Im, who is my best friend since my high school days, and Yoonjung Seo always encouraged me when I was in slump. I appreciate their friendship. I would never forget the times that I spent with Eunhwan Jeon when she was in the states for her own study. Also, I would like to thank to Wonhee Jeon, Soonjo Chung, Jinwook Lee, Kyounghee Yu, Jungho Roh, Hyunjoo Yang, Hyungjoo Kim, and Carol Kim.
I also would like to express my gratitude to my family-in-law. My uncle-in-law and aunt-in-law always supported my study. I thank to my father-in-law who showed me various aspects of life. Also, I thank to my mother-in-law for her caring for me while I was finishing my study. My brothers-in-law and sister-in-law, who showed
encouragement, should be remembered.
I send infinite gratitude to my family. Without their unconditional love and concern, it could never been possible for me to finish my study. My mother, who always sacrificed everything for me should receive the most gratitude. Her endless concern and support brought me self-confidence back. My father has been intellectual inspiration to me all the time. His interest in my research and recommendations enriched my thesis. Both my parents believed in me when I was in hard times, which should be much appreciated. I also thank to my sister. I admire her positive and optimistic spirit, and proud of her very much.
Last, I would like to thank to my husband, Sanghyuk Park who is the sweetest and most understanding person that I have ever met. His love, concern, support and belief in me not only enriched my life, but also let me go through this whole process of Ph.d. Also, my newborn son, Adrian Jaewoo Park should receive my gratitude. Although he took part in delaying many things in completing the study, he brought tremendous joy to our lives. I love you.
Contents
Chapter 1. Introduction 9
Chapter 2. Regionalism around the World 17
1. Introduction 17
2. Regionalism around the World 18
Canada 22
Spain 27
The United Kingdom 31
The United States 35
3. Conclusion 41
Chapter 3. Regionalism in Korea: How Powerful is it and Why Does it Exist? 63
1. Introduction 63
2. History of the Regional Parties in Korea 65
3. Theories of Korean Regionalism 73
4. Conclusion 78
Chapter 4. Korean Regionalism - Artifacts or Truth? 83
1. Introduction 83
2. Data and Methodology 86
3. Regression Result and Discussion 89
4. Generational Effect? 94
5. Conclusion 96
Chapter 5. Distributive Politics and Korean Regionalism 109
1. Introduction 109
2. Regional Voting in Korea and Distribution Theory 110
3. Data and Methodology 114
a. Descriptive Analysis 114
b. Regression Analysis 118
4. Conclusion 121
Chapter 6. Ethnic Division and Public Goods Revisited 131
1. Introduction 131
2. Literature Review in Ethnic Politics 132
3. Methodology and Data 136
4. Result and Discussion 141
5. Micro-data Analysis 145
6. Result and Discussion 149
7. Conclusion 151
Chapter 7. Conclusion 163
In its grand outlines the politics of the South revolves around the position of the Negro.... Whatever phase of the southern political process one seeks to understand, sooner or later the trail of inquiry leads to the Negro. ... It is the whites of the black belts who have the deepest and most immediate concern about the maintenance of white supremacy. Those whites who live in counties with
populations 40, 50, 60 and 80 percent Negro share a common attitude toward the Negro." (V.O.Key, Jr. Southern Politics in State and Nation, p.5)
Chapter 1. Introduction
In his seminal book, Southern Politics in State and Nation, V. O. Key, Jr. assessed that race is the centripetal issue in southern politics in the United States. Whites living in counties with a high black population are threatened to foster white supremacy and eventually create an unhealthy one party dominant system in the region.
The one party dominant system only prevents a sound competitive party system from existing and cultivates unhealthy factional political systems in the South.'
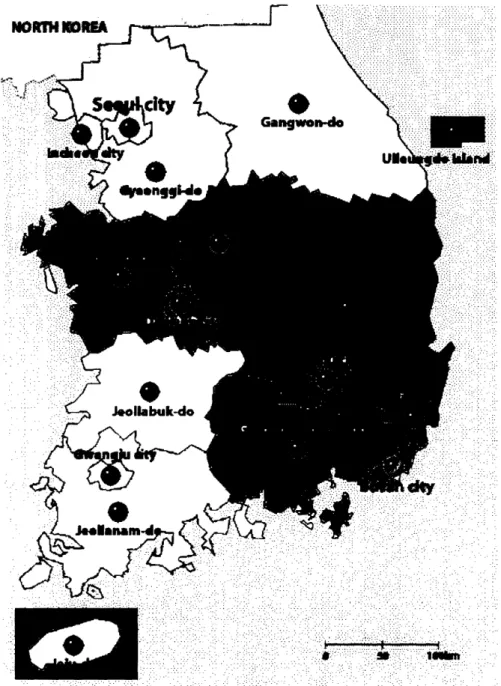
One party dominance in a region in Korean politics since 1987 appears to be similar to what Key indicated more than 50 years ago. Unlike the South in the United
States, however, there is no race issue or tragic war in which the southerners were defeated by Yankee Republicans. What they have are several key political players favored by each region and strong anti-feelings against each other.
V.O.Key. Jr. (1 984). Southern Politics in State and Nation. Knoxville: University of Tennessee Press.
The regionally divided election result is not only seen in the United States or Korea. Voters in almost any country constitute a geographic voting bloc along party lines or along the party line. In European countries such as Spain, Belgium or the United Kingdom, the regionally divided voting blocs raise their political voices in various tones from a moderate regional autonomy to extreme separation from the nation. In these countries, however, a party's regional dominance does not only imply geographical voting division, but, more often than not, so do ethnic and cultural tensions. Naturally, much of the studies on regional division in elections so far have been treated as a part of works on ethnically driven regionalism.
However, ethnic or cultural tension is not a sufficient or a necessary condition for one party's regional dominance. There are many countries that do not show any regional or ethnic tension despite their ethnic or cultural distinctiveness. On the other hand, with a high ethnic unity, some countries have intense conflicts based on the geographic origin of people.
Distribution is one of the most important devices for political elites. Politicians who have the ultimate goal of being elected, bring benefits to their districts and claim that they are responsible for those porks. (Mayhew, 1974) Those who are able to provide what electorates want receive credits for it are successful in being reelected. On the contrary, those who are not guarantee the seat in the next election.
For this reason, many scholars have studied how political elites distribute public goods in order to achieve their goals. Some argue that it is most strategic to distribute to swing districts where the electorates are willing to change their votes according to what they receive. (Dixit & Londregen, 1996; Lindbeck & Weibull, 1987) Others argue that
distributing goods to supportive districts is a way to maximize politicians' utility. (Cox & McCubbins, 1986) This claim is supported by the empirical study of the Congressional election and distribution in the United States. (Ansolabehere & Snyder, 2002) Still, the discussion has not yielded a definite answer as to which is the best way for political elites to distribute resources for the purpose of reelection.
This dissertation studies not only the most efficient distributive politics, but also the relationship between one-party dominance of a region and distributive politics. The study of regionalism and regional voting behavior more often than not overlaps or bridges with the study of "ethnoregionalism." Ethnic cleavage would be one of the
clearest answers to regional voting. Many ethnic groups that are geographically concentrated have a political party which represents its interests and requests increased autonomy from a central government. Often these parties are not powerful enough to
influence national politics due to their limited ethnic appeal. But, they can be quite successful in attracting locales that have been feeling distant from a central government.
On the other hand, economists pay attention to the increase of regionalism around the world and attribute the phenomenon to economic competition and egoism. As modernization advances, constituents become more competitive in order to achieve economic resources and employment opportunities. (Barth, 1969; Hannan, 1979) Additionally, economically developed regions do not want to redistribute their wealth to other lagged regions in a country, while they are ready to join the expanded and open market on their own. Globalization, in this sense, brought regional conflict and regional assertiveness to modem times. (Keating & Laughlin, 1997; Alesina & Spolare, 199x)
In this dissertation, I argue that regional voting behavior is the result of the interaction between distributive politics driven by political elites and electorates with
economic goals. Distributive politics play an important role for political elites in their electoral goal. Since the resources that they are able to distribute are limited, they have to
decide how to distribute them in order to maximize their utility. And region becomes one of the most important yardsticks. Politicians first distribute public goods where they are supported. Economically rational voters react to what they receive and cast votes for those who have brought them the most benefits. This establishes the relationship
between politicians and voters, and further solidifies regional voting behavior. Therefore, regional voting is the product of the politician's strategic distributive politics and rational voters' behavior.
The first part of the dissertation explores regional voting in Korea. Korea is a country with homogeneous people who have been sharing the same language, history and culture for more than 2000 years. Regionalism, however, as we see in Korean elections is as much a critical factor as in countries with ethnic cleavages.
I employ the distributive politics theory to Korean regionalism and explain how and why it is so intensely sustained. Many Koreans have seen Korean regionalism as a result of emotional hatred between regions and immature political culture. Some asserted the economic deprivation of one region by another and democratization that brought about the realization of the discrimination. More recently, scholars emphasize that
regional voting is the result of rational voters' sub-optimal decisions.
Here, I argue that the regionalism of Korea is the result of politicians' distribution of public goods and rational Korean voters' reactions to it. It is true that we cannot
ignore the historical background of Korean politics. Nevertheless, the strengthening of regional voting requires a better explanation. I propose that distributive politics has increased the intensity of regional voting of Korean electorates since it had first appeared.
The study of Korean regionalism consists of four chapters. The first chapter examines regional voting in other countries. I choose four countries with regionalism, which are Canada, Spain, the United Kingdom and the United States. The comparative study of these countries serves to demonstrate how unique Korean regionalism and regional voting is.
The second chapter briefly introduces Korean regionalism. The chapter is intended for those who are new to Korean politics so that they may understand the subject. It includes when and how regional voting has started. And, Korean scholars' different perspectives regarding the phenomenon will be illustrated.
In the next chapter, I examine whether or not the regional factor in Korean elections truly exists. Sometimes, region reflects other important voting determinants such as socioeconomic status, ideological stance and the economic situation of residents. Before I further investigate the regional voting of Korea, I make sure that the Korean election is seriously influenced by region. Statistical analysis will provide evidence that region truly plays an important role in the election.
Then, I introduce the theory to explain the regional voting of Korea which is followed by statistical analysis. As I mentioned above, regional voting of Korea is
intensified through strategic distribution of public goods by political elites. Patterns of project distribution, the change of regional economic growth, and recruit of political elites will display evidence of politician's strategic distribution to some extent. Statistical
analysis of intergovernmental grants to each region will solidify my theory that politicians use distributive politics and strengthen regional voting for their reelection.
The second part of the dissertation is about how distributive politics is affected by the community type. Many economists agree that ethnic diversity causes different interests in a community and an inefficient fiscal policy by local government as a result. Among them, Alesina, Baqir and Easterly provided a formal model and statistical analysis that demonstrate an ethnically diverse community receives important public goods, such as education, less. Their study conforms with most ethnic studies that prove the inefficient and poor fiscal policy in ethnically fragmented countries.
I challenge the study by Alesina et. al. and many other economists who claimed inefficient fiscal policy in American counties with high ethnic fragmentation. Through my research, I have noticed that it is not ethnic diversity that affects the local
government's distributive politics. It is the economic and financial condition of a community that influences on the distributive policy most. Ethnic difference in opinion about distribution of public goods disappears as the economic gap between different ethnic group decreases. Therefore, it is the economic situation a person faces that influences the opinion about the distribution of public goods and the community's fiscal policy as a result.
In both studies, I try to emphasize the importance of the relationship between distributive politics and the rational minded electorates. Many political phenomena that appear to be influenced by irrational factors are in fact caused by voters who are
concerned about the economy. Nevertheless, electorates behave according to what they expect to receive. Both the regionalism of Korea and distribution of public goods in
ethnically diverse counties are caused by rational voters. Acknowledging the rational side of voters, strategic politicians manipulate regionalism in order to enhance their electoral chances.
The essay will be concentrated on the empirical side of distributive politics and voting behavior. I hope that the study of the regionalism of Korea contributes to answering many puzzling questions about regionalism we find around the world. In addition, I expect that Part II raise questions about the ethnic politician's claim of a negative relationship between ethnic fragmentation and sound fiscal policy.
Chapter 2 Regionalism Around the World
1. Introduction
Amongst non-ideological voting behaviors, regional voting behavior has not received much attention. This is due to the fact that most regional voting behaviors are closely related to ethnic, linguistic or religious differences in many countries. In this respect, the regional voting behavior in Korea is quite an unusual case. Korea is one of the most homogeneous countries in the world; its population has used the same language and has shared the same culture and history for more than 2000 years. Therefore, what are the causes of the regional voting behavior in this homogeneous country?
However, before proceeding to the analysis of Korean regionalism, it is important to first examine the cases of regionalism that exist in other countries. The purpose of this chapter is to introduce various forms of regionalism seen in elections and to compare them with the Korean case, which will be presented in the next section.
In this chapter, four countries that are known for displaying regional voting behavior of electorates will be tested using statistical methods. The regression results will display different kinds of regional voting phenomena. The principal reasons for regional voting are the ethnic and cultural cleavages that exist in a country. However, not all regional voting can be explained by the cleavages. In particular, the US case shows that regional division of voting can also be created by demographics. Thus, this chapter confirms that there is a need for further research in order to determine reasons other than ethnic and cultural cleavages for regional voting.
The next section will focus on the statistical methods that were applied and the variables for the test. Moreover, a short introduction of each country's electoral regional
division will be provided, as well as an analysis of whether or not the regions have an impact on voting behaviors of electorates in the country.
2. Regionalism Around the World
Although regionalism that leads to the actual separation of the region is not obvious, examples of electoral division by regions are relatively easy to find around the world. This passive form of regionalism is quite often observed regardless of the existence of ethnic, cultural or linguistic cleavages.
For instance, Canadian election results are separated according to western and eastern divisions. Besides the French-speaking ethnic group in the Quebec region - who have the Bloc Quebecois as their own regional party - those who reside in Ontario and the rest of eastern Canada are much more likely to vote for the Liberal party. On the other hand, those who live in the western part of Canada have a tendency to vote for the Reform party. There is no particular ethnic group that leads this division in Canada.
As a matter of fact, many scholars started to focus on factors other than ethnic, cultural, and linguistic aspects in order to explain the electoral division by regions. Quite often, regionalism is attributed to the unfair economic development, political history, or different industrial structure that results in ideological difference amongst voters, and abrupt changes in the political situation of a country. It is also true that there is not one specific explanation that can completely describe all kinds of regionalism. Some country's regionalism is clearly due to ethnic division, whereas other country's
2 Another regional voting occurs in Quebec province where most French speaking Canadians live. The
province has regional party, the Bloc Quebecois, and support for the party. In 2000 election, however, the Liberal Party higher percentage of vote share in Quebec province and obtained 36 seats.
regionalism is the reflection of many other factors. In particular, when it comes to elections, the causes of regional voting become even harder to decipher: Does regional voting occur because electorates irrationally identify themselves with the regional party? Or do they vote for the party because they strongly believe that the party offers the most benefits to them?
If the former is right, then it can be concluded that the regionally different election results are based on emotionally driven regionalism. However, the latter case implies that it is rational voting behavior by electorates. Therefore, it is imperative that the "true regional effect" be sorted out from the regional voting behavior. In this section, I introduced four cases that showed regional division in elections, and I also
demonstrated the extent that "region" plays a role in the division.
As my dataset, I used the Comparative Studies of Electoral System (CSES), which released in 2002. The survey includes questions of a personal nature, such as the
socioeconomic status of the respondent. It also includes questions pertaining to the political and electoral inclination of the respondent.
Four countries were selected for the analysis. The countries I picked were Canada, Spain, the United Kingdom, and the United States. All four countries exhibit
regional voting divisions, but to different degrees. The electoral division of some
countries is due to the cultural and ethnic cleavages. However, there exist other countries where we cannot identify any particular cultural and ethnic cleavages. This would provide an interesting comparison.
Depending on the availability and the country's circumstances, variables for the regression analyses were slightly different. Nevertheless, the same rule was applied in
selecting variables.
I used two different dependent variables. The first variable was the preference of a particular party by a respondent. Using a scale from 0 to 10, the respondent was asked to indicate the extent to which he or she liked a particular party. Instead of testing all parties of a country, I focused only on politically significant parties. Therefore, only three or four party preferences were tested.
The second dependent variable was the actual vote choice of the respondent. The original survey prompted the respondent to indicate the party that he or she voted for in the previous election. I created new binary variables whether or not he voted for parties that are analyzed here, and use them as dependent variables. Once again, I only used three or four parties for each country.
Three kinds of independent variable groups were created. The first group consisted of the respondent's age, level of education, household income, and the type of residential neighborhood that he or she resided in urban.
The second group of variables consisted of retrospective factors in voting decision. Rational voters are believed to reflect the practical condition that they are surrounded by. Most importantly, the economic situation that a voter is faced with has a direct influence on his or her vote choice. An incumbent party or president will be evaluated by the current economic situation (Key, 1966; Fiorina, 1981). The voter's opinion of the current economy was also asked in the survey. For example, if a respondent thought that the economy has drastically declined, he or she would write
down the answer '1' to the question. On the contrary, if a respondent thought that the economy has significantly improved and attributed this improvement to the incumbent government, then he or she would indicate a '5' as his or her response.3
The third variable group consisted of the ideological distance of a respondent from each party. The survey asked respondents to scale their ideologies on a scale of 0 to
10. If a person thinks of himself or herself as mostly liberal, then he or she would have coded the response as '0'. On the other hand, the most conservative person would have
answered 10 based on the same scale. Besides self-measured ideology, it also measured the respondent's opinion about each party's ideological stance. I calculated the distance between ideological stances of a respondent and a party by squaring the difference. For
instance, if a respondent answered that his or her ideology was '3', and perceived party A's ideology as a '6', the distance between the respondent and the party's ideology would consequently be a '9'. The larger the distance, the further a respondent ideologically felt from a party.4
Last but not least, the regional dummies were included in the regressions. With the variables described above, the regression coefficients of regional dummies will show the extent of the role that the regions play in determining voting decision.
First, I tried the regression analysis with regional dummies only. The second regression included the complete set of independent variables. The first set of regressions only included regional dummies as independent variables. This will show that how
The original survey, as a matter of fact, coded in opposite way. That is, answering 1 means that the economy has most improved, while 5 means that the least improved. I changed the scale in opposite way for the purpose of easier reading of regression result.
4 In case of the United States, there was no measurement for the ideological stance of a party from a respondent's perspective. Therefore, I had to use only the self-measured ideological stance which only indicates how liberal or conservative he is. Since the Republican party is widely known and believed as more conservative than the Democratic party, I believe that it would not be inaccurate to show the influence of ideology in voting decision.
regions influence on dependent variables without consideration of any other factors than regions. In the second set of regression, all other independent variables were included. The comparison between these two sets of regression will exhibit the true regional effect after other factors were controlled.
The Ordinary Least Square regression with Huber-White robust standard error was employed for the statistical methods. Each of the OLS regression results was compared with an ordered logit and probit regressions results. If there is much difference in significant level, I should consider the results from the ordered logit or probit
regressions.
CANADA
Canadian regionalism is often referred to the regionalism of the Quebec province. The region retains French culture and language. It has a regional party, the Bloc
Quebecois. There were two referenda that attempted to separate the region from the rest of Canada; one took place in 1980, whereas the other was in 1995. Neither attempt was successful, but with a fairly small margin. 5 The region still remains as a politically unique island of Canada.
Nevertheless, this is not the only electoral division by regions that we can see in Canadian elections. More interestingly, we can observe the division between eastern and western Canada according to the party line. In this case, culture, language, ethnicity or
5 The first Quebec sovereignty referendum about held on May 2 0th, 1980. The 40.44 % of voters approved
the separation, while 59.56 % of them opposed to it. The second referendum was on October 3 0th, 1995. This time, the margin between "yes" and "no" was much slimmer than that of the previous one. The 49.42 % of voters voted for the Quebec sovereignty, while 50.58 % against it.
religion do not seem to have an effect. This is because no unified ethnic or linguistic group exists in either region.
Although the Bloc Quebecois and its regional strength in the Quebec area is well documented with the perspective of ethnic politics, the division between eastern and western Canada has not received much attention. The recent argument attributed the division to the Liberal government's special treatment of the Quebec region. Those who were displeased with Quebecers and their separation movement were more likely to vote for the Conservatives. They thought that the government was giving too much benefits and special treatment to the Quebecers in terms of welfare and political status. Western Canadians, in particular, were not happy with the special treatment that the Quebec region receives from the government (Blais et. al., 1999). However, it is important to note that the exact reasons for the eastern and western electoral division in Canada were not well accounted for, and thus further research is needed.
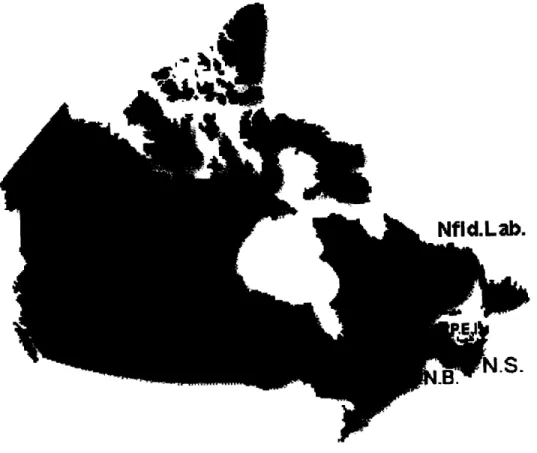
Figure 1 is map of Canada, which was included in order to help readers understand the geographical division of an election result. Table 2 represents the Canadian general results of the 1997 election.6 As can be seen in the table, a big portion of the eastern part of Canada, including Ontario, went to the Liberal Party.7 The Liberals obtained 101 seats out of 103 seats assigned in the Ontario region; they also obtained all four seats in Prince Edward Island. The vote share of the Liberal Party in Quebec was as high as that of the Bloc Quebecois and gained 30 percent of total seats of the region. On the other hand, electorates of Saskatchewan, Alberta and British Columbia heavily
6 The Canadian data in CSES asks a respondent which party he or she voted for in the election 1997. 1,
therefore, present 1997 and 2000 election results.
7 Again, the exception is Quebec region which has its own regional party of the Parti Quebecois. They
dominantly vote for the PQ, but began to also vote for the Liberal Party recently.
favored the Reform Party. The Reform Party won 57 seats out of 64 seats in these provinces.
The election results of 2000 were not that different from the ones obtained in 1997 (see Table 3). Still, the Liberal Party was much stronger in Ontario and won 100 seats. It only gave up 2 seats to the Reform Party. In Quebec, the party won almost as much seats as the Bloc Quebecois. However, the Liberal's could succeed in capturing a
significant number of seats in the western Canada, which includes Saskatchewan, Alberta and British Columbia. Only 9 seats were given to the Liberals, while 60 seats were given to the Reform Party out of 64 seats in total.8
At first glance, the region appears to have a significant impact on voter's decision. The western Canadians favor the Conservatives, while the Eastern Canadians prefer the Liberals. However, one should not ignore the possibility that other factors may have had an impact in this division, including the socioeconomic level, the structure of industries and the political history of the region.
For the regression analysis for the Canadian case, I decided to focus only on the parties that obtained a substantial number of seats in the elections. That being said, the parties I chose were the Liberal Party, the Canadian Reform Conservative Alliance, and the Bloc Quebecois.
In the case of the Bloc Quebecois, I also included language interaction terms with the Quebec regional dummy. Since the Bloc Quebecois is based on ethnic heritage, I
8 In 2004 election, one noticeable change was the gradual gain of the Conservatives in Ontario region. The
Coalition of Conservatives gained 24 seats in Ontario in the 2004 election. The Liberals also increased their seats by three in British Columbia. Nevertheless, the division between eastern and western Canada is
still visible.
expected different attitudes toward the party between Anglophone Quebecers and Francophone Quebecers. The regression result is represented in Table 4 and Table 5.
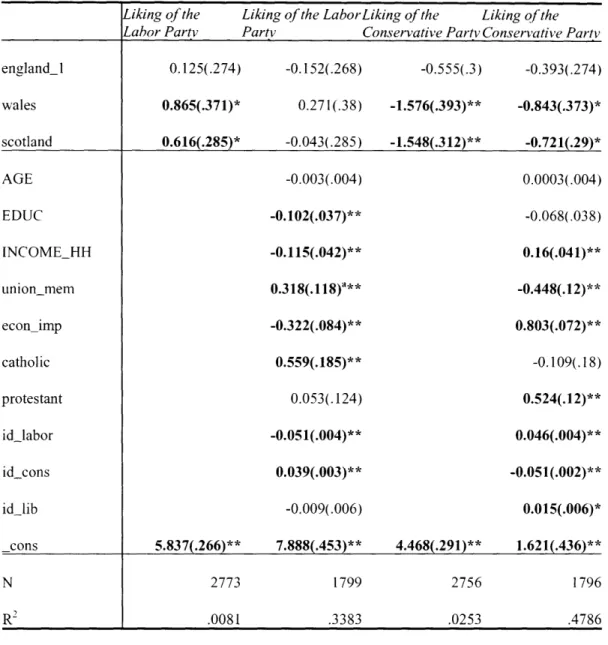
The coefficients in Table 4 represent the regression result obtained when the preference of a party was used as the dependent variable. The regression coefficients and their significance level when only regions were considered as explanatory variables
-were found to be different from those obtained when all other factors -were regressed together.
First, regional dummies of Alberta, New Brunswick and Quebec were statistically significant when the liking of the Liberal Party was regressed only according to regional dummies. However, once other factors were controlled, the significance disappeared. The urban residency, the opinion about the economy and ideological distance from the party are highly important.
When the Reform Party was regressed only on regional variables, it was found that those living in Newfoundland, Prince Edward Island and Quebec are negatively related to the preference of the Reform Party. On the other hand, those residing in Alberta and British Columbia are positively related with it. As other variables were included, the regional effect weakened. The significance of living in Newfoundland, Alberta and British Columbia disappeared when other factors were controlled. Still, the residency of Prince Edward Island and Quebec was an important factor in determining whether or not one liked the Reform Party.9
Among non-regional variables, it was found that those living in urban areas preferred the Liberal Party. On the other hand, educational level was negatively related
9 Interestingly, the coefficient of Prince Edward Island has increased than the previous one. Moreover, Saskatchewan shows increased coefficient and even becomes statistically significant.
with the preference of the Reform Party, and the finding was also significant. As expected, the coefficient of the ideological distance from a party was negative and significant if a respondent liked the party better than other parties. For instance, the farther the ideological distance from the Liberal Party and Bloc Quebecois, the more an electorate was likely to favor the Reform Party. On the contrary, the ideological distance between the electorate and the Reform Party was negatively and significantly related.
As mentioned above, I included interaction terms of the Quebec region and language. In the first regression with only regional dummies, Nova Scotia, Saskatchewan and Manitoba were negatively related with the liking of the Bloc Quebecois. However, once all other variables were considered together, regional dummies tended to lose statistical power. Even the coefficient of "Quebec" was not particularly significant. The statistical significance was shifted to the interaction term between the "Quebec" and the French-speaking dummy. The magnitude of the coefficient was as big as 3.307 and significant. On the other hand, the Anglophones living in the Quebec area did not show any statistical differences over the preference of the Bloc Quebecois. Again, ideology played a significant role, although its magnitude was much lower than the interaction term. Also, electorates who were older and who had lower income levels seemed to dislike the Bloc Quebecois.
The next table shows the regression result when the actual vote choice was the dependent variable. When the voting for the Liberal Party was the dependent variable, none of the coefficients of regional variables were significant in the limited regression. Interestingly, they changed to be significant in the full regression.'0 The voting for the
10 The sample size has dramatically decreased in the full regression. I suspect that the newly found regional significance is partly due to the characteristics of the sample used in the full regression.
Reform Party lost significant power. In the case of the Bloc Quebecois, the regression only with regional dummies was meaningless, as the data did not have any respondent who voted for the Bloc Quebecois and who were not residing in Quebec.
Again, the most interesting case concerned Quebec electorates' attitude toward the Bloc Quebecois. Like the party preference regression that was presented before, none of the regional dummies - including "living in Quebec" - had statistical power when other factors were controlled. Instead, the interaction term of French speaking electorates living in Quebec attained positive and significant power. Socioeconomic background or economic considerations were not statistically significant. Only the ideology was negatively and significantly related with the vote choice of the Bloc Quebecois. The magnitude, however, was very small.
Thus, the regional effect of Quebec is not due to the region; rather, it can be attributed to the ethnic differences between Francophone Canadians and Anglophone Canadians.
SPAIN
The most prominent regional movements in Spain arose from the two regions of Catalonia and Basque.l1 Andalucia and Galicia were also known to be regionally
peculiar, but they did not assert their independence as strongly as the two former regions. Even Catalonia and Basque differed in how strongly determined for the separation of the region from Spain. The people of the Basque region maintained their own language and
considered themselves to be completely different from the Spaniards. On the other hand,
I Besides these tvo reon re regional parties exist in almost ever- region.
residents of Catalonia recognized themselves as both Catalonian and Spanish (Moreno et. al., 1997).
To some degree, the economic competition theory by economists can be employed to explain Catalonia's situation. Catalonia was the wealthiest region in Spain; it represented almost 20% of the gross domestic product, possessed the largest savings account in the country, and boasted a below-average national unemployment rate. As a matter of fact, up until the mid 1980's, the Catalans exclusively enjoyed the central government's encouragement of foreign investment into less developed communities of Spain.
However, the government then began to direct investment selectively, and Madrid started to catch up. As a result, Catalans felt economically threatened and demanded more autonomy. Politically, it inspired the nationality of Catalonia and the organization of the regional party, Convergencia i Unio. 12
In particular, the people of Catalonia did not like the idea of being taxed and then having their wealth redistributed to poorer regions in Spain, such as Andalucia. The recent study about Catalan voters' identity reported that Catalans maintained "dual identity"' and different voting behaviors, depending on the nature of election. Generally speaking, they supported CiU for the local and regional levels of government, while giving more support to other parties such as the Spanish Socialist Workers Party (PSOE) when it came to national elections. (Moreno et. al., 1997).
Regardless of the different degrees of separation movement in these two regions, the regional identity among residents was still sufficiently strong. This regional identity came from ethnic and cultural cleavages that had been oppressed due to the centralization policy of the authoritarian Franco governance. After the death of Franco, the enhanced
12 The Financial Times, November 16, 1990.
democratic environment that resulted can be used to explain the surge of regionalism in this country in recent years.
Both Catalonia and Basque had regional parties that represented the regions' interests and separation policies. The regional party of Catalonia was Convergencia I Unio. The party had been a stronghold in the regional government. The Basque region had more than one regional party. Among them, Partido National de Vasco was the most prominent one.
First, I regress the liking of a party based on regions only. As seen in Table 6, many of the regions were significantly related with the liking of each party. For instance, Andalucia was negatively and significantly related with a person's liking of the People's Party. However, when other factors were controlled, the coefficient lost its statistical power. Galicia did not show any difference in limited from full regression. Neither of the People's Party and PSOE were particularly favored in Galicia region.
Catalans showed distrust to the People's Party. In both of preference regression and actual voting decision regression, the coefficient of Catalonia was negative and significant. The region's statistical power was significant in the full regression, too. On the other hand, PSOE was significant in the limited regression, but it lost its statistical power in the full regression. The preference of CiU by Catalans was positive and significant in both regressions. Yet, the magnitude decreased in the full regression.
Voters living in the Basque region wholeheartedly supported the PNV. Unlike Catalans, Basque voters did not show any preference towards the PSOE. In addition, their distrust towards national parties such as the PP and the PSOE were maintained in the full regression.
Some socioeconomic variables were also important. As expected, the union membership was negatively and significantly related to the respondent's preference level for the People's Party. On the other hand, the less educated people tended to favor the PSOE. Both of the CiU and the PNV were favored by more educated people.
Economic improvement and performance by the government did not have any particularly effect on any party. Ideological distance was an important variable. In all
four parties, a respondent liked a party better when the party had a smaller ideological
distance.
The results of the actual voting decision regression were similar to the results of the party preference regression.13 Most regional significances faded away as more variables were introduced. Andalucia, Aragon, Asturias, Basque and Valencia were all significantly related to PP or PSOE when only regional variables were regressed. However as more variables were included, the effect was removed. Only the Catalan people's dislike of the PP persevered after the full regression was performed.
Socioeconomic variables were not of much importance to the Spanish voters. Only those who were older and thought that the economy had improved were positively and significantly related to the voting for the PP. In terms of the PSOE, it was found that less educated voters preferred the party.
On the contrary, ideological distance was an important variable for the voting decision. However, the magnitude of the variable was much smaller than that of the
13 In voting decision regression, voting for CiU and PNV is not included. The respondents who have voted
for these two parties are practically only those who are residing in these regions. Thus, it is not very useful information to see the regionalism that we are talking here. Therefore, I only used the vote for the PP and the PSOE as dependent variables. Fortunately, many regions appears to have have significant vote choice difference between these two regions. Regression analysis shows whether there is any significant different voting choice for two national parties by regions.
regional variables. In conclusion, regions seemed to be the most important factor in determining the vote of Spanish electorates. However, in most cases, regional effects disappeared after the full regression was performed. Catalans nonetheless maintained their animosity towards the PP, even in the full regression. Thus, in Spain, regional variables were less influential on voting decision than on the preference of a party.
The UNITED KINGDOM
Regionalism in the United Kingdom has been a topic of interest amongst many scholars. For example, Hechter's famous "internal colonialism" theory stipulates that England had politically and economically exploited Celtic fringe, which consequently resulted in regional conflict and protest by these regions (Hechter, 1975). His theory triggered many heated debates over ethno regionalism in advanced countries.
The United Kingdom is divided into four broad regions: England, Wales, Scotland and Northern Ireland. England is regarded as the 'center' of the United Kingdom. Wales has its own regional party, Plaid Cymru (PC), which was established back in 1925. Although PC is not a significant player in national politics, it still received a sizable vote share in the Wales region. Scotland also has its own regional party, the Scottish National Party (SNP). The SNP was founded in 1934. Although they are not that popular nowadays, they were at their prime back in the 1970s. However, factors such as the failure of the devolution movement, economic downturns, and the
Conservative government's centralization withered the party's strength. The political turmoil in the Northern Ireland region is well known. There are a number of regional
parties in Northern Ireland. The most notable four parties are the Ulster Unionist Party (UUP), the Democratic Unionist Party (DUP), the Sinn Fein (SF) and the Social Democratic and Labor Party (SDLP). The big party cleavage in Northern Ireland is unionist versus nationalist. The Ulster Unionists Party and the Democratic Unionist Party are on the unionist's side, while the Sinn Fein and Social Democratic and Labor Party are on the nationalist's side. The electoral results of the 2001 general election in the United Kingdom can be found in Table 8.
Aside from Northern Ireland, the Labor Party outperformed the Conservative Party in many regions. In particular, the Conservative Party was much weaker in Wales and Scotland than in England. Also, regional parties ranked as the second or third most important party in each region.
The dependent variables are "the preference of a party" and "vote choice" that a respondent made in the 1997 general election. The CSES survey included the following political parties: the Labor Party, the Conservative Party, the Liberal Democrats, the Scottish National Party, and the Plaid Cymru. However, it was impossible to use the SNP and the PC as dependent variables, because these two parties were purely regional parties and did not even nominate a candidate in other regions. Therefore, only those residing in Scotland gave their preference level of the SNP and the SNP as their vote choice. Only respondents living in the Wales region chose the Plaid Cymru, and thus this makes the regression analysis impossible. Therefore, it was meaningless and implausible to perform the regression with the SNP and the Pc as the dependent variable. Therefore, I was forced to choose only the Labor Party, the Conservative Party, and the Liberal Democrats as dependent variables.
The survey of the UK also lacked the urban residency question. Thus, the urbanite variable was not used as the independent variable here. One twist in regional variable is made for England. The CSES data did not have all four regions of the United Kingdom. Northern Ireland was not included in the survey. Because East Anglia had only 129 respondents, I took it out of the England region in order to avoid the perfect multicollinearity problem. The regression result can be seen in Table 9.4
First, when regions were the only independent variables, living in the Wales and Scotland regions significantly influenced both parties' preference level. Living in Wales and Scotland enhanced the liking of the Labor Party to .865 and .616, respectively. Nevertheless, the liking of the Conservative Party decreased to -1.576 and -1.548, respectively.
When factors such as socioeconomic background, opinion about the economy, and political inclination were considered, regions no longer had an effect on the
preference level for the Labor Party. On the other hand, the Conservative Party was still disliked by the residents of Wales and Scotland, even after all other variables were controlled. The magnitude of coefficients was reduced to half as was the previous regression with only regional variables.
According to the results, those who were less educated, had lower income, and were union members favored the Labor Party. On the other hand, those who had higher
income and who were not union member favored the Conservative Party.
In addition, those who thought that the economy had worsened favored the Labor Party, while those who thought that the economy had improved favored the Conservative
14 The Liberal Democrats was not used as dependent variable, either, because regions did not show any
significance when they were regressed on the Liberal Democrats. Here, I only report the Labor and the Conservative parties.
Party. The survey was conducted when the government was being transferred into the hands of the Labor Party, which ended the long Conservative regime. I made the assumption that electorates who criticized the Conservative government's
mismanagement of the national economy preferred the Labor Party. Voters who perceived a healthy national economy preferred the Conservative Party.
Religion also played an important role in the liking of a party. Catholics favored the Labor Party, whereas Protestants favored the Conservative Party. Political inclination was significant factor, too. The ideological distance between a respondent and a party had a significant influence on the liking of a political party.
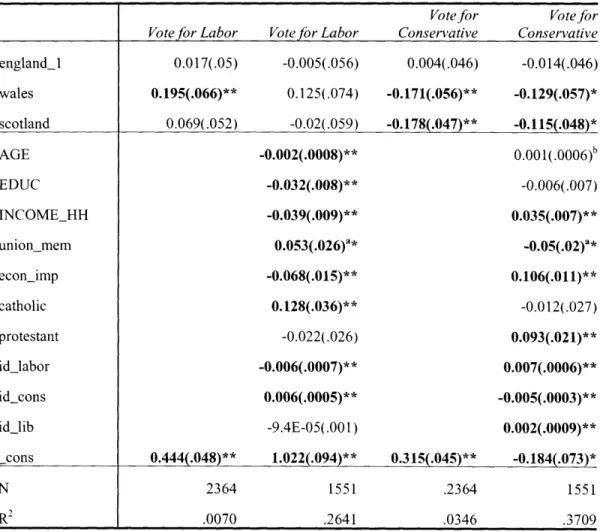
Table 10 demonstrates the regression results that were found when vote choice was used as the dependent variable. Again, I first conducted the regressions with only regional variables. In the case of "vote for the Labor Party", Wales became positively significant. Vote choice for the Conservative Party became negatively significant when an electorate lived in Wales or Scotland.
Now, region became insignificant and almost all other variables became very significant for determining the vote choice for the Labor Party by an electorate. Those who were younger, less educated, earned lower income, were union members, were Catholic, and who perceived the national economy to be poor tended to vote for the Labor Party. Also, as the ideological distance from the Labor Party was shorter and farther from the Conservative Party, an individual was more likely to vote for the Labor Party. 15
Wales and Scotland were still negatively and significantly related with the voting for the Conservative Party after other variables were considered together. Among other
5 The magnitude of ideological distance variable, however, is very small.
variables, income level, union membership, opinion about the national economy, Protestant religion, and ideological distance from each party were significantly related with voting for the Conservative Party. As a person's income became higher and opinion's pertaining to the national economy became more positive, he or she was more likely to vote for the Conservatives. Being a union member was negatively related with the vote choice for the Conservatives, whereas being a Protestant was positively related. The farther ideological distance from the Labor Party and the Liberal Democrats, and shorter distance from the Conservative Party were significant factors.'6
The UNITED STATES
The regional voting behaviors of American electorates were more distinctive in presidential elections than in local or Congressional elections. In recent times, the regional divisions in the presidential elections have become considerably more significant. In the last four presidential elections, there were only sixteen incidents in which a state switched its supporting party. In particular, only two states decided to change their candidate preferences. For example, although Iowa had elected Gore in the 2000 election, they changed to Bush in the 2004 election. New Hampshire, on the other hand, shifted from Bush in 2000 to Kerry in 2004.
Additionally, the average margin between the Democratic presidential candidate and the Republican presidential candidate was 9.67% in 1992. The average margin, however, increased to 16% in the 2004 presidential election. According to American
' The magnitude, however, is much smaller than other variables when compared. It is even smaller than the one in the liking of a party regression.
political scientists, the increase in margins between two parties was not a new issue. Scholars have indicated the increasing incumbent advantages in the election of the House of Representatives in America, and have exhibited the decreasing vote share margins between candidates (Mayhew, 1974; Cover & Mayhew, 1977)17.
In general, the most notable change of the party identification in presidential elections was seen in the South (Miller & Shanks, 1996). The South, which used to be monopolized by the Democrats until the 1960's, started to convert into Republican territory. 8 The 1960 Democrats-supported Civil Rights movement, and the influx of a new population into southern states, can be used to explain this phenomenon. The Northeast had been pro-democratic since the New Deal coalition was established. The West gradually moved towards the Democrats, while the Midwest moved towards the Republicans.
However, it is not yet confirmed whether or not the regional differences in the American presidential elections remain after all other variables are controlled. The regional differences could have resulted from other factors. The regression analysis, therefore, testifies the regional effect in the presidential election in the United States.
Dependent variables include the fondness of each party and the actual vote choice of a respondent, as in the case of the other regression analyses. Aside from the basic independent variables, I also included the religiosity and the ethnicity of the respondent. Although the direct relationship between religiosity and partisanship is not certain, the religiosity is supposed to have an influence on the predisposition of an electorate. It is
17 Gary Jacobson argues that the margin has not vanished. He emphasizes that congressmen feel vulnerable
and spend much more money and effort to bring goods to their districts to secure the seats. (Jacobson.
1987)
i8 Still, many southerners vote for the Democrats in local and Congressional elections.
also supposed to shape the electorate's vote choice (Miller & Shanks, 1996). The religiosity was measured according to how often a respondent went to church. My assumption was that the more frequently a person went to church, the more conservative and the more likely the he or she was to favor the Republicans.
Race is an important explanatory variable in American politics. In particular, African American voters have a very distinct preference for the Democratic candidate. For instance, about 88 % of African American voters voted for John Kerry, the Democratic Party's candidate in 2004 the presidential election. 19 Since the Johnson government's promotion of the Civil Rights movement and pro-welfare policy by the Democrats, African American voters have almost unanimously been voting for the Democrats. Henceforth, the full regression analysis with all the variables included the ethnicity dummy variable.
One important consideration for the United States was the change of ideology variable. In the case of the United States, the CSES data does not have a respondent's perspective on each party's ideological scale. Therefore, I only used the self-measured
ideological scale, which varied from 0 to 10. As explained in the Appendix, the more liberal a person was, the lower the scale was. With the assumption that the more
conservative person was more likely to identify with the Republicans, I expected that the positive coefficient of an ideology variable to be related with the Republicans and the negative coefficient with the Democrats.
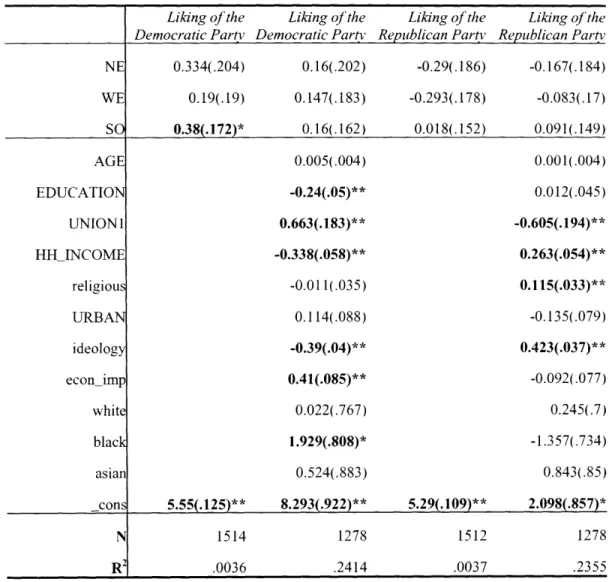
The regression outcomes can be seen in Table 11. The first regression displays the coefficients when only regions were regressed on the party preference. Interestingly,
"' The number is based on the exit poll with 13660 respondents conducted by CNN. http://www.cnn.com/E LECTTON/2004/pages/results/states/US/P/0/epolls.0.html
the South was positively and significantly related with the liking of the Democratic Party. The liking of the Republican Party was not affected by the regional variables.
Nevertheless, when all other variables were considered at the same time, the regional effect of the South disappeared. Instead, independent variables such as education, being a union member, household income, ideology, an opinion about the national economy, and being an African American played significant roles in the liking of the Democratic Party.
The results indicate that less-educated people favor the Democrats. Union members were more likely to side with the Democratic Party. Wealthier people favored the Republican Party more than the Democratic Party. Although being religious does not
affect a person's preference level for the Democratic Party, it was found to be positively and significantly related with a person's liking of the Republican Party. The positive opinion about the national economy helped the Democratic Party. The survey was performed when the Clinton government was in power and the economy was at its prime.
Therefore, the good opinion about the economy benefited the Democrats. Last but not least, racial background played a very significant role in the partisanship. As expected, African American voters strongly favored the Democratic
Party. I believe that the South lost its significant power in the full regression because the voting power of African American electorates was controlled in the regression.20
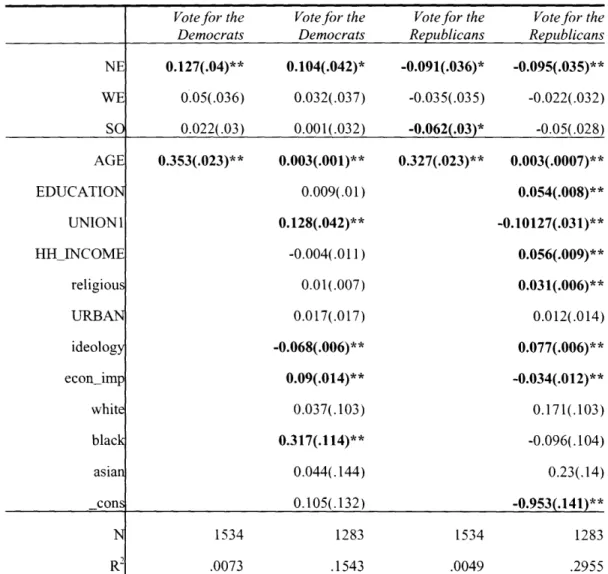
The next regression result pertains to the actual vote choice of the respondent. Interestingly, in an actual voting choice, the South did not have any statistical power in explaining Democratic vote, even when regions were the sole explanatory variables. The
20 Of course, other factors such as household income and education also weaken the statistical significant of
the South in the regression.
South was negatively and significantly related to the Republican vote in the limited regression, but not in the full regression. On the contrary, the regional impact of the Northeast was maintained through all four regressions. Even after all variables were controlled, the statistical significance of the Northeast was sustained. Moreover, the magnitude of coefficients did not change much. In fact, the magnitude of the vote choice of the Republican Party slightly increased in the full regression.
Interestingly, age was significant and positive in all four regressions. This finding supports the claim by a Michigan school that the older a person is, the stronger his
partisanship becomes and the more loyal he or she will be to the party that he or she used to vote for (Campbell et. al., 1960). Those who were highly educated and who earned higher incomes were more likely to vote for the Republican candidate. Being a union member was negatively related with the Republican vote, while it was positively related with the Democratic vote. Again, religiosity was positively related with the vote choice of the Republican candidate, whereas it had no effect on the Democratic vote.
Ideological stance turned out to be quite important. As an electorate became more liberal, the more likely he or she was to vote for the Democratic candidate. On the other hand, being conservative made an electorate vote for the Republican candidate.
Again, African Americans were more likely to vote for the Democratic candidate. This confirms that the ethnicity, particularly being an African American, becomes an important element when we predict a person's vote choice in American politics.2'
In sum, the regional variable did not have much impact on the party preference. Socioeconomic and ethnic factors were used to explain how those living in the South
21 1 also tried the regression analysis with interaction terms of the South and race. The result shows that interaction terms are not significant, but "African American" variable still remains positively and significantly related with the Democratic vote.
seemed to favor the Democratic Party. However, it became insignificant once all other variables were controlled. When it came to the real voting, the South first appeared to be a negative and significant variable. However, this also disappeared in the full regression. The Northeast region stayed with the Democratic Party, even after all other independent variables were considered. The strength of the Democratic presidential candidate in the Northeastern states has been well observed through many presidential elections.
Ideology also played an important role in determining partisanship and the vote choice. Liberal electorates tended to favor the Democratic Party, whereas Conservative tended to favor the Republicans. Since the survey was performed during the Clinton administration, those who thought that the national economy had improved gave credit to the Democratic Party by voting for them. Socioeconomic variables such as age,
education level, union membership, and household income also played a role, depending on the type of regression. An interesting fact was that religiosity was closely related to the liking and vote choice of the Republican Party. However, this was not the case for the Democratic Party.
One of the most important variables was ethnicity. The most noteworthy observation was that African American voters consistently supported the Democratic Party. Once socioeconomic background variables and ideological variables were included, the significance of the South disappeared. The south effect that we saw in the first regression, therefore, can be translated into black voting power.
Interestingly, Northeastern voters consistently voted for the Democratic Party. It is well known that the Northeastern region is the political bastion of the Democrats. Even after all other variables were controlled, the voting for the Democratic Party by the
Northeastern electorates remained strong. It is hard to say whether or not the Northeastern effect in the United States is caused by any cultural or ethnic cleavage.
In sum, the United States case showed mixed signs. The South was not an important regional variable. In fact, the African Americans who resided in the area were the factor that caused the regionalism look of the South. On the other hand, the
Northeastern region was a consistent regional factor.
3. Conclusion
The regression results of this section were somewhat mixed, and therefore this allows us to hypothesize that a region is an unstable variable. The regional variable can be strongly influenced by cultural and ethnic cleavages in a lot of cases. Nevertheless, we also saw the regional voting behavior that cannot be explained by cultural and ethnic cleavages. For instance, the regional voting behaviors of western Canada and
northeastern United States were not based on a cultural cleavage of the region.
In addition, not all the regions with cultural cleavages demonstrated one party's dominance in the region. There were cases where cultural and ethnic cleavage plays an
important role. Nevertheless, their regional voting behavior was not consistent with the full regression analysis, such as in the case of Catalonia and Basque. Therefore, cultural cleavage was not the necessary condition for the existence of the regional party and the region's loyalty to the party.
Hence, the explanations that were based on cultural and ethnic cleavages cannot be applied to every case of a regional party's success and regionally divided electoral
results that we see around the world. Regional voting behavior was seen where the ethnic and cultural cleavage did not exist. Furthermore, where cultural cleavage existed did not always produce regional voting behavior.
Table 1. Regression Variables
Dependent Variables
* Preference of a party: the survey asked respondents to indicate how much they liked a political party, rating each party on a scale from 0 to 10. Marking 0
implied that the respondent disliked the party very much, whereas a 10 implied that the person liked the party very much.
* Vote Choice: the actual vote choice by a respondent. The respondent indicated the party that he or she voted for in the last election. Then, the answer was transformed into a binary variable for each party that was created.
For instance, if a respondent voted for the Republican Party in the latest election, the variable of "republican" was denoted as '1'. If a respondent voted for the Democratic Party, the variable of "republican" was denoted as 'O', while the variable of "democratic" was denoted as '1'.
Independent Variables
* Socioeconomic Variables
43
Age The age of a respondent
Education The highest level of education completed by a
* Economic Factor
Opinion about Economy: The respondent's perception of the state of the economy. 1
for answers that signified that "the economy has become worse," and 5 for answers that signify that "the economy has improved a lot."
* Ideological Factor
Ideological Distance: The ideological distance between a respondent and a party. The
ideological stance of respondent and the respondent's views on each party were coded in the original survey. The ideological distance is the squared term of the difference between a respondent and the respondent's view on each party's ideological stance.
44 education and '8' being a bachelors' degree or higher.
Union Membership Union membership of a respondent. 0 meant that a
respondent was not a union member, and 1 indicated that a respondent was a union member.
Household Income Household income quintile appropriate to a
respondent. The lowest quintile is coded as 1 and the highest as 5.
Urban Residency The type of a residence. 0 if a respondent lived in a
Ideological Distance = (ideological stance of a respondent - ideological stance of a party)2
· Regional dummies
Regional dummies were created for each country. In some cases, regions in the survey were collapsed in order to generate a broader geographical variable.