HAL Id: hal-00317155
https://hal.archives-ouvertes.fr/hal-00317155
Submitted on 1 Jan 2002
HAL is a multi-disciplinary open access
archive for the deposit and dissemination of
sci-entific research documents, whether they are
pub-lished or not. The documents may come from
teaching and research institutions in France or
abroad, or from public or private research centers.
L’archive ouverte pluridisciplinaire HAL, est
destinée au dépôt et à la diffusion de documents
scientifiques de niveau recherche, publiés ou non,
émanant des établissements d’enseignement et de
recherche français ou étrangers, des laboratoires
publics ou privés.
Doppler shift simulation of scattered HF signals during
the Tromsø HF pumping experiment on 16 February
1996
T. D. Borisova, N. F. Blagoveshchenska, I. V. Moskvin, M. T. Rietveld, M. J.
Kosch, B. Thidé
To cite this version:
T. D. Borisova, N. F. Blagoveshchenska, I. V. Moskvin, M. T. Rietveld, M. J. Kosch, et al.. Doppler
shift simulation of scattered HF signals during the Tromsø HF pumping experiment on 16 February
1996. Annales Geophysicae, European Geosciences Union, 2002, 20 (9), pp.1479-1486. �hal-00317155�
Annales Geophysicae (2002) 20: 1479–1486 c European Geophysical Society 2002
Annales
Geophysicae
Doppler shift simulation of scattered HF signals during the Tromsø
HF pumping experiment on 16 February 1996
T. D. Borisova1, N. F. Blagoveshchenskaya1, I. V. Moskvin1, M. T. Rietveld2, M. J. Kosch3, and B. Thid´e4 1Arctic and Antarctic Research Institute, 38, Bering Str., St. Petersburg, 19 9397, Russia
2Max-Plank-Institut f¨ur Aeronomie, D-37191, Katlenburg-Lindau, Germany 3Dept. Communication Systems, Lancaster University, LA1 4YR, Lancaster, UK
4Swedish Institute of Space Physics, Uppsala Division, Box 537, SE 75 121 Uppsala, Sweden
Received: 16 October 2001 – Revised: 21 March 2002 – Accepted: 26 March 2002
Abstract. Comparisons between bistatic scatter
measure-ments and simulation results during the Tromsø HF pumping experiment on 16 February 1996 are made. Doppler mea-surements of an HF diagnostic signal scattered from the field-aligned irregularities (FAIs) in the auroral E-region were car-ried out on the London – Tromsø – St. Petersburg path at 9410 kHz from 21:00 to 22:00 UT. The scattered signals were observed both from natural and artificial ionospheric irregu-larities located in the vicinity of Tromsø. To simulate the Doppler frequency shifts, fd, of scattered signals, a radio channel model, named CONE, was developed. The model allows for ray tracing, group and phase paths, and Doppler frequency shift calculations. The calculated Doppler shifts were analyzed for dependence on the magnitude and direc-tion of plasma velocities in the scattering volume. It was found that the velocity components in the north-south direc-tion are crucial for explaining the Doppler frequency shifts of the scattered diagnostic signals. To simulate fd, real veloc-ities obtained from the EISCAT UHF radar at an altitude of 278 km and from the digital all-sky imager during the exper-iment were employed. The simulation results of Doppler fre-quency shift variations with time are in reasonable agreement with the experimental Doppler shifts of scattered signals on the London – Tromsø – St. Petersburg path.
Key words. Ionosphere (active experiments; ionospheric
ir-regularities) Radio science (ionospheric propagation)
1 Introduction
Modification experiments in which the nightside auroral ionosphere is irradiated by powerful HF radio waves have revealed a multitude of nonlinear phenomena caused by the interaction of the HF pump wave and ionospheric plasma (Djuth et al., 1985; Noble et al., 1987; Blagoveshchenskaya et al., 1998a, 1999, 2001; Brandstr¨om et al., 1999). One
Correspondence to: N. F. Blagoveshchenskaya
(nataly@aari.nw.ru)
of the prominent phenomena from HF modification experi-ments is the generation of artificial field-aligned irregularities (AFAIs) with scale sizes of the order of a few meters across the magnetic field lines. At high-latitudes AFAIs can be ex-cited not only in the F-region, but in the auroral E-region as well. Recent studies of these heater-induced irregularities in the F2-layer of the ionosphere showed that their motion was consistent with the background plasma drift (Eglitis et al., 1998).
In an earlier publication, Blagoveshchenskaya et al. (2001) examined the experimental results from Tromsø HF pumping experiments in the nightside auroral E-region. Bistatic scat-ter measurements were carried out on the London – Tromsø – St. Petersburg path using the Doppler spectral method from St. Petersburg at a distance of about 1200 km from Tromsø. It was shown that the scattered signals were observed both from natural and artificial ionospheric irregularities during the HF pumping experiment on 16 February 1996.
The present paper concentrates on the simulation of di-agnostic HF scattered signals on the London – Tromsø – St. Petersburg path during the Tromsø HF pumping experi-ment on 16 February 1996. The goal is to compare the sim-ulated and observed Doppler frequency shifts fd of the di-agnostic HF signals scattered from field-aligned small-scale irregularities. To simulate fd, plasma velocities in the scat-tering volume obtained from EISCAT UHF radar (Rishbeth and van Eyken, 1993) measurements, as well as from digital all-sky imager (DASI) (Kosch et al., 1998) observations were employed. DASI is located at Skibotn, about 50 km from the EISCAT HF pump facility.
2 Observational results
Bistatic scatter measurements of HF diagnostic signals were carried out on the London – Tromsø – St. Petersburg path at 9410 kHz. Ionospheric modification was produced by the EISCAT HF heating facility (Rietveld et al., 1993) located near Tromsø (geographical coordinates 69.6◦N, 19.2◦E,
1480 T. D. Borisova et al.: Doppler shift simulation of scattered HF signals
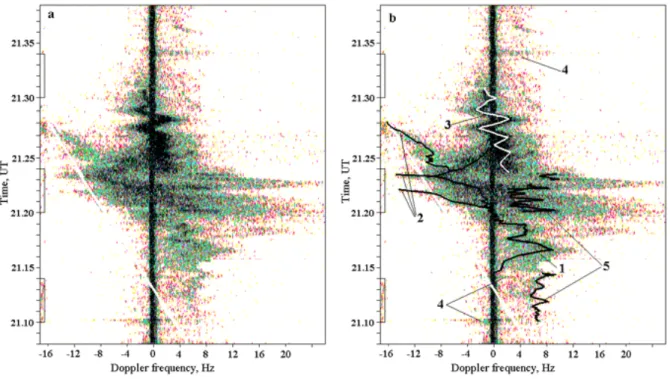
Fig. 1. Dynamic Doppler spectra (sonogram) of HF diagnostic signals on the London – Tromsø– St. Petersburg path at 9410 kHz during the Tromsø HF pumping experiment on 16 February 1996. Direct signal propagating from the transmitter to the receiver along a great circle path corresponds to 0 Hz Doppler frequency. The intervals when the Troms heater was turned on are marked by bars on the time axis: (a) raw dynamic Doppler spectra; (b) dynamic Doppler spectra with five types of Doppler tracks displayed on the sonogram. The following Doppler tracks can be recognized from the sonogram: (1) the long-lived track from 21:10 to 21:26 UT with Doppler frequency shifts changing from positive to negative values; (2) the negative tracks of 21:20–21:22 UT, 21:22–21:23 UT and 21:24–21:28 UT with increasing negative values of Doppler frequency shift; (3) the wave-like track with periods of about 100–120 s observed from 21:23:30 to 21:30:30 UT; (4) burst-like Doppler tracks closely related to the points in time at which the Tromsø HF heating facility is turned on or off; (5) wave-like tracks closely related to the heater-on periods of 21:10–21:14 and 21:20–21:24 UT.
L = 6.2, magnetic dip angle I = 78◦). The exper-iment was conducted on 16 February 1996 from 21:00 to 23:00 UT. The main parameters of the Tromsø heater were the following: heater frequency = 4040 kHz; polariza-tion = O-mode; effective radiated power (ERP) = 150 MW; transmission scheme = 4 min on /6 min off. The antenna beam was tilted 6◦ to the south, allowing for HF pumping in a near field-aligned direction. The diagnostic HF trans-mitter is located near London (52◦N, 0◦E). The reception of diagnostic waves, scattered from field-aligned irregularities (FAIs) above Tromsø, was made using the Doppler spectral method from St. Petersburg (60◦N, 30.5◦E).
During the experiment the Tromsø dynasonde showed the presence of a sporadic Es layer. However, foEs remained less than the heater frequency fH during the first two heater-on periods (21:00–21:04 UT and 21:10–21:14 UT). Hence, the pump wave was not reflected from Es layer. Since the electron density was low in the F2-layer as well, the HF pump wave was not reflected from the ionosphere at all. In the following, heater-on periods foEs exceeded fH, result-ing in reflection of the powerful HF radio wave from the spo-radic Es layer.
Figure 1 shows the dynamic Doppler spectra on the
Lon-don – Tromsø – St. Petersburg path obtained on 16 Febru-ary 1996 from 21:08 to 21:40 UT. Figure 1a shows the raw dynamic Doppler spectra. The spectral structure of the HF signals scattered from FAIs is quite complicated. However, analysis of the dynamic Doppler spectra allows for five dif-ferent types of Doppler tracks to be identified, as shown in Fig. 1b.
The first type of track (track 1) was observed continu-ously from 21:15 to 21:26 UT, irrespective of whether the HF heater was turned on or off. The distinctive feature of this track is the change in sign of the Doppler frequency shifts fd from positive to negative, that takes place at 21:20 UT. Upon reaching the maximum negative value of fd at 21:23 UT, track 1 turns back towards a zero Doppler frequency shift.
Tracks 2 are negative with increasing negative values of Doppler frequency shift from 21:20–21:22 UT, 21:22– 21:23 UT, and 21:24–21:28 UT.
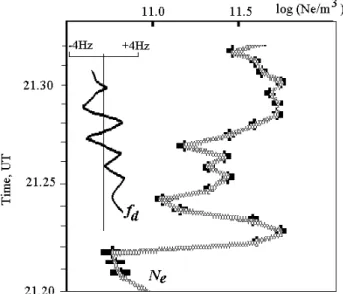
A very intense wave-like track (track 3) with a period of about 100–120 s appeared at 21:23:30 UT at the end of the heater-on period of 21:20–21:24 UT. Its duration was about 7 min. It was found that variations of Doppler fre-quency shift with time are in a good agreement with electron density changes over Tromsø. A comparison between fd
T. D. Borisova et al.: Doppler shift simulation of scattered HF signals 1481
Fig. 2. Temporal variations of electron density Ne at 150 km
alti-tude from Tromsø EISCAT UHF radar measurements and Doppler frequency variations fdcharacterizing track 3 on 16 February 1996.
variations characterizing track 3 and Ne changes at an alti-tude of 150 km from EISCAT UHF radar measurements at Tromsø is shown in Fig. 2.
An interesting feature of the HF pumping experiment on 16 February 1996 is exhibited by the fourth type of track (track 4). These burst-like tracks are closely related to the point in time at which the Tromsø heater is turned on and off. The duration of the burst-like tracks is about 10–15 s. When turning on the Tromsø HF heater, a burst in fd to
−10 Hz occurs in the negative part of the Doppler sonogram. HF heater turn off leads to the appearance of a fd burst to +8 Hz in the positive part of sonogram. The most pronounced burst-like tracks were observed in the heater-on periods of 21:10–21:14 UT and 21:30–21:34 UT. It is interesting to note that similar negative burst-like Doppler tracks were ob-served from bistatic scatter measurements when turning on the SURA heating facility (see Fig. 6 of Blagoveshchenskaya et al., 1998b).
During the pump cycle of 21:10–21:14 UT the powerful HF radio wave was not reflected from the ionosphere due to
fH exceeding foEs (fH > foEs). In addition, the heater frequency fH was equal to the upper hybrid frequency fU H, i.e. fH2 = fU H2 = fo2Es+fc2, where foEsis the maximum frequency of the sporadic Es layer and fc is the cyclotron frequency. Note that the excitation of artificial field-aligned irregularities in the auroral Es layer is possible with the con-straint fH > foEs, but fH2 = fo2Es +fc2, as described by Djuth et al. (1985).
The fifth type of track is closely related to the heater-on pe-riods of 21:10–21:14 UT and 21:20–21:24 UT. These wave-like tracks, with periods of about 80–120 s, are displayed in the positive part of the Doppler sonogram. During the HF pumping cycle of 21:10–21:14 UT the appearance and dis-appearance of the fifth type of track coincides in time with
the burst-like heater-induced tracks of the fourth type. As a result, it is believed that this track was produced by HF diag-nostic signals scattered from artificial field-aligned irregular-ities.
It is of interest to compare the observed wavy tracks with the behaviour of the X and Y components of the magnetic field variations at Tromsø. In order to do this, the spectral components of fd, X and Y were computed. The compari-son showed an absence of correlation between the Doppler frequency shift variations and magnetic field variations.
The Doppler tracks shown in Fig. 1b suggest that the scat-tered signals were observed both from natural (first, second and third types) and artificial (the fourth and fifth types) field-aligned irregularities.
3 Modelling
The problem of HF radio-wave propagation in an inhomo-geneous anisotropic (magnetoactive) ionosphere was solved within the framework of the geometric optics method. In this context, the solution of the wave equation and determination of the ray path is an Eikonal function solution. The solution of the Eikonal function is equivalent to finding the depen-dence of ω = ω(k), where ω is the wave (angular) frequency (ω = 2πf ), and k is the wave vector. Taking into account the canonical equations for a ray (Budden, 1985) and the Eikonal function (Kravtzov, 1980), the following system of differen-tial equations for an inhomogeneous anisotropic medium are derived: dr dt =2c 2 k − 1 2 ω2∂n2 c2∂k !, ∂ω2n2 ∂ω dk dt =ω ∂n ∂r ∂ωn ∂ω (1) dω dt = −ω ∂n ∂t ∂ωn ∂ω .
The refractive index may be written as (Ginzburg, 1967)
n21,2=1−
2v(1 − v)
2(1 − v) − u sin2α ±pu2sin4α +4u(1 − v)2cos2α, (2)
where u and v are determined by
v =ω 2 0 ω2 = 4π e2Ne mω2 , √ u = ωH ω = |e|H0 mcω .
Here e and m are the electron charge and mass; c is the speed of light; α is the angle between the wave vector k and mag-netic field H(0), ω0is the electron plasma frequency, and ωH is the electron gyrofrequency.
On the basis of the equation system (1) and taking into account expression (2) for the refractive index, a radio chan-nel model, named CONE, was developed. It permits the ray
1482 T. D. Borisova et al.: Doppler shift simulation of scattered HF signals
Fig. 3. Sketch of the geometry of the scattered signals from moving field-aligned irregularities. Digits (1) and (2) correspond to the dif-ferent modes of the signals scattered from FAIs above Troms. Signs “+” and “–” in Doppler frequency shift are in accordance with the movements of FAIs in the direction of the receiver (+fd) and from
the receiver (−fd).
traces, as well as the group and phase paths to be calculated. The numerical solution of equation system (1) is performed in the standard way (Haslegrove, 1955) as the solution of the differential equations of radio-wave propagation in a mag-netoactive plasma using Runge-Kutta methods in spherical coordinates.
The propagation direction of the HF diagnostic wave on the London – Tromsø – St. Petersburg path is given by two great circle paths as follows: the first path is from the diag-nostic transmitter (London) to the scattering volume above Tromsø and the second one is from the scattering volume to the receiver (St. Petersburg). The boundary condition for linking the solutions for the two propagation paths is the FAI-induced scattering cone, given by
(ko·H ) = (ks·H ) , (3)
where ko and ks are the wave vectors of the incident and scattered wave, correspondingly, and H is the vector of the Earth’s magnetic field. The simulation of the geometry of the diagnostic HF signals scattered from FAIs in the auroral E-region on the London – Tromsø – St. Petersburg path was considered by Blagoveshchenskaya et al. (1999).
The CONE program also calculates the Doppler shift of scattered signals. To do this, we have taken into account not only the spatial-temporal electron density changes, but also the movements of the ionospheric plasma in the scattering volume. The latter is simply solved by the use of the local-ity principle for the phases (φ) on the moving boundary A (Kravtzov, 1980), written as φinc A=φscat A. (4)
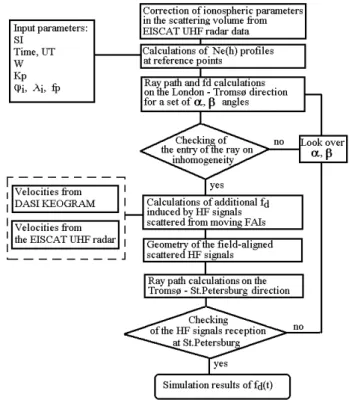
Fig. 4. Schematic of the algorithm of the CONE radio channel model.The following designations are used: SI - solar declination (day number of year); W - Wolf number; Kp- planetary index of
magnetic activity; φi, λi - geographical coordinates of transmitter,
receiver and the scattering region; fp- operational frequency; fd
-Doppler frequency shift; α, β - angles of the radiation in the vertical (elevation) and horizontal (azimuth) plane, respectively; FAIs -field-aligned irregularities.
Differentiating Eq. (4) in time, one obtains the following re-lation
−ωinc+(ko·V ) = −ωscat+(ks·V ) , (5) where V is the velocity of irregularities.
Figure 3 shows a sketch of the geometry of HF diagnos-tic signals scattered from moving FAIs. Bulk movement of the FAIs in the direction of the receiver (St. Petersburg) leads to a positive fd in the HF diagnostic signals scattered from these FAIs. When the FAIs are moving in a direction oppo-site to the receiver, the scattered signals have negative val-ues of Doppler frequency shift (–fd). Figure 4 presents the scheme of the CONE radio channel model algorithm.
A global ionospheric model was used in the calculations, combining well-known models of the E-, F1- and F2-layers (Anufrieva and Shapiro, 1976; Chernyshov and Vasil’eva, 1975; Bilitza et al., 1992). The input parameter to the iono-spheric model is an effective analog of the Wolf number Weff,
which takes into account not only the solar activity, but the magnetic activity as well (Blagoveshchensky and Borisova, 1989). The ionospheric model was corrected using real iono-spheric data obtained from the EISCAT UHF radar at Tromsø and vertical ionospheric sounders located at Kiruna (67.8◦N;
T. D. Borisova et al.: Doppler shift simulation of scattered HF signals 1483
Fig. 5. Three-dimensional view of the simulation of the geometry of diagnostic HF signals scattered from E-region field-aligned irreg-ularities on the London - Tromsø - St. Petersburg path at 9410 kHz for the geophysical conditions on 16 February 1996 at 21:20 UT. (1) and (2) indicate the different propagation modes from London to Tromsø and from Tromsø to St. Petersburg.
20.4◦E), Lerwick (60.1◦N; 2◦W), and St. Petersburg (60◦N; 30.5◦E).
Ionospheric parameters are taken from reference points within a geographical region bounded by latitudes 50 and 75◦N and longitudes 5 and 35◦E. The spatial resolution is 2 degrees in latitude and longitude and 5 km in altitude throughout the ionosphere. The electron density for any co-ordinates is found using third order spline-functions. The so-lution for two-point HF propagation on the London – Tromsø path was found by testing exhaustively all elevation and az-imuth angles with a resolution of 0.01–0.05◦ and 0.1–0.5◦, respectively.
Figure 5 displays an example of the simulation of the ray geometry of diagnostic HF radio-waves scattered from field-aligned irregularities in the auroral E-region on the London – Tromsø – St.Petersburg path at 9410 kHz for the geophysical conditions on 16 February 1996 at 21:20 UT (Weff = 80).
From Fig. 5 one can see two modes of radio-wave propa-gation from London to Tromsø. The first one corresponds to one-hop propagation when a diagnostic wave is incident on the scattering volume over Tromsø from above. The sec-ond one is for the radio wave, which comes to the scatter-ing volume from below after reflection from the F2-layer and Earth’s surface. Propagation of the scattered waves from Tromsø to St. Petersburg is also possible on two paths. One of them is direct propagation and the other one is propagation after reflection from the ionospheric F2-layer.
Using the CONE model, calculations of the Doppler fre-quency shifts of scattered signals on the London – Tromsø – St. Petersburg path were performed depending on the di-rection of the plasma velocities in the scattering volume for different magnitudes of velocity. These results are shown in Fig. 6. It is found that the velocity components in the north-south direction are crucial in determining the Doppler frequency shift values of the scattered signals (see Fig. 6).
Fig. 6. Calculated values of Doppler frequency shift fdversus
di-rection of plasma velocity for velocities in the range from 200 to 1000 m/s on the London - Tromsø – St. Petersburg path. Calcula-tions are made for 9410 kHz and an electron density in the scattering volume in the auroral E-region corresponding to f0Es=4700 kHz.
4 Simulation results with moving FAIs
To simulate the Doppler frequency shifts of diagnostic HF signals scattered from FAIs in the vicinity of Tromsø during the experiment on 16 February 1996, real ionospheric move-ment data were employed. Velocities obtained from EISCAT UHF radar measurements and from the digital all-sky imager (DASI) at Skibotn have been used.
4.1 Velocities from EISCAT UHF radar observations
The ionospheric plasma velocities from the EISCAT UHF radar were observed at an altitude of 278 km with 2-min tem-poral resolution. It is assumed that the coupling between the F- and E-regions through the magnetic field lines is per-fect, on average (Hanuise et al., 1986). Hence, plasma ve-locities obtained in the F-region may be employed in the E-region of the ionosphere. Figure 7 illustrates the simu-lation results of Doppler frequency shifts on the London – Tromsø – St. Petersburg path for the geophysical conditions corresponding to the experiment on 16 February 1996. The plasma velocity vectors, from EISCAT UHF radar measure-ments on 16 February 1996, between 21:08 and 21:36 UT, are shown in Fig. 7a. The calculated Doppler frequency shift values between 21:08 and 21:36 UT, taking into account only electron density changes in the scattering volume with 2-min temporal resolution, are shown in Fig. 7b. Figure 7c presents the calculated Doppler frequency shifts of the diagnostic HF signals scattered from FAIs in the auroral E-region, taking into consideration plasma velocities from the EISCAT UHF radar, as well as electron density changes in the scattering volume.
1484 T. D. Borisova et al.: Doppler shift simulation of scattered HF signals
Fig. 7. Simulation results of Doppler frequency shifts on the Lon-don – Tromsø – St. Petersburg path at 9410 kHz for the geophys-ical conditions on 16 February 1996, taking into account the real ionospheric data from EISCAT UHF radar measurements with 2-min temporal resolution: (a) plasma velocity vectors from EISCAT UHF radar measurements during the HF pumping experiment on 16 February 1996; (b) Doppler frequency shifts versus time, tak-ing into account only electron density changes in the scattertak-ing vol-ume; (c) Doppler frequency shifts versus time, taking into account the plasma velocities given in panel “a”, as well as electron density changes in the scattering volume.
4.2 Velocities from optical measurements
It can be assumed that the movement of FAIs in the scat-tering volume at auroral E-region altitudes above Tromsø is consistent with the movement of the visible aurora. Based on this assumption, a method was developed for finding veloci-ties from optical data which were then used to calculate the Doppler frequency shifts of HF diagnostic signals scattered from FAIs on the London – Tromsø – St. Petersburg path. Simulation results of Doppler frequency shifts (see Fig. 6) have shown that the north–south component of the FAI ve-locities is crucial for bistatic HF scatter measurements on the London – Tromsø – St. Petersburg path. It is possible to find the north–south component of the FAI velocities from auro-ral optical data based on DASI keogram data (latitude-time plot) shown in Fig. 8a, which shows the luminosity intensity at a fixed longitude (19.25◦E) using geographic latitude-time
Fig. 8. Simulation results of Doppler frequency shifts on the Lon-don – Tromsø – St. Petersburg path at 9410 kHz for the geophysical conditions on 16 February 1996, taking into account the velocity of auroral arc movements on the longitude of Tromsø (19.25◦E) from the DASI keogram: (a) the DASI keogram; (b) velocities from the DASI keogram; (c) Doppler frequency shifts versus time, taking into account the velocities of auroral arcs shown in panel “b”, as well as electron density changes in the scattering volume from EIS-CAT UHF radar measurements shown in Fig. 2.
coordinates and 10 s resolution data. Initially, smoothed iso-lines of equal luminosity were determined. Then the velocity was calculated as a time derivative 1y/1t , where 1y is the change of latitude (in km) for the same isoline. Figure 8b presents the north–south component of velocities obtained from the DASI keogram. The velocities obtained were in-cluded in the calculation of Doppler frequency shift fd on the London – Tromsø – St. Petersburg path, which are shown in Fig. 8c. There are five Doppler tracks corresponding to five different auroral movements in the DASI keogram dur-ing the experiment on 16 February 1996 between 21:10 and 21:35 UT. Velocities obtained from the DASI keogram
char-T. D. Borisova et al.: Doppler shift simulation of scattered HF signals 1485
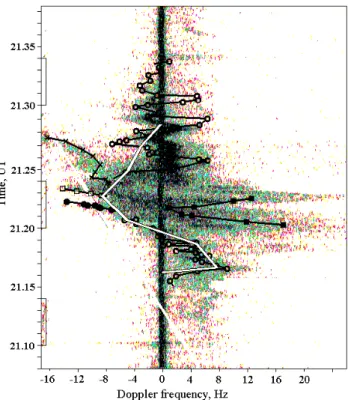
Fig. 9. Comparison between simulation results of Doppler fre-quency shifts fd and experimental dynamic Doppler spectra at 9410 kHz on the London – Tromsø – St. Petersburg path during the HF pumping experiment on 16 February 1996. The white continu-ous line shows the calculated values of fd from Fig. 7c; the solid
black lines present the calculated values of fdshown in Fig. 8c.
acterize movements in the auroral E-region, which is the region where the diagnostic HF signals are scattered from FAIs. The Doppler frequency shift simulation on the Lon-don – Tromsø – St. Petersburg path takes into account not only velocities from the DASI keogram, but also electron density changes in the scattering volume above Tromsø as well (Fig. 2).
5 Comparison between simulation and observations
Figure 9 shows the comparison between the simulated Doppler frequency shifts and experimental dynamic Doppler spectra at 9410 kHz on the London – Tromsø – St. Petersburg path during the experiment on 16 February 1996. Doppler frequency shifts calculated on the basis of real velocities ob-tained from the EISCAT UHF radar (white solid line), as well as from the DASI keogram data (black solid tracks) are over-laid on the experimental observations. Prior to 21:15 UT, there was no similarity between simulated and experimen-tal Doppler frequency shifts (see Figs. 1b, 7c and 8c); hence these simulation data are not shown. Figure 9 shows that the observed and simulated results are in satisfactory agreement from 21:16 to 21:33 UT.
The use of ionospheric plasma velocities from the EIS-CAT UHF radar at an altitude of 278 km, obtained with 2 min
temporal resolution, replicates on the whole the behaviour of the Doppler frequency shifts of the HF diagnostic wave scat-tered from FAIs in the E-region, as described by the long-lived track (track 1 in Fig. 1b). The best agreement be-tween the simulated and observed fd took place from 21:16 to 21:23 UT. This time interval is characterized by agreement not only in a qualitative sense, but in a quantitative sense as well. Moreover, through that time, the calculated Doppler shifts, taking into account the velocities of FAIs obtained by two different methods, including the EISCAT UHF radar and DASI, correspond closely to one another.
The velocities in the auroral E-region from the DASI keogram with 10 s resolution adequately describes not only the fine structure of long-lived track 1, but the tracks with increasing negative values of fd during 21:20–21:22 UT, 21:22–21:23 UT, and 21:24–21:28 UT (tracks 2) as well. Track 2 is in close agreement with the poleward movement of the visible auroral forms (see Fig. 8). However, the very intense wave-like track (track 3) cannot be explained by the DASI velocities. Although the simulated track 3 has wavy fd variations, they are inconsistent with the experimental data of Doppler shifts both in phase and amplitude.
The heater-induced tracks on the Doppler sonogram (tracks 4 and 5) cannot be explained by the CONE model. The burst-like tracks (track 4), appearing when the Tromsø HF heater is turned on or off, may be related to the parametric decay instability. Since the CONE model does not take into account effects produced by the gradients of the HF pump wave electric field, it cannot explain tracks 4. Likewise, heater-induced track 5 also cannot be explained by the CONE model. There are some grounds to believe that the motion of the heater-induced small-scale irregularities in the auro-ral E-region is not always consistent with the background plasma drift. Supporting evidence includes a similar Tromsø HF pumping experiment carried out on 17 February 1996 in the nightside auroral ionosphere (Blagoveshchenskaya et al., 1998a). During this experiment on the London – Tromsø – St. Petersburg path, the pump wave reflected from a sporadic
Es layer and well-defined heater-induced Doppler tracks were observed. They were registered only during heater-on periods with small constant Doppler shifts, in spite of the fact that the EISCAT UHF radar observations showed large velocities of the background plasma from 500 to 1000 m/s in the north–south direction. This observation provides evi-dence that the motion of the heater-induced irregularities in the nightside auroral ionosphere is not always the same as the motion of the background plasma.
After 21:30 UT, scattered diagnostic signals on the Doppler sonogram are not observed. A possible reason is that the correct geometry of diagnostic HF radio waves scattered from FAIs in the auroral E-region is no longer valid. This could be due to a lowering of the FAI altitude from 120 to 100 km that would lead to the absence of scattered signal re-ception at St. Petersburg.
1486 T. D. Borisova et al.: Doppler shift simulation of scattered HF signals
6 Conclusions
A model for calculations of parameters of HF radio waves scattered from field-aligned small-scale ionospheric irreg-ularities has been developed. It allows for ray tracing, group and phase paths, and Doppler frequency shift calcu-lations. Comparisons between bistatic scatter measurements on the London – Tromsø – St. Petersburg path and simula-tion results during the Tromsø HF pumping experiment on 16 February 1996 from 21:00 to 22:00 UT are made. Doppler frequency shift fdis calculated on the basis of real velocities obtained from the EISCAT UHF radar measurements at an altitude of 278 km with 2-min temporal resolution, as well as from the DASI keogram using 10 s resolution data.
It was found that the observed and simulated results are in satisfactory agreement from 21:16 to 21:33 UT. The best agreement took place from 21:16 to 21:33 UT, when the cal-culated fd, taking into account velocities obtained from the EISCAT UHF radar and DASI keogram, correspond closely to one another. The velocities in the auroral E-region from optical measurements also describes adequately experimen-tal Doppler tracks with increasing negative values of fd as-sociated with the poleward movement of the visible auroral forms.
The developed model cannot explain the heater-induced Doppler tracks. On the one hand, it is induced by the fact that the gradients of the HF pump wave electric field are ignored. On the other hand, it may be suggested that the motion of the heater-induced irregularities in the auroral E-region is not always consistent with the background plasma drift.
It is planned in future to take proper account of the pump wave electric field, the possibility of the excitation of pump-induced Alfv´en waves and other factors.
Acknowledgements. We would like to thank the Director and Staff
of the EISCAT. EISCAT is an International Association supported by Finland (SA), France (CNRS), the Federal Republic of Ger-many (MPG), Japan (NIRP), Norway (NFR), Sweden (NRF), and the United Kingdom (PPARC). Russian authors are grateful to the Russian Foundation of Basic Research, grant N 00–05–64 819. The work of the first two Russian authors was also supported by grants from the Swedish Institute (SI) within the Visby Programme and from Royal Swedish Academy of Sciences (KVA). The second (N. B.) and fourth author (M. R.) were partly supported by NATO Col-laborative Linkage Grant, CLG 97 8226. The Swedish author grate-fully acknowledges financial support from the Swedish National Sciences Research Council (NFR).
Topical Editor M. Lester thanks C. Hanuise and W. Scales for their help in evaluating this paper.
References
Anufrieva, T. A. and Shapiro, B. S.: Geometrical parameters of the ionospheric F2-layer, Nauka Press, Moscow, (in Russian), 1976. Bilitza, D., Rawer, K., Bossy, L., and Gulyaeva, T.: International Reference Ionosphere – Past, Present, and Future: I. Electron Density, Adv. Space Res., 12, 3, 3–13, 1992. .
Blagoveshchenskaya, N. F., Kornienko, V. A., Petlenko, A. V., Brekke, A., and Rietveld, M. T.: Geophysical phenomena during
an ionospheric modification experiment at Tromsø, Ann. Geo-physicae, 16, 1212–1225, 1998a.
Blagoveshchenskaya, N. F., Chernyshev, M. Yu., and Ko-rnienko, V. A.: Excitation of small-scale waves in the F-region of the ionosphere by powerful HF radio waves, J. Atmos. Terr. Phys., 60, 1225–1232, 1998b.
Blagoveshchenskaya, N. F., Kornienko, V. A., Brekke, A., Ri-etveld, M. T., Kosch, M. J., Borisova, T. D., and Krylosov, M. V.: Phenomena observed by HF long-distance tools in the HF mod-ified auroral ionosphere during magnetospheric substorm, Radio Sci., 34, 715–724, 1999.
Blagoveshchenskaya, N. F., Kornienko, V. A., Borisova, T. D., Thid´e, B., Kosch, M. J., Rietveld, M. T., Mishin, E. V., Luk’yanova, R. Yu., and Troshichev, O. A.: Ionospheric HF pump wave triggering of local auroral activation, J. Geophys. Res., 106, 29 071–29 089, 2001.
Blagoveshchensky, D. V. and Borisova, T. D.: Correction of the HF radio channel model with allowance of the solar and magnetic activity, Geomagn. Aeron., 29, 696–698, (in Russian) 1989. Brandstr¨om, B. U. E., Leyser, T. B., Steen, A., Rietveld, M. T.,
Gus-tavsson, B., Aso, T., and Ejiri, M.: Unambiguous evidence of HF pump-enhanced airglow at auroral latitudes, Geophys. Res. Lett., 26, 3561–3564, 1999.
Budden, K. G.: The propagation of Radio Waves, Cambridge Univer. Press, New York, 1985.
Chernyshov, D. V. and Vasil’eva, T. N.: Prediction of the maxi-mal critical frequencies for W=10,50,100,150,200, Nauka Press, Moscow, (in Russian), 1975.
Djuth, F. T., Jost, R. J., Noble, S. T., Gordon, W. E., Stubbe, P., Kopka, H., Nielsen, E., Bostr¨om, R., Derblom, H., Hedberg, A., and Thid´e, B.: Observations of E-region irregularities generated at auroral latitudes by a high power radio wave, J. Geophys. Res., 90, 12 293–12 306, 1985.
Eglitis, P., Robinson, T. R., Rietveld, M. T., Wright, D. M., and Bond, G. E.: The phase speed of artificial field-aligned irregu-larities observed by CUTLASS during HF modification of the auroral ionosphere, J. Geophys. Res., 103, 2253–2259, 1998. Ginzburg, V. L.: The propagation of Electromagnetic Waves in
plasma, Nauka Press, Moscow, (in Russian), 1967.
Hanuise, C., Hedberg, A., Orsman, J., Nielsen, E., Stubbe, P., and Kopka, H.: Comparison between the ionospheric plasma drift and the motion of artificially induced irregularities as observed by HF backscatter radars, Ann. Geophysicae, 4, 49–54, 1986. Haslegrove, J.: Ray Theory and a New Metod for Ray Tracing,
Proc. Camb. Conf. Phys. Ionosphere, 355–364, (The Physical Society, London), 1955.
Kosch, M. J., Hagfors, T., and Nielsen, E.: A new digital all-sky imager experiment for optical auroral studies in conjunction with Scandinavian twin auroral radar experiment, Rev. Sci. Instr., 69, 578–584, 1998.
Kravtzov, Yu. A. and Orlov, Yu. I.: Geometric optics of inhomoge-neous mediums, Nauka Press, Moscow, (in Russian), 1980. Noble, S. T., Djuth, F. T., Jost, R. J., Gordon, W. E., Hedberg, A.,
Thid´e, B., Derblom, H., Bostr¨om, R., Nielsen, E., Stubbe, P., and Kopka, H.: Multiple frequency radar observations of high-latitude E-region irregularities in the HF modified ionosphere, J. Geophys. Res., 92, 13 613–13 627, 1987.
Rietveld, M. T., Kohl, H., Kopka, H., and Stubbe, P.: Introduction to ionospheric heating at Tromsø., I. Experimental overview, J. Atmos. Terr. Phys., 55, 577–599, 1993.
Rishbeth, H. and vanEyken, T.: EISCAT: Early history and the first ten years of operation, J. Atmos. Terr. Phys., 55, 525–542, 1993.