HAL Id: hal-00317629
https://hal.archives-ouvertes.fr/hal-00317629
Submitted on 23 Sep 2004
HAL is a multi-disciplinary open access
archive for the deposit and dissemination of
sci-entific research documents, whether they are
pub-lished or not. The documents may come from
teaching and research institutions in France or
abroad, or from public or private research centers.
L’archive ouverte pluridisciplinaire HAL, est
destinée au dépôt et à la diffusion de documents
scientifiques de niveau recherche, publiés ou non,
émanant des établissements d’enseignement et de
recherche français ou étrangers, des laboratoires
publics ou privés.
Time evolution of high-altitude plasma bubbles imaged
at geomagnetic conjugate points
K. Shiokawa, Y. Otsuka, T. Ogawa, P. Wilkinson
To cite this version:
K. Shiokawa, Y. Otsuka, T. Ogawa, P. Wilkinson. Time evolution of high-altitude plasma bubbles
imaged at geomagnetic conjugate points. Annales Geophysicae, European Geosciences Union, 2004,
22 (9), pp.3137-3143. �hal-00317629�
SRef-ID: 1432-0576/ag/2004-22-3137 © European Geosciences Union 2004
Annales
Geophysicae
Time evolution of high-altitude plasma bubbles imaged at
geomagnetic conjugate points
K. Shiokawa1, Y. Otsuka1, T. Ogawa1, and P. Wilkinson2
1Solar-Terrestrial Environment Laboratory, Nagoya University, Toyokawa 442-8507, Japan 2IPS Radio and Space Services, Haymarket, New South Wales 1240, Australia
Received: 14 January 2004 – Revised: 9 June 2004 – Accepted: 17 June 2004 – Published: 23 September 2004 Part of Special Issue “Equatorial and low latitude aeronomy”
Abstract. Temporal and spatial evolution of two high-altitude plasma bubbles (evening and midnight) was ob-served on 4 April 2002, at geomagnetic conjugate points at Sata, Japan (magnetic latitude 24◦N), and Darwin, Aus-tralia (magnetic latitude 22◦S), using two 630-nm airglow imagers. The apex height of the bubbles reached ∼1500 km. The upward velocity of the evolution was faster in the evening (∼170 m/s at 20:00–21:00 LT) than around mid-night (∼28 m/s at 23:00–00:00 LT). Bifurcating features of the bubbles into a smaller scale size of ∼50 km were clearly seen for both the evening and midnight bubbles, showing fairly good conjugacy between the Northern and Southern Hemispheres.
Key words. Ionosphere (Equatorial ionosphere; Ionospheric
irregularities); Atmospheric composition and structure (air-glow and aurora).
1 Introduction
Equatorial plasma bubble is commonly seen in the post-sunset equatorial latitudes as a result of the Rayleigh-Taylor instability, where the low-density plasma on the bottomside of the equatorial ionosphere penetrates through the dense
F-layer by polarization electric field (Kelley, 1989). The bubbles, which are recognized as equatorial spread-F on ionograms, have initially been detected by radio-sounding techniques (e.g. Booker and Wells, 1938; Woodman and La Hoz, 1976). Airglow imaging technique, on the other hand, is a powerful tool to detect spatial and temporal evolution of the bubble structures from ground and satellite (e.g. Mendillo and Baumgardner, 1982; Rohrbaugh et al., 1989; Tinsley et al., 1997; Aarons et al., 1999; Sahai et al., 2000; Makela and Kelley, 2003; Sagawa et al., 2003).
Recent development of highly-sensitive cooled-CCD cam-era raises sensitivity and quality of the airglow images.
As-Correspondence to: K. Shiokawa
(shiokawa@stelab.nagoya-u.ac.jp)
sociated with this development, airglow imagers have been installed not only near the equator but also at midlatitudes, where the airglow intensity is relatively low. Mendillo et al. (1997) reported a bubble structure that reaches very high altitudes of more than 1500 km on the basis of midlati-tude airglow-imaging observation at Arecibo, Puerto Rico (18.3◦N, 293.3◦E; geomagnetic latitude: 29◦N, dip angle: 46◦). Kelley et al. (2002) showed spectacular high-altitude plasma bubbles seen in the airglow images at Haleakala, Hawaii (20.7◦N, 203.8◦E; geomagnetic latitude: 21◦N, dip angle: 37◦). Otsuka et al. (2002) were the first to report clear geomagnetic conjugacy of the high-altitude plasma bubble on the basis of conjugate airglow imaging observations at Sata, Japan (31.0◦N, 130.7◦E; geomagnetic latitude: 24◦N,
dip angle: 44◦) and Darwin, Australia (12.4◦S, 131.0◦E;
ge-omagnetic latitude: 22◦S, dip angle: −40◦). However, the
bubbles reported by Otsuka et al. were a “fossil” of the bub-bles, which were already formed near the sunset terminator and drifted into the field-of-view of the airglow imagers with-out changing their shape.
In this paper, we report time evolution of high-altitude plasma bubbles observed on 4 April 2002, at geomagnetic conjugate points at Sata and Darwin. Poleward growth and bifurcation of the bubbles were observed in the field-of-view of all-sky airglow imagers both in the evening (21:00 LT) and around midnight.
2 Observation
The all-sky airglow imagers used in this study were de-veloped in the Solar-Terrestrial Environment Laboratory, Nagoya University, as part of the Optical Mesosphere Ther-mosphere Imagers (OMTIs) (Shiokawa et al. 1999, 2000). The imager at Sata, Japan, has been operating since July 2000. The imager at Darwin, Australia, has been operat-ing since October 2001. The geomagnetic conjugate point of Darwin (28.7◦N, 131.4◦E) is located 250 km southeast of Sata. Airglow images mapped from Darwin to the Northern
3138 K. Shiokawa et al.: Time evolution of high-altitude plasma bubbles COUNT 800 1120 1440 1760 2080 2400
Sata (630.0nm)
12:04UT(a)
N
E
W
S
COUNT 2000 3200 4400 5600 6800 8000Darwin (630.0nm)
12:02UT(b)
COUNT 1600 1880 2160 2440 2720 3000Darwin (777.4nm)
11:56UT(c)
14:42UT(d)
14:44UT(e)
14:56UT(f)
Fig. 1. All-sky airglow images at wavelengths of OI 630.0 nm and OI 777.4 nm observed at (a) and (d) Sata, Japan and (b), (c), (e), and (f) Darwin, Australia, on 4 April 2002. Local time of these stations is UT +9 h. The bubble structures (tree-like depletions of airglow intensity) are extended from south to north at Sata and from north to south at Darwin.
Hemisphere along the geomagnetic field line mostly over-lap the airglow images at Sata, since the field-of-view of an all-sky imager is about 1000 km in diameter. Airglow images at a wavelength of 630.0 nm (OI, emission altitude: 200–300 km) were obtained every 5.5 min and 6 min at Sata and Darwin, respectively, with an exposure time of 165 s. Airglow images at 777.4 nm (OI, emission altitude: 300– 400 km) were also obtained every 30 min at Darwin with the same exposure time. Background continuum emission from the sky were monitored every 30 min at a wavelength of 572.5 nm, to estimate the absolute intensity of these air-glow lines.
These airglow emissions are closely related to the
F-region electron density (e.g. Tinsley et al., 1973; Sahai et al., 1981; Link and Cogger, 1988). The major chemical reactions that generate the 630.0-nm airglow emission are:
O++O2−→O2++O (1)
O2++e−−→O(1D) + O (2)
O(1D) −→ O(3P ) + hν630.0 nm. (3)
Because reaction Eq. (1) dominates the whole process, the production of the 630.0-nm emission is proportional to the molecular oxygen density [O2] and the oxygen ion density [O+]. The oxygen ion density [O+]is nearly equal to the
electron density Nein the F -layer. Thus, the 630.0-nm
emis-sion is a sensitive indicator of the electron density in the bot-tomside of the F -layer.
The chemical reactions that generate the 777.4-nm airglow emission are:
O++e−−→O(5P ) (4)
O(5P ) −→ O(5S) + hν777.4 nm (5) Figure 2 shows the conjugate bubble images (in count rate) of Figs. 1a,b and converted onto a geographical map. The three bubble structures extend from the equator to both the Northern and Southern Hemispheres simultaneously. Note that the bubbles show latitudinal tilts (westward at higher lat-itudes), forming backward “C”-shapes on a global scale.
Figure 3 shows temporal evolution of a plasma bubble seen in the 630.0-nm images at Sata in the evening at 11:04– 12:17 UT (20:04–21:17 LT). All-sky images in Fig. 1 were
converted into geographical images by assuming the peak airglow layer for 630.0-nm emission of 250 km. We focus on the bubble structure seen near the southwest edge of the raw all-sky images in Fig. 1a. Because of the steep gradient of airglow intensity from low to high latitudes, we show de-viation images in units of % from 1-hour running averages, in order to see the shape of the plasma bubbles more clearly. The apex height of the magnetic field line at the equator is shown in the right of the panels, using the IGRF-2000 model. The production of the 777.4-nm emission is proportional to both the oxygen ion density [O+]and the electron den-sity Ne, and [O+]'Ne in the F -layer. Thus, the 777.4-nm
intensity is proportional to the square of the electron density around the F -layer peak.
Figure 1 shows examples of plasma bubbles observed in the 630.0-nm and 777.4-nm airglow images at Sata and Dar-win on 4 April 2002. The bubbles observed in the evening (21:00 LT) and at midnight (00:00 LT) are shown in the upper and lower panels, respectively. Local time (LT) is 9 h ahead of UT at these stations. The three images (Sata, 630.0 nm; Darwin, 630.0 nm and 777.4 nm) were nearly si-multaneously taken. The bubbles, which can be identified as tree-like depletions of airglow intensity, are elongated from the south of Sata and from the north of Darwin. In the images of 777.4 nm, the bubbles show ray-like fine-scale structures. Abalde et al. (2001) suggested that these ray-like structures indicate field-aligned irregularities developed in the bubble.
Fast evolution of a plasma bubble (indicated in blue as a depletion of airglow intensity) toward the higher latitude is seen in the images. The bubble appeared in the bottom of the image around (27◦N, 131◦E) at 11:04 UT (20:04 LT) and developed to (29◦N, 132◦E) at 11:34 UT (20:34 LT). The upward velocity of the bubble at the equator is estimated to be 170 m/s, by taking the apex height of the bubble at 11:04 UT and 11:34 UT to be 1100 km and 1400 km, re-spectively. The airglow depletion in the bubble reaches to
−40% from 1-hour average airglow intensity. The bubble structure shows bifurcations to the right of the main structure from 11:17 UT to 11:34 UT and to the left from 11:47 UT to 12:04 UT (see also Fig. 5). The latter bifurcation produces a smaller branch, which has a width of ∼50 km. This western-side bifurcation can be clearly identified in the raw image in Fig. 1a. The whole structure continuously moved eastward with a velocity of ∼100 m/s.
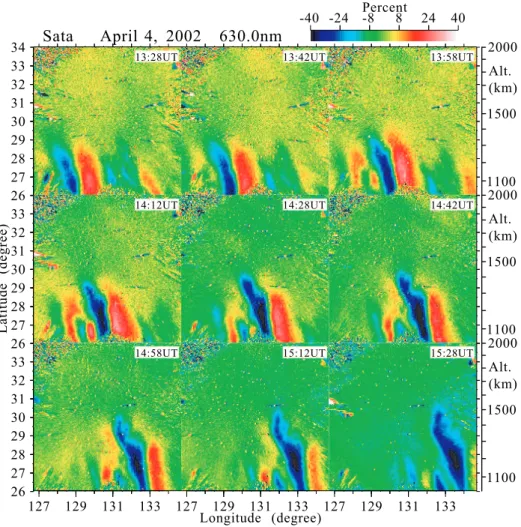
Figure 4 shows temporal evolution of a plasma bubble seen in the 630.0-nm images at Sata around midnight at 13:28– 15:28 UT (22:28–00:28 LT) in the same format as that in Fig. 3. The bubble can be identified as a blue torch-like struc-ture in these panels. This bubble strucstruc-ture was seen in the south of the raw all-sky image in Fig. 1d. The bubble contin-uously moved eastward with a velocity of ∼80 m/s. It slowly evolves poleward, showing bifurcation around the top of the structure with a scale size of less than 50 km. If we take the apex height of the bubble at 13:28 UT and 15:28 UT to be 1350 km and 1550 km, respectively, the upward velocity of the bubble at the equator is estimated to be 28 m/s.
Geographic Longitude
Geographic Latitude
120 125 130 135 140 145
-20
-15
-10
-5
0
5
10
15
20
25
30
35
40
April 4, 2002 1202-1204UT
Magnetic EquatorFig. 2. Plasma bubble images (in count rate) at Sata and Darwin on a geographical map. These images were obtained at 12:04 UT (Sata) and 12:02 UT (Darwin) on 4 April 2002. Note that the bubbles show latitudinal tilts, forming backward “C”-shapes.
To see geomagnetic conjugacy of these bubbles, we show 630.0-nm airglow images nearly simultaneously obtained at Sata and Darwin in Fig. 5, in the same format as those in Figs. 3 and 4. The all-sky images at Darwin were con-verted to geographical coordinates in the Northern Hemi-sphere (same to those at Sata), using the IGRF-2000 geo-magnetic field model (Mandea and Macmillan, 2000). The white curves in the top three panels indicate envelopes of the bubble structures at Sata. The same curves are indicated in the images of Darwin in the bottom three panels for com-parison. For both the evening and midnight events, the cor-respondence of the bubble structures between the Northern and Southern Hemispheres is fairly good, even for the small bifurcated structures with a scale size of less than ∼50 km.
3 Discussion
We observed growth and bifurcation of high-altitude plasma bubbles at geomagnetic conjugate stations at midlatitudes. The correspondence of the bubble growth between the two
3140 K. Shiokawa et al.: Time evolution of high-altitude plasma bubbles
11:04UT 11:17UT 11:34UT
11:47UT 12:04UT 12:17UT
Sata April 4, 2002 630.0nm
Latitude
(degree)
Longitude (degree)
128
130
132
134
128
130
132
134
128
130
132
134
26
27
28
29
30
31
32
33
26
27
28
29
30
31
32
33
34
Percent
-40 -24
-8
8
24
40
2000
1500
1100
Alt.
(km)
2000
1500
1100
Alt.
(km)
Fig. 3. Evolution of the plasma bubble structure seen in the 630.0-nm airglow images at Sata, Japan, at 11:04–12:17 UT (20:04–21:17 LT) on 4 April 2002. The raw all-sky images were converted into geographic coordinates by assuming an airglow height of 250 km. The images are deviations in unit of % from 1-hour running averages. The apex height of the magnetic field line at the equator is shown in the right of the panels. The bubble structure can be identified in blue (depletion of airglow intensity) extending from lower to higher latitudes.
hemispheres is fairly good even for the small-scale structures of less than 50 km. This result indicates that the evolution and bifurcation of plasma bubble occur on the entire field line simultaneously with a horizontal north-south scale size of ∼5000 km, as indicated in Fig. 2.
It should be noted that the bubbles are not often observed at these midlatitude stations. The occurrence of the bubble in the Japanese longitudinal sector peaks around the equinox seasons and during the solar maximum period (Maruyama and Matuura, 1984; Tsunoda, 1985; Sahai et al., 2000), con-sistent with the prereversal enhancement maximum of the background eastward electric field observed at Jicamarca in Peru (Fejer et al., 1991). The event reported here took place during the solar maximum period in the equinox.
The upward velocities of the bubble growth were 170 m/s at 21:00 LT and 28 m/s at 00:00 LT. The value of 170 m/s is consistent to that in the previous literature (e.g. 125–350 m/s by Tsunoda et al., 1981). However, the latter value of 28 m/s at 00:00 LT is much slower than the velocity at 21:00 LT. This fact may indicate dependence of bubble growth speed on bubble age. The bubble-top latitudes in the Sata images start from ∼27◦N in Fig. 3 and ∼29◦N in Fig. 4. Thus, the latter bubble at 00:00 LT might be created earlier and drifted into the Sata field-of-view. The latter (old) bubble might have a smaller upward drift velocity.
The observed bubbles in Figs. 2–5 tilt from west (high altitudes) to east (low altitudes). A similar tilt of the bub-ble has initially been reported by Woodman and La Hoz (1976), Tsunoda et al. (1981) and Mendillo and Tyler (1983) and more recently by airglow imaging from the ground (e.g. Makela and Kelley, 2003) and from satellites (Kelley et al., 2003; Kil et al., 2004). Woodman and La Hoz (1976) initially explained this tilt by height-dependent reduction of eastward drift velocities of the bubbles due to the polarization electric field inside the bubbles. Zalesak et al. (1982) made further theoretical considerations and concluded that this tilt indi-cates velocity shear of the F -region plasma due to the incom-plete coupling of the plasma motion to the eastward neutral wind, depending on the Pedersen conductivities both in the
F-region (lower latitudes) and E-region (higher latitudes). On the other hand, Anderson and Mendillo (1983) explained this westward tilt by the possible latitudinal decrease of zonal wind velocity with increasing latitudes.
The temporal decrease of the eastward drift velocity was detected from the eastward motion of the bubbles (∼100 m/s and ∼80 m/s at 21:00 and 00:00 LT, respectively). Neu-tral wind in the thermosphere was observed on this night through a Doppler shift of 630.0-nm airglow using a Fabry-Perot interferometer at Shigaraki, Japan (34.8◦N, 136.1◦E, about 660 km northeast of Sata) (Shiokawa et al., 2003). The
13:28UT 13:42UT 13:58UT
14:12UT 14:28UT 14:42UT
14:58UT 15:12UT 15:28UT
Sata April 4, 2002 630.0nm
Latitude (degree) Longitude (degree) 127 129 131 133 127 129 131 133 127 129 131 133 26 27 28 29 30 31 32 33 26 27 28 29 30 31 32 33 26 27 28 29 30 31 32 33 34 Percent -40 -24 -8 8 24 40 2000 1500 1100 Alt. (km) 2000 1500 1100 Alt. (km) 2000 1500 1100 Alt. (km)Fig. 4. Evolution of the plasma bubble structure seen in the 630.0-nm airglow images at Sata, Japan, at 13:28–15:28 UT (22:28–00:28 LT) on 4 April 2002, in the same format as that in Fig. 3.
eastward neutral wind velocity on this night decreases from
∼120 m/s at 21:00 LT to ∼50 m/s at 00:00 LT. The observed decrease of the eastward drift velocity of the bubbles proba-bly corresponds to the observed decrease of background neu-tral wind in the thermosphere.
The high-altitude plasma bubbles reported in this paper were observed in the evening (around 21:00 LT) and at mid-night (00:00 LT). It is somewhat unusual to observe the ble growth around midnight, since equatorial plasma bub-bles develop around the evening terminator where the ver-tical drift of the F -layer is often strongly upward (Fejer et al., 1991). Fejer et al. (1999) concluded that the generation of late-night spread-F requires the reversal of the vertical velocity from downward to upward for periods longer than about half an hour.
In order to see nocturnal variation of the ionosphere, we plotted 630.0-nm airglow intensities observed at Sata and Darwin in Fig. 6. The airglow intensities at (27.0◦N, 131.0◦E) and (30.0◦N, 131.0◦E) are extracted from the air-glow images. The plasma bubble passages can be identi-fied as temporal depletions of the intensities, particularly at 27◦N. The intensity decreases from 19:00 LT to 20:30 LT
due to the decrease of F -layer electron density after sun-set. However, it turns to an increase from 20:30–21:00 LT at both Sata and Darwin, and further increases drastically af-ter 23:30–00:00 LT at Sata. These enhancements of 630.0-nm airglow intensity may suggest upward drift of the equa-torial F layer and subsequent supply of electrons to midlat-itudes along the field line, which is consistent with the sug-gestion by Fejer et al. (1999) on the generation of late-night plasma bubbles. Although a magnetic substorm occurs at 20:00–23:00 LT, the Kp index was very small (2− and 2,
6Kp=11) on this night. The ionogram data obtained at
Ya-magawa (∼20 km north of Sata) do not show upward motion of the nighttime F -layer. Thus, global penetration of magne-tospheric electric field and disturbance dynamo seem not to be the cause of the possible F -layer rise on this night. Other dynamic variation of the neutral atmosphere at the equator may contribute to the layer rise and the airglow intensity en-hancement. The drastic enhancement after 23:30 LT at Sata may correspond to a large-scale atmospheric wave propagat-ing from the midnight temperature maximum in the equator (e.g. Colerico et al., 1996; Otsuka et al., 2003).
3142 K. Shiokawa et al.: Time evolution of high-altitude plasma bubbles
11:47UT 12:04UT 14:42UT
11:44UT 12:02UT 14:44UT
April 4, 2002 630.0nm
Latitude (degree) Longitude (degree) 128 130 132 134 128 130 132 134 127 129 131 133 26 27 28 29 30 31 32 33 26 27 28 29 30 31 32 33 34 Percent -40 -24 -8 8 24 40 2000 1500 1100 Alt. (km) 2000 1500 1100 Alt. (km)Sata
Sata
Sata
Darwin
Darwin
Darwin
Fig. 5. Comparison of the plasma bubble structures observed in the 630.0-nm airglow images at Sata, Japan, and Darwin, Australia, on 4 April 2002, in the same format as that in Figs. 3 and 4. The airglow images at Darwin (bottom three panels) are those converted to the Northern Hemisphere using the IGRF magnetic field model. The white curves in the top three panels show envelopes of the bubble structures at Sata. The same curves are indicated in the bottom three panels to compare the bubble structures between Sata and Darwin. The two lines seen at the bottom right of the Darwin images at 11:44 UT and 12:02 UT are airplane trajectories.
10 11 12 13 14 15 16 0 50 100 150 200 250 300 350 400 450 500 550 600
Universal Time (Hour)
Intensity (R)
19 20 21 22 23 00 01 Local Time (Hour)
Sata (30 N)o Sata (27 N)o
Darwin (30 N)o Darwin (27 N)o
630nm Intensity at 131 Eo
Fig. 6. Variation of nocturnal 630.0-nm airglow intensities at Sata and Darwin on 4 April 2002. The intensities were extracted from airglow images at Sata and Darwin at geographic locations of (27.0◦N, 131.0◦E) and (30.0◦N, 131.0◦E) in the Northern Hemi-sphere (Darwin images were converted to the Northern HemiHemi-sphere, as shown in Fig. 5).
4 Conclusion
We reported temporal evolution and bifurcation features of equatorial plasma bubbles, on the basis of airglow imaging observations at midlatitude geomagnetic-conjugate stations (magnetic latitudes: 22–24◦) on 4 April 2002. The bub-bles reach apex heights of ∼1500 km at the equator. The correspondence of the bubble growth between the two hemi-spheres is fairly good, even for the small-scale structures of less than 50 km, indicating that the bubble growth and bifur-cation occur for the entire field line simultaneously with a north-south scale size of ∼5000 km. The observed proper-ties of poleward (upward) and eastward velociproper-ties and the tilt of the bubbles are consistent to the observations and theories reported in previous literature.
Acknowledgements. We thank Y. Katoh, M. Satoh, T. Katoh, and
K. Hidaka of the Solar-Terrestrial Environment Laboratory, Nagoya University, for their kind support of the development and operation of the all-sky imagers. The all-sky imager at Darwin was oper-ated at the ionosonde station of the IPS Radio and Space Services, Australia. This work was supported by Grant-in-Aid for Scientific Research (11440145 and 13573006) and on Priority Area (764) of the Ministry of Education, Culture, Sports, Science and Technology of Japan .
Topical Editor M. Lester thanks H. Kil and another referee for their help in evaluating this paper.
References
Aarons, J., Mendillo, M., Lin, B., Colerico, M., Beach, T., Kintner, P., Scali, J., Reinisch, B., Sales, G., and Kudeki, E.: Equatorial F-region irregularity morphology during an equinoctial month at solar minimum, Space Sci. Rev., 87, 357–386, 1999.
Abalde, J. R., Fagundes, P. R., Bittencourt, J. A., and Sahai Y.: Ob-servations of equatorial F -region plasma bubbles using simulta-neous OI 777.4 nm and OI 630.0 nm imaging: New results, J. Geophys. Res., 106, 30 331–30 336, 2001.
Anderson, D. N. and Mendillo, M.: Ionospheric conditions affect-ing the evolution of equatorial plasma depletions, Geophys. Res. Lett., 10, 541–544, 1983.
Booker, H. G. and Wells, H. W.: Scattering of radio waves by the F -region of the ionosphere, J. Geophys. Res., 43, 249–256, 1938. Colerico, M., Mendillo, M., Nottingham, D., Baumgardner, J.,
Meriwether, J., Mirick, J., Reinisch, B. W., Scali, J. L., Fesen, C. G., and Biondi, M. A.: Coordinated measurements of F re-gion dynamics related to the thermospheric midnight tempera-ture maximum, J. Geophys. Res., 101, 26 783–26 793, 1996. Fejer, B. G., de Paula, E. R., Gonz´alez, S. A., and Woodman, R. F.:
Average vertical and zonal F region plasma drifts over Jicamarca, J. Geophys. Res., 96, 13 901–13 906, 1991.
Fejer, G., Scherliess, L., and de Paula, E. R.: Effects of the vertical plasma drift velocity on the generation and evolution of equato-rial spread F , J. Geophys. Res., 104, 19 859–19 869, 1999. Kelley, M. C.: The Earth’s ionosphere, Plasma Physics and
Electro-dynamics, Academic Press, San Diego, California, 1989. Kelley, M. C., Makela, J. J., Ledvina, B. M., and Kintner, P. M.:
Ob-servations of equatorial spread-F from Haleakala, Hawaii, Geo-phys. Res. Lett., 29, doi:10.1029/2002GL015509, 2002. Kelley, M. C., Makela, J. J., Paxton, L. J., Kamalabadi, F.,
Comberi-ate, J. M., and Kil, H.: The first coordinated ground- and space-based optical observations of equatorial plasma bubbles, Geo-phys. Res. Lett., 30, 1766, doi:10.1029/2003GL017301, 2003. Kil, H., Su, S.-Y., Paxton, L. J., Wolven, Y., Zhang, B. C.,
Mor-rison, D., and Yeh,H. C.: Coincident equatorial bubble detec-tion by TIMED/GUVI and ROCSAT-1, Geophys. Res. Lett., 31, L03809, doi:10.1029/2003GL018696, 2004.
Link, R. and L. L. Cogger: A reexamination of the O I 6300-A nightglow, J. Geophys. Res., 93, 9883–9892, 1988 (correction on J. Geophys. Res., 94, 1556, 1989).
Makela, J. J. and Kelley, M. C.: Field-aligned 777.4-nm com-posite airglow images of equatorial plasma depletions, Geo-phys. Res. Lett., 30(8), 1442, doi:10.1029/2003GL017106, 2003.
Maruyama, T. and Matsuura, N.: Longitudinal variability of annual changes in activity of equatorial spread F and plasma bubbles, J. Geophys. Res., 89, 10 903–10 912, 1984.
Mandea, M. and Macmillan, S.: International geomagnetic refer-ence field – the eighth generation, Earth Planets Space, 52, 1119– 1124, 2000.
Mendillo, M. and Baumgardner, J.: Airglow characteristics of equa-torial plasma depletions, J. Geophys. Res., 87, 7641–7652, 1982. Mendillo, M. and Tyler, A.: Geometry of depleted plasma regions in the equatorial ionosphere, J. Geophys. Res., 88, 5778–5782, 1983.
Mendillo, M., Baumgardner, J., Nottingham, D., Aarons, J., Reinisch, B., Scali, J., and Kelley, M. C.: Investigations of thermospheric-ionospheric dynamics with 6300 A images from the Arecibo Observatory, J. Geophys. Res., 102, 7331–7343, 1997.
Otsuka, Y., Shiokawa, K., Ogawa, T., and Wilkinson, P.: Geomag-netic conjugate observations of equatorial airglow depletions, Geophys. Res. Lett., 29, No.15, doi:10.1029/2002GL015347, 2002.
Otsuka, Y., Kadota, T., Shiokawa, K., Ogawa, T., Kawamura, S., Fukao, S., and Zhang, S.-R.: Optical and radio mea-surements of a 630-nm airglow enhancement propagating over Japan on 9 September, 1999, J. Geophys. Res., 108(A6), 1252, doi:10.1029/2002JA009594, 2003.
Rohrbaugh, R. P., Hanson, W. B., Tinsley, B. A., Cragin, B. L., Mc-Clure,J. P., and Broadfoot, A. L.: Images of transequatorial bub-bles based on field-aligned airglow observations from Haleakala in 1984–1986, J. Geophys. Res., 94, 6763–6770, 1989.
Sagawa, E., Maruyama, T., Immel, T. J., Frey, H. U., and Mende, S. B.: Global view of the nighttime low-latitude ionosphere by the IMAGE/FUV 135.6 nm observations, Geophys. Res. Lett., 30, doi:10.1029/2003GL017140, 2003.
Sahai, Y., Bittencourt, J. A., Teixeira, N. R., and Takahashi, H.: Simultaneous observations of OI 7774-A and OI 6300-A emis-sions and correlative study with ionospheric parameters, J. Geo-phys. Res., 86, 3657–3660, 1981.
Sahai, Y., Fagundes, P. R., and Bittencourt, J. A.: Transequatorial F-region ionospheric plasma bubbles: solar cycle effects, J. At-mos. Solar-Terr. Phys., 62, 1377–1383, 2000.
Shiokawa, K., Katoh, Y., Satoh, M., Ejiri, M. K., Ogawa, T., Naka-mura, T., Tsuda, T., Wiens, R. H.: Development of optical meso-sphere thermomeso-sphere imagers (OMTI), Earth Planets Space, 51, 887–896, 1999.
Shiokawa, K., Katoh, Y., Satoh, M., Ejiri, M. K., and Ogawa, T.: Integrating-sphere calibration of all-sky cameras for nightglow measurements, Adv. Space Sci., 26, 1025–1028, 2000.
Shiokawa, K., Kadota, T., Otsuka, Y., Ogawa, T., Nakamura, T., and Fukao, S.: A two-channel Fabry-Perot interferometer with thermoelectric-cooled CCD detectors for neutral wind measure-ment in the upper atmosphere, Earth Planets Space, 55, 271–275, 2003.
Tinsley, B. A., Christensen, A. B., Bittencourt, J., Gouveia, H., An-greji, P. D., and Takahashi, H.: Excitation of oxygen permitted line emissions in the tropical nightglow, J. Geophys. Res., 78, 1174–1186, 1973.
Tinsley, B. A., Rohrbaugh, R. P., Hanson, W. B., and Broadfoot, A. L.: Images of transequatorial F region bubbles in 630- and 777-nm emissions compared with satellite measurements, J. Geo-phys. Res., 102, 2057–2077, 1997.
Tsunoda, R. T.: Control of the seasonal and longitudinal occur-rence of equatorial scintillations by the longitudinal gradient in integrated E region Pedersen conductivity, J. Geophys. Res., 90, 447–456, 1985.
Tsunoda, R. T., Livingston, R. C., and Rino, C. L.: Evidence of a velocity shear in bulk plasma motion associated with the post-sunset rise of the equatorial F-layer, Geophys. Res. Lett., 8, 807– 810, 1981.
Woodman, R. F. and La Hoz, C.: Radar observations of F region equatorial irregularities, J. Geophys. Res., 81, 5447–5466, 1976. Zalesak, S. T., Ossakow, S. L., and Chaturvedi, P. K.: Nonlinear equatorial spread F : The effect of neutral winds and background Pedersen conductivity, J. Geophys. Res., 87, 151–166, 1982.