HAL Id: hal-02385983
https://hal.archives-ouvertes.fr/hal-02385983
Submitted on 29 Nov 2019
HAL is a multi-disciplinary open access
archive for the deposit and dissemination of sci-entific research documents, whether they are pub-lished or not. The documents may come from teaching and research institutions in France or abroad, or from public or private research centers.
L’archive ouverte pluridisciplinaire HAL, est destinée au dépôt et à la diffusion de documents scientifiques de niveau recherche, publiés ou non, émanant des établissements d’enseignement et de recherche français ou étrangers, des laboratoires publics ou privés.
Gustavo Coelho Rezende, David Newport, Stéphane Le Calvé
To cite this version:
Gustavo Coelho Rezende, David Newport, Stéphane Le Calvé. MICRO PHOTO IONIZATION DE-TECTOR FOR VOLATILE ORGANIC COMPOUNDS. 5th European Conference on Microfluidics –
1
µFLU-NEGF18-127
MICRO PHOTO IONIZATION DETECTOR FOR VOLATILE ORGANIC
COMPOUNDS
Gustavo Coelho Rezende*
1,3,4, David Newport
1, Stéphane Le Calvé
2,31
Univeristy of Limerick, V94 T9PX, Castletroy, Limerick, Ireland [email protected], [email protected]
2Université de Strasbourg, 25 Rue Becquerel, Strasbourg, France
3In’Air Solutions, 1 Rue Blessig, 67000 Strasbourg, France 4Karlsruhe Institute of Technology, Karlsruhe, Germany
KEY WORDS
Gas sensor, Photo Ionization Detector, Volatile Organic Compounds, Miniaturization.
SHORT SUMMARY
Volatile Organic Compounds (VOCs) are a class of carbon-containing chemicals that concerns public health, since they may cause adverse health effects. They are present in indoor environments, which is a major concern, since Europeans spend on average 90 % of their time in indoor environments. Benzene, a VOC, is carcinogenic and no safe level of exposure is recommended, according to the World Health Organization. A Gas Chromatography (GC) process can identify and quantify VOCs in the air and the Photo Ionization Detector (PID) is commonly used for the quantification stage of the GC. Miniaturization of the PID is an important step to develop an efficient and portable GC. This work will present the main factors that affect the PID performance in order to design an efficient miniaturized PID, report the state of the art in PID miniaturization, propose an experimental setup to test miniaturized and commercial PIDs and suggest future studies.
EXTENDED ABSTRACT
In Europe, most population spend up to 90% of their time in indoor environments since daily life activities occur mainly within private homes, offices, public buildings, schools, etc. Within the European Union, regulations and guidelines are established to maintain a healthy indoor air quality [1,2]. Volatile Organic Compounds (VOCs) are a class of carbon-containing chemicals found in indoor environments that concerns public health because they may cause short and long-term adverse health effects [3,4]. The main sources of indoor air contamination by VOCs come from: 1) emissions from indoor materials such as varnishes, paints, solvents, etc., 2) outdoor sources, such as automotive exhausts and industrial waste [5]. Benzene, a VOC found indoor, is carcinogenic and no safe level of exposure is recommended [3,4]. Therefore, the European Commission established, with effect on 2010, a regulation for benzene exposure maximum limit of 5 µg/m³ (1.6 ppb) [1].
An equipment capable to detect airborne VOCs is the Gas Chromatograph (GC), which can separate, identify and quantify different chemicals. However, the commercial GCs available are still heavy, bulky, slow, lab-based equipment. The development of a transportable and fast GC analysis can improve indoor gas evaluation and device miniaturization can contribute to this achievement. One of the GC main components is the detector,
2
responsible for quantifying the chemicals. This work is then centered on a GC detector, namely the photo ionization detector (PID). The objective of this work is to present the main factors that affect the analytical PID performance, report the state of the art in PID miniaturization, propose an experimental setup to test miniaturized and commercial PIDs and suggest future studies.
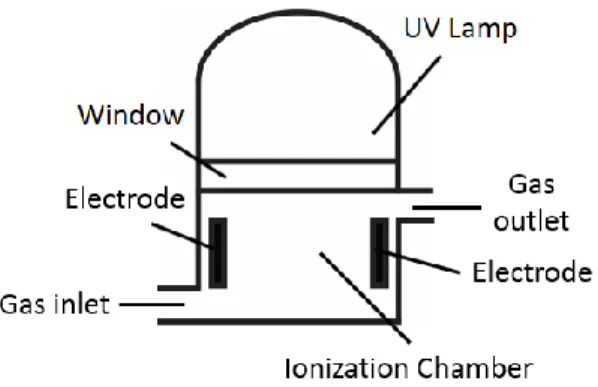
Fig. 1 shows the basic elements of a photo ionization detector. In this device, a gas sample containing the chemicals flows through the ionization chamber, where photons emitted by the ionization source reach the sample molecules. Typically, the ionization source is an ultra violet lamp separated from the ionization chamber by a window (UV-PID). Alternatively, the ionization source can be made by helium discharge (HD-PID), where the ionization chamber is not separated from the discharge locus. Both ionization sources generate enough photon energy to ionize VOCs. As a general rule, if the ionization energy of the photon is greater than the ionization potential of the molecule, ionization occurs. The electrodes establish then an electric field in the ionization chamber where the ionized molecules generate an ionization current proportional to their concentration. Based on an external calibration, the electrical signal can be translated into a VOC concentration.
The performance of the PID is affected by design choices at the ionization source, ionization chamber and electrodes. The ionization source is selected according to the desired photon energy output, considering the target compounds to be detected. In theory, an ionization source with energy greater or equal to 9.3 ionizes the benzene molecule and other harmful VOCs. However, Driscoll and Duffy [6] suggest to use the 10.2 eV ionization source since it has the highest photon flux resulting in high PID sensitivity. The ionization chamber should ensure uniform flow, otherwise the sensitivity of the PID is reduced [7]. Besides that, the ionization chamber volume should be as low as possible to reduce response time, thereby increasing sensitivity. A small volume also avoids remixing of organic species that have been previously separated in the gas chromatograph and ensures uniform ionization of the sample, contributing positively to the linearity and sensitivity of the signal. From the portability point of view, a small ionization chamber allows reduction of carrier gas flow rate, which can improve autonomy of the carrier gas cylinder (a relevant GC component) or diminish the cylinder size, reducing overall GC weight. The electrodes inside the ionization chamber directly influence the ion collection efficiency, which affects the sensitivity of the PID. Important electrode design aspects influencing the ions collection efficiency are the electric field in the ionization chamber, the area of the electrodes and the position of the electrodes in the ionization chamber [7].
Figure 1: Photo ionization detector main elements
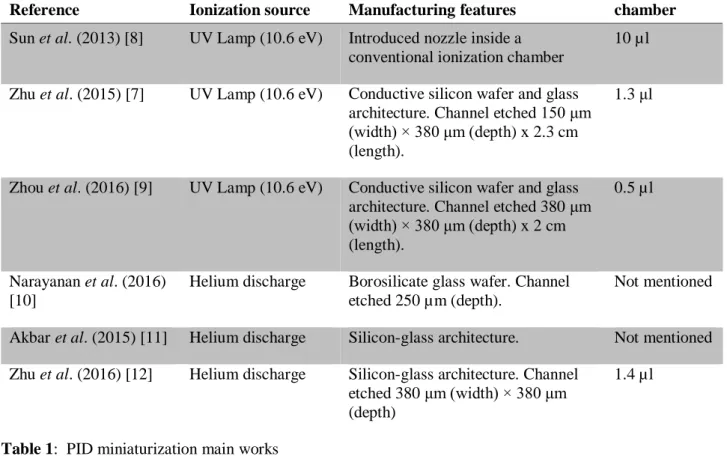
The commercial PIDs have dimensions on the order of 10 mm, which are already small compared to overall commercial GCs sizes, and the ionization chamber of commercial PIDs have volume ranging from 100 µl to 200 µl. Recent works have been published mentioning PIDs with ionization chambers 100 times smaller (volume close to 1 µl) where most improvements in ionization chamber size were achieved with microfabrication techniques using photolithography and etching.
For PIDs using UV Lamp as the ionization source, the first considerable reduction of ionization chamber volume was achieved by Sun et al. (2013) [8], where he introduced a nozzle inside a conventional ionization chamber, yielding a 10 µl volume chamber. Zhu et al. (2015) [7] fabricated a UV-PID on a conductive silicon wafer and glass architecture, where the channel is etched in a spiral shape on the conductive silicon. The
3
channel cross section was 150 μm (width) × 380 μm (depth) with 2.3 cm length. This design resulted an ionization chamber with 1.3 μl. Another UV-PID was fabricated using conductive silicon wafer and glass by Zhou et al. (2016) [9]. Their design had a 2 cm long channel with cross section 380 x 380 µm, resulting a 0.5 µl volume. Microfabrication techniques are also used to make HD-PIDs [10,11,12]. Narayanan et al. (2016) [10] developed a design on borosilicate glass wafer with channels etched to 250 µm depth. Akbar et al. (2015) [11] used a silicon-glass architecture for the HD-PID using deep reactive ion etching to make the cavities of the detector. Also using silicon-glass architecture, Zhu et al. (2016) [12] designed a HD-PID on a straight channel with 380 µm squared cross-section and 1.4 µl chamber volume. Tab. 1 summarizes the main works of PID miniaturization.
Reference Ionization source Manufacturing features
Ionization chamber
Sun et al. (2013) [8] UV Lamp (10.6 eV) Introduced nozzle inside a conventional ionization chamber
10 µl
Zhu et al. (2015) [7] UV Lamp (10.6 eV) Conductive silicon wafer and glass architecture. Channel etched 150 μm (width) × 380 μm (depth) x 2.3 cm (length).
1.3 μl
Zhou et al. (2016) [9] UV Lamp (10.6 eV) Conductive silicon wafer and glass architecture. Channel etched 380 μm (width) × 380 μm (depth) x 2 cm (length).
0.5 µl
Narayanan et al. (2016) [10]
Helium discharge Borosilicate glass wafer. Channel etched 250 µm (depth).
Not mentioned
Akbar et al. (2015) [11] Helium discharge Silicon-glass architecture. Not mentioned Zhu et al. (2016) [12] Helium discharge Silicon-glass architecture. Channel
etched 380 μm (width) × 380 μm (depth)
1.4 µl
Table 1: PID miniaturization main works
4
In order to test both commercial and microfluidic PIDs for VOC detection, an experimental setup was built. The main components are depicted in Fig. 2: 1) Mass flow controllers (MFCs); 2) Nitrogen gas supply; 3) VOC supply; 4) Mixing T; 5) Exhaust T; 6) Pump; 7) PID (commercial or microfabricated). MFC A, B and C have full scale 0.7 ml/min, 1 l/min and 7 ml/min respectively and their use allow the dilution of the VOC supply to test PIDs at a wide range of concentrations. Initially this arrangement is going to be used with commercial PID devices, but in the future, microfabricated PIDs are going to be tested with the same apparatus. The microfabricated PID designs will be based on the major guidelines presented in this work with focus in diminishing both the ionization chamber volume and the associated gas flow rate while maintaining low detection limit. The prototype will be evaluated and compared to commercial PIDs.
Acknowledgements
This ITN Research Project is supported by European Community H2020 Framework under the Grant Agreement No. 643095.
References and Citations
[1] European Comission. (2000). DIRECTIVE 2000/69/EC OF THE EUROPEAN PARLIAMENT AND OF THE COUNCIL of 16 November 2000 relating to limit values for benzene and carbon monoxide in ambient air. Official Journal of the European Communities.
[2] FRANÇAISE, J. O. (2011). Décret no 2011-1727 du 2 décembre 2011 relatif aux valeurs-guides pour l’air intérieur pour le formaldéhyde et le benzène. France.
[3] World Health Organization. (2000). Air Quality Guidelines for Europe.
[4] World Health Organization. (2010). WHO guidelines for indoor air quality: selected pollutants.
[5] Lance, A. W., Pellizzari, E., Leaderer, B., Zelon, H., Sheldon, L. (1987). Emissions of volatile organic compounds from building materials and consumer products. Atmospheric Environment, 385-393. [6] Driscoll, J. N., Duffy, M. (1987). Photoionization detector: A Versatile Tool for Environmental Analysis.
Chromatography, 2, 4.
[7] Zhu, H., Nidetz, R., Zhou, M., Lee, J., Buggaveeti, S., Kurabayashi, K., & Fan, X. (2015). Flow-through microfluidic photoionization detectors for rapid and highly sensitive vapor detection. Lab on a Chip, 15, 3031-3029.
[8] Sun, J., Guan, F., Cui, D., Chen, X., Zhang, L., & Chen, J. (2013). An improved photoionization detector with a micro gas chromatography column for portable rapid gas chromatography system. Sensors and
Actuators B: Chemical, 188, 513-518.
[9] Zhou, M., Lee, J., Zhu, H., Nidetz, R., Kurabayashi, K., & Fan, X. (2016). A fully automated portable gas chromatography system for sensitive and rapid quantification of volatile organic compounds in water.
RSC Advances, 49416–49424.
[10] Narayanan, S., Rice, G., & Agah, M. (2015). Characterization of a micro-helium discharge detector for gas chromatography. Sensors and Actuators B(206), 190-197.
[11] Akbar, M., Shakeel, H., & Agah, M. (2015). GC-on-chip: integrated column and photoionization detector.
Lab on a Chip, 1748-1758.
[12] Zhu, H., Zhou, M., Lee, J., Nidetz, R., Kurabayashi, K., & Fan, X. (2016). Low-Power Miniaturized Helium Dielectric Barrier Discharge Photoioinizaiton Detectors for Highly Sensitive Vapor Detection.