Direct and Indirect Effects of Alpha-Particle Irradiations of Human
Prostate Tumor Cells
by Rong Wang B.S., Physics Engineering
B.S., Economics
Tsinghua University, Beijing, China 1999
MASSACHUSETT! OF TECHNC
MAR 2 8
LIBRAF
SUBMITTED TO THE DEPARTMENT OF NUCLEAR SCIENCE & ENGINEERING AND THE HARVARD/MIT DIVISION OF HEALTH SCIENCES & TECHNOLOGY, RADIOLOGICAL SCIENCES JOINT PROGRAM ON AUGUST 24, 2005 IN PARTIAL
FULFILLMENT OF THE REQUIREMENTS FOR THE DEGREE OF
DOCTOR OF PHILOSOPHY IN RADIOLOGICAL SCIENCES AT THE
MASSACHUSETTS INSTITUTE OF TECHNOLOGY
SEPTEMBER 2005
© Massachusetts Institute of Technology. All rights reserved. The author hereby grants to MIT permission to reproduce
and distribute publicly paper and electronic copies of this thesis document in whole or in part.
Signature of Author.
Harvard/MIT Division
Certified by:
Certified by:
Accepted by:
`7Y Department 'f Nuclear Science and Engineering and the of Health Sciences and Technology, Radiological Sciences Joint Program
August 22, 2005
Jeffrey A. Coderre Associate Professor of Nuclear Science and Engineering
i
,_ ,/ r Thesis Supervisor
i) -'/] Jacquelyn C. Yanch
Professor of Nuclear Science and Engineering Thesis Reader
-
ysrt /
y /Jeffrey A. Coderre Associate Professor of Nuclear Science and Engineering Chair, Committee for Graduate Students
S INSnnrtE nLOGY
2006
HIES
Direct and Indirect Effects of Alpha-Particle Irradiations of Human
Prostate Tumor Cells
by Rong Wang
Submitted to the Department of Nuclear Science and Engineering
and
the Harvard/MIT Division of Health Sciences and Technology, Radiological Sciences Joint Program on August 22, 2005 in Partial Fulfillment of the
Requirements for the Degree of Doctor of Philosophy in
Radiological Sciences
ABSTRACT
The objective of this project is to establish a model system to study the direct effect, the bystander effect and the combinational effect of alpha-particle irradiations of human prostate tumor cells, toward the goal of improving the effectiveness of alpha-particle involved radiation therapies such as radioimmunotherapy and BNCT.
This project consists of an engineering part and a biological part. In the engineering part, an apparatus for alpha-particle irradiation of cells was designed and constructed. Dosimetry of this irradiator was conducted. The average dose rate to the cell monolayer in the specially designed Mylar dish was calculated to be 1.2 Gy/min. In the biological part, three in vitro studies were carried out with the DU-145 human prostate tumor cells using the established alpha-particle irradiator. Firstly, the direct effects of the alpha-particle irradiation of DU-145 cells were studied using the clonogenic assay, the comet assay and the micronucleus assay. A novel co-culture system was then designed to study the bystander effect transmitted through the cell culture medium. The micronucleus assay was used as endpoint for the bystander studies. A bystander effect was observed. Mechanism studies suggested that the nitric oxide was not involved in the process and indicated a short effective lifetime (< min) of the bystander signal. In the combinational studies, the effects of two anticancer drugs (Taxol and Oxaliplatin) together with direct alpha-particle irradiation were studied and no synergistic effect was observed for both drugs. Finally, the combined effect of the bystander effect and drug Taxol was studied, which was the first time that a combined effect between an anticancer drug and the radiation-induced bystander effect was studied.
The results of the model studies carried out in the two-dimensional monolayer of cells in this project can serve as a fundamental frame to be further applied to a three dimensional tumor micrometastasis model (spheroids) in the future. The understanding of the role the bystander effect plays in tumor cell killing, its mechanisms and its interaction with other agents, may make it possible to manipulate these factors to improve the effectiveness of alpha-particle involved therapies.
Thesis Supervisor: Jeffrey A. Coderre, Ph.D.
ACKNOWLEDGEMENTS
Five years passed very fast. I had great experience at MIT. When I look back, I feel so lucky and grateful for all the wonderful people I knew. They are treasure of my life.
First of all, I would like to say "thank you" to my dear parents. Although they are not physically here with me, their love is always companying me and gives me power. I love them and miss them.
I would like to thank my advisor Prof. Jeffrey Coderre for his kindness, consideration, guidance and support. He instructed me, inspired me, helped me, but never constrained me or forced me in my study and research. His trust always backed me up. He provided me great opportunities to explore my potential. Under his guidance, I grew a lot in all aspects. No word is enough to express my
appreciation to him. He is more than an advisor to me- he is like a father as well as a friend.
I also give my greatest appreciation to my thesis reader Prof. Yanch. She is one of the most wonderful women I have ever met. Her kind support has been with me along the way. I truly admire her and take her as my live model.
My academic advisor Prof. Sow-Hsin Chen is very kind to me. He is a wonderful professor and constantly gave me good suggestions. I thank him for his tutoring and caring.
I thank Prof. Kathryn Held and Prof. John Essigmann for being in my thesis committee and instructing my research and thesis. Prof. Held provided me valuable suggestions in my research and made important comments on my thesis.
I would like to thank Hatsumi Nagasawa, Edouard I. Azzam and Roger. W. Howell for helping me to start my research and to develop the alpha-particle irradiator.
A special "thank you" goes to my husband and my former officemate Hongyu Jiang. He gives me enormous support in my research and my life. He is extremely knowledgeable, helpful and reliable. I miss so much the time working with him, weekdays and weekends. With a good research partner, working becomes enjoyable; with a good life partner, everyday is enjoyable.
My officemates and good friends Antonio Damato and Brad Schuller make the office like a home. I become a funnier and happier person since they moved in my office. They are smart, funny and helpful. I had wonderful time with them.
My colleague Mike Folkert is a very nice and helpful person. He has a wide range of knowledge. I regard him as a good teacher and information source.
Other people who deserve my thanks include Prof. Todreas, Dr. Richard Lanza, Dr. John Bernard, Rachel Batista, Jianmei Che, Clare Egan, Ron Smith, Cathy Modica, Domingo Altarejos, my HST buddy Lisa Treat, Dusadee, Xuping Zhu, Chunqi Li, Susan White, Ray and Yoonsun Chung. Their kindness, help and friendship made my journey easier and cheerful.
There are a lot of people not listed here deserve my appreciation. They are my friends outside my research group, outside my department or even outside MIT. They all contribute to my unforgettable experience in the past five years. Thank you all!
TABLE OF CONTENTS
ABSTRACT ... 3 ACKNOWLEDGEMENTS... 5 TABLE OF CONTENTS ... 6 LIST OF FIGURES ... 10 LIST OF TABLES ... 19 CHAPTER 1 INTRODUCTION ... 21 1.1 BACKGROUND ... 21 1.1.1 PROSTATE CANCER ... 21 1.1.2 RADIOIMMUNOTHERAPY ... 221.1.3 THE BYSTANDER EFFECT ... ... 26
1.1.4 COMBINED MODALITY THERAPY AND SYNERGY EFFECT ... 28
1.2 OBJECTIVE ... 29
1.3 STUDY DESIGN ... 29
CHAPTER 2 BENCH-TOP ALPHA-PARTICLE IRRADIATOR ... 37
2.1 INTRODUCTION ... 37
2.2 MATERIALS AND METHODS ... 40
2.2.1 THE ALPHA ISOTOPE FOILS ... 40
2.2.2 THE ALPHA-PARTICLE IRRADIATOR ... ... 42
2.2.2.1 The first design of irradiator ... 4... 44
2.2.2.2 The second design of irradiator... 45
2.2.2.3 The Mylar dish ... 46
2.2.3 SIMULATIONS ... 47
2.2.4 DOSIMETRY MEASUREMENTS ... ... 50
2.2.4.4 D ose calculation ... 53
2.3 RESULTS ... 54
2.3.1 T lE SInIUIATION RESUITS ... 54
2.3.2 MEASUREMENTS ... 63
2.3.2.1 Alpha-particle energy and LET spectra at the cell irradiation position ... 63
2.3.2.2 Alpha-particle fluence and uniformity measurements with CR-39 ... 67
2.3.2.3 Dose rate calculation ... 70
2.3.2.4 Surface dosimetry of the five alpha-particle foils ... 70
2.3.2.5 The application of #5 alpha-particle source in another project (15) ... 73
2.4 DISCSSION ... 75
CHAPTER 3 DIRECT ALPHA-PARTICLE IRRADIATION ...83
3.1 INTRODUCTION ... 83
3.2 MATERIALS AND METHODS ... 91
.2.1 Cr I LL c UI1 T RI CONDIION S .... 91
3.2.2 C l C JNING ME ODS ... 91
3.2.3 CELL SURVIVAL EXPERIMENTS ... 94
3.2.4 TH E C A SSA ... 3.2.4 THE COMET ASSAY 95 3.2.4.1 Electrophoresis apparatus ... ... 97
3.2.4.2 Reagent preparation ... ... 99
3.2.4.3 Cell culture and treatment 100 3.2.4.4 Experimental procedure 101 3.2.4.5 Data analysis ... 103
3.3 RESULTS . ... ... ... 108
3.3.1 CFLL.I SURVIVAL CURVES ... 108
3.3.2 Cii ASSA R KES I rS ... ... 109
3.3.3 MICRON CLEUS FORMATION KESIIIS ... . ... 116
3.4 DISCUSSION ... 117
CHAPTER 4 BYSTANDER EFFECT STUDIES ... 123
4.1 INTRODUCTION ... ... 123
4.2 GRIDS MODEL ... 126
4.2.1.1 Grids design ... 127
4.2.1.2 Alpha-particle hit-pattern visualization by CR-39 ... 129
4.2.1.3 Dosimetry ... 129
4.2.1.4 Cell irradiation with grids ... 130
4.2.2 RESULTS ... 131
4.2.2.1 Grids design ... 131
4.2.2.2 CR-39 track-etch detection ... 132
4.2.2.3 Dosimetry ... 133
4.2.2.4 Cell irradiation with grids ... 137
4.2.3 D SCU SSIO N ... 138
4.3 CO-CULTURE M ODEL ... 139
4.3.1 MATERIALS AN M IHODS ... 139
4.3.1.1 The co-culture system ... 139
4.3.1.2 Co-culture experiments ... 141
4.3.1.3 Medium only irradiation ... 141
4.3.1.4 Medium transfer experiments ... 42
4.3.1.5 Co-culture after irradiation experiments ... 42
4.3.1.6 Scavenger experiments ... 142
4.3.2 RESULTS ... 143
4.3.2.1 Dose response results ... 43
4.3.2.2 Medium-irradiation, medium-transfer experiments and other experiments ... 144
4.3.2.3 Scavenger experiments ... 147
4.3.3 D ISC SSIO N ... 148
CHAPTER 5 ANTI-CANCER DRUG STUDIES ... 163
5.1 INTRODUCTION ... ... 163
5.1.1 PACLITAXEI ... 163
5.1.2 OXALIPLATIN .. ... ... 167
5.2 MATERIALS AND METHODS ... 169
5.2.1 ANTI-CANCER DRUGS ON DU- 145 CEILS ... 169
5.3.1 ANTI-CANCER DRUGS ON DU-145 CELLS ... ... 172
5.3.2 ANTI-CANCER DRUGS PLUS ALPHA-PARTICIE IRRADIATION ... 174
5.3.2.1 Cell survival results ... 174
5.3.2.2 Quantitative analysis ... 176
5.3.3 ANTI-CANCER DRUG PLUS THE BYSTAND)ER EFFECT ... 79
5.3.3.1 Micronucleus assay results ... 179
5.3.3.2 Cell cycle distribution ... 180
5.3.3.3 Quantitative analysis ... 181
5.4 DISCuSSI(ON ... 183
LIST OF FIGURES
Chapter 2Figure 2-1. The layer structure of the Am-241 alpha foils ... 41 Figure 2-2. The multi-port alpha-particle irradiator built in Roger Howell's Lab (8) ... 43 Figure 2-3. The first design of the alpha-particle irradiation system. The Am-241 foil was adhered to the surface of the bottom aluminum plate with 2-sided tape. The upper aluminum plate with holes served as a holder for the Mylar dishes ... 44 Figure 2-4. The second design of the alpha-particle irradiation system. The cells are grown on the Mylar membrane 5 mm above the surface of the alpha-emitting foil. An electronic shutter
controls the exposure time ... ... 46
Figure 2-5. Schematic view of the Mylar dish. The Mylar dish was composed of three parts: the dish body, 1.4 rim-thick Mylar film and a clamp ring to tighten the Mylar film as dish bottom.
... 4 7 Figure 2-6. SRIM interface: Top: the Input data for the Ion, including ion name, initial incident energy, number of ions; Mtiddle: the target data for each layer, including material and thickness; Bottom Left. the XY Longitudinal view of an ongoing simulation. Bottom Right. the
calculation parameters and results for ion statistics ... 49 Figure 2-7. The PIPS detector(Canberra, Meriden, CT; model A450-18AM). The active area of the detector is 450 m m2 ... 5 1 Figure 2-8. Schematic pinhole method. Left: the unshielded detector; Right: for the high-activity
sources, the detector surface was shielded with a 0.025 mm-thick stainless steel foil containing a 0.8-mm-diameter pinhole to avoid count rate saturation. The drawing is not in proportion of the real situation. The distance between the source surface and the active area of the PIPS detector was about 5 mm ... . ... 5 1 Figure 2-9. Left: Schematic etching process along alpha-particle trajectory a) the damage along the
trajectory caused by the passage of the alpha particle is invisible; b) the damage zone is revealed as a cone shaped etch-pit when the surface of the CR-39 is etched in a controlled manner using a hot sodium hydroxide solution. Right: a picture of"etch pits" on CR-39. Each
Figure 2-11. Top: the alpha-particle residual energies for different incident angles. The initial alpha-particle energy from the alpha foil was set at 4.9 MeV. The x-axis represents different
incident angles in degrees and the y-axis represents corresponding residual energies in MeV,
which are the energies that the monolayer of cells received. The left figure is for Mylar and the right figure is for polypropylene. Bottom. the energy spectra at the cell layer. The x-axis
represents energy in MeV and the y-axis represents relative frequency. which was from the standardized contribution in Table 2-2. The left figure is for Mylar and the right figure is for
polypropyle ne... ...60
Figure 2-12. Top. the LET values at the cell layer for different incident angles. The x-axis represents different incident angles in degrees. The y-axis represents the corresponding LET values for the alpha particle at the cell layer. The left figure is for Mylar and the right figure is for polypropylene. Bottom: the LET spectra at the cell layer. The x-axis represents the alpha-particle LET in keV/glm at the cell layer. The y-axis represents the relative frequency, which came from the standardized contribution in Table 2-2. The left figure is for Mylar and the right figure is for polypropylene ... 61 Figure 2-13. Simulated energy spectrum (left) and LET spectrum (right) at the cell position for the actual irradiator geometry described in 2.2.2.2 (the second design of the irradiator), which was used in all following cell irradiation experiments. For the energy spectrum, the x-axis represents the alpha-particle residual energies at the cell position in MeV. The y-axis represents the relative frequency of different energies, which came from the relative contribution in Table 2-3. For the LET spectrum, the x-axis represents the alpha-particle LET at the cell position in keV/lm. The y-axis represents the relative frequency of different energies, which came from the relative contribution in Table 2-3 ... ... 62 Figure 2-14. Energy spectra measured with the solid state (PIPS) detector at various positions
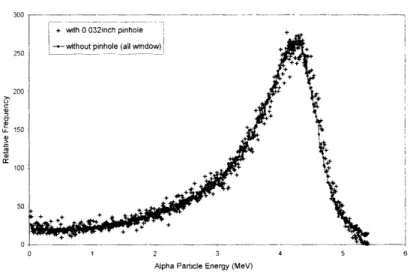
above the alpha-particle source used for all of the cell irradiations (241Am foil #4: nominal activity, 10 ltCi 24tAm/cm2). Triangles: measurement directly above the gold surface of the bare foil. Circles: measurement at the cell irradiation position, inside the cell culture dish directly above the Mylar membrane. Filled circles: a 4'Am point source measured in a
vacuum. The 24 Am energy peak at 5.49 MeV was used to calibrate the multi-channel analyzer; the FWHM of the calibration peak was 0.028 MeV ... 64 Figure 2-15. Energy spectra with and without the pinhole tested on the # 3 alpha source surface. The two spectra overlap each other, suggesting no significant collimation effect from the
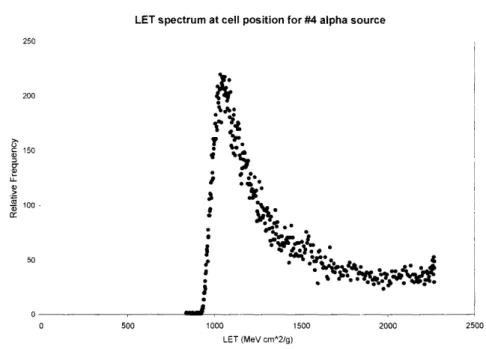
Figure 2-16. The relationship between the energy (x-axis, MeV) and the LET (y-axis, keV/pim) of alpha particles due to a Bragg peak effect. The maximum LET is 227 keV/,m, corresponding to the energy of 0.73 MeV ... 66 Figure 2-17. LET spectrum at the cell irradiation position, calculated from the measured energy spectrum of the # 4 alpha source shown in figure 2-14 ... 66 Figure 2-18. The CR-39 track detector results (tracks/mm2) for the alpha-particle flux, uniformity
and linearity on the #2 alpha foil. Left, middle and right denote the positions of the three holes shown in figure 2-3. Irradiations were in 15-second increments from 15 to 105 seconds. For
each time point, 20 random fields were scored. The average values and standard deviations
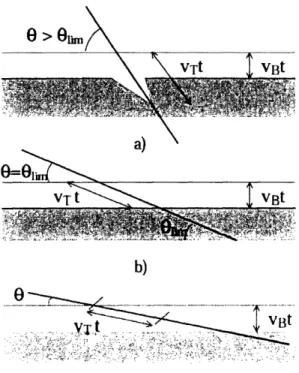
from the 20 counts were calculated and shown in the graph ... 68 Figure 2-19. The track formation for different incident angles (0 = 7r/2 - P ). (a) when 0 > 01i the etch-pit is formed; (b) (c) when 0 < 0,,, no etch-pit is formed. VB is the bulk or material etching rate and VT is the track etching rate. The limit angle Oi,,, is decided by sin(Olj,,,) = VB/ VT (11) ... 69 Figure 2-20. Superimposed image of DU-145 human prostate carcinoma cells and CR-39 pits after 0.2 second exposure of the #4 alpha source. Magnifications for both images were 50x ... 70 Figure 2-21. Energy spectra at the surface of the five alpha foils. All spectra peak between 4-5 MeV and have skewed tails in the low-energy part due to the non-collimated sources. All alpha foils should have the same energy spectra if they were manufactured to exactly the same specifications since the activities do not affect the energies. The differences in the spectra shown here for the five alpha foils most likely come from variations in the manufacturing process (homogeneity of the radioisotope layer or the thickness of the gold layers). Especially for the #1 alpha foil, there is a second peak at about 4 MeV, which may come from an impurity
of the radioisotope ... 72
Figure 2-22. Energy spectra of the bare 241Am calibration source in vacuum (A) and the #5 2 41Am foil above the polypropylene in the cell dish () ... 75 Figure 2-23. The energy spectrum and LET spectrum for the 241Am irradiator described in
reference (8). They have less low-energy and high-LET tails than the spectra of the
uncollimated alpha source shown in figure 2-14 and figure 2-17, which is due to the cut-off of the shallow-incident-angle alpha particles by the collimator ... 80
helium or hydrogen ions produced by a 4-MV van de Graaff accelerator, covering a range of LET from 30 to 220 keV/itm, into an area smaller than the nuclei of human cells growing in culture on thin plastic films. The overall irradiation throughput for the microbeam was about 10,000 cells/'h (6) ... 86 Figure 3-2. Graph from Jostes's paper "Single-cell gel technique supports hit probability
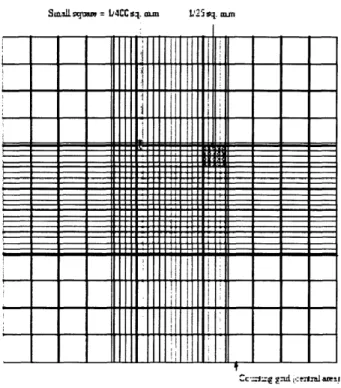
calculation". Single -cell gel data from the AL cell line. Two slides, representing a total of 60 cells, were evaluated for each of the treatments. The top panel illustrates the probability distribution for the unirradiated cell population; the middle panel illustrates the probability distribution for the low-LET X-ray control: the bottom panel illustrate the probability distribution for the radon-irradiated population (16) ... ...90 Figure 3-3. Schematic view of the hemocytometer ... 92 Figure 3-4. An entire counting grid of a hemocytometer, consisting of nine 1-mm2 squares ... 93 Figure 3-5. Top. Schematic top-view and side-view of the electrophoresis tank. Bottom. The
picture of the electrophoresis tank connected with the power supply ... 98
Figure 3-6. The schematic experimental protocol of the comet assay (Neutral and Alkaline) ... 101 Figure 3-7. The integrated window of the LAI's Automated Comet Assay Analysis System. The
upper window is for the comet images. Different colors represent different fluorescent
intensities (white-high intensity; red-low intensity). The image comes with an intensity curve and two bars, which define the tail region. The lower left window gives measured data for individual comets. The lower right window provides group statistical information and comparison of multiple study groups, with respect to the distributional properties of selected
comet analysis endpoints . ... 104
Figure 3-8. Illustration of the boxplot. The boxplot is often called the "box and whisker" plot. The "box" in a boxplot is defined by the lower 25th percentile line and the upper 75th percentile
line. The median is the score at the 50% percentile: half of all scores are higher than the median, and half of them are lower than it. The 25th percentile is the point than which 25% of the scores are lower. The 75th percentile is the point than which 75% of the scores are lower. Thus, the area in the "box" represents the middle 50% of the data. The length of the box in a box plot, i.e., the distance between the 25th and 75th percentiles, is known as the interquartile range. Whiskers above and below the box indicate the 90th and 10th percentiles. The symbols beyond the I 0th and 90th percentiles represent outliers or extreme data ... 105 Figure 3-9. Schematic view of the micronucleus formation process. In a normal situation (the upper process), a cell divides into two separate daughter cells, each containing one nucleus. With cytochalasin-B, an inhibitor of actins, the cell is blocked from cell division after the completion
of nuclear division (the lower process). The resulting one cell containing two daughter nuclei is
called a binucleated cell or BN. The micronucleus forms when a fragment of chromosome is broken off the main chromosome body due to damage, resulting in one or more micronuclei (MN) within the binucleated cell (BN). The presence of MN is a sign of severe damage to the cells. A BN cell with one or more MN was scored as one MN ... 107 Figure 3-10. Pictures of binucleated cells (BN) with and without micronucleus (MN), stained by
DAPI and recorded by an Olympus BX51 epi-fluorescence microscope. The magnification for
the left image was 100x and for the right image was 400x ... 107 Figure 3-11. DU-145 cells survival curves for alpha-particle and X-ray irradiation. The fraction of cells surviving is plotted on a log scale against dose on a linear scale. For alpha-particle
irradiation, the dose-response curve is a straight line from the origin, described by a linear
function SF = exp (-3.6xD). For X-ray irradiation, the dose-response curve has an initial linear slope, followed by a shoulder, and tends to become straight again at higher doses. The X-ray curve can be fitted to a linear-quadratic function SF = exp (-0.37xD - 0.0304xD'2) ... 109 Figure 3-12. The DU-145 comet images at different damage levels after 1.2 Gy alpha-particle
irradiation ... 110 Figure 3-13. A common problem encountered in the comet assay analysis was unclean background.
The LACAAS could not handle this situation therefore the results were unreliable. The problem usually came from careless handling of the sample slides so that dirt fell onto the slides and was stained by the fluorescent dye. Data corresponding to these images should be removed from the Excel files before further statistical analysis. ... I I Figure 3-14. The uniformity test of the electric field. Group I was the control group, in which the
cells were not treated with any damaging agent. Groups 2, 3 and 4 were cells treated with 100 p.M H,O, for 20 minutes at 4 °C. The control slide was placed in position 3 and the slides with 100 ptM H0 treated cells were placed in positions 2, 4 and 6 along the edge of the electrophoresis tank. Positions 1, 5 and 7 were occupied with spare slides (see figure 3-7). About 100 cells were scored in each sample... ... 111 Figure 3-15. The test of different electrophoresis time in DU-145 cells treated with 100 pM H,O,
for 20 min at 4 °C. The x-axis represents different electrophoresis time. Oil the y-axis, the tail moment (up left), % DNA in tail (up right) and tail length (bottom) are demonstrated in mean ± SD. H20O is an agent to induce single strand breaks in cellular DNA. The alkaline comet assay
For the y-axes, the tail moment, tail length and % DNA in tail are shown in box plots. From the results, 40 mins was chosen for further experiments because it differentiated the HO2 treated cells from the control cells better than 20 mins in all three endpoints. 60 mins did not seem to improve much compared to 40 minss ... 1 13 Figure 3-17. Tail length histogram (top) and box plot (bottom) for DU-145 cell comet assay results
after 0. 0.2 Gy., 0.6 Gy and 1.2 Gy alpha-particle irradiations, under the alkaline comet assay condition and 40 minutes electrophoresis. More than 100 cells were scored in each group.... 114 Figure 3-18. Tail moment histogram (top) and box plot (bottom) for the DU-145 cells after 0, 0.2 Gy, 0.6 Gy and 1.2 Gy alpha-particle irradiations, under alkaline comet assay condition and 40 minutes electrophoresis. For the box plot, the y-axis is on a log scale. More than 100 cells were scored in each group... ... 115 Figure 3-19. Dose response for micronucleus fonnrmation in DU-145 cells growing on the Mylar membrane and directly irradiated with alpha particles. Data points represent the mean + SD of two independent experiments with approximately 1000 cells scored per experiment ... 116
Chapter 4
Figure 4-1. Schematic view of the grids model for the bystander effect study. A grid sas used to shield part of the monolayer of cells from alpha-particle irradiation, creating hit and non-hit cells in a m ixed population... ... 127 Figure 4-2. The three grids designed for the bystander study. They had different numbers of homogeneously distributed holes, giving 50% opening ratios in the 11.4 cm' round area. There is a milled groove with 4.13 cm diameter around the opening area, to define the periphery of the M vl ar dish bottom ... 132 Figure 4-3. Left: the CR-39 track etching results for grid A, B and C after alpha-particle irradiation.
Right: the image of the etched tracks above one hole of grid C. The images of the etched tracks were recorded in a square area of 1.03 mm2 using a CCD camera at 50x magnification. The sparse dots in the blocked area were believed to come from environmental radiation during the processing of the CR-39. A control CR-39 was used to detect the background and showed sparse dots on it. The image is not shown here ... 133 Figure 4-4. 'The energy spectra at the cell position for the #4 source with and without grids. The
energy spectlrutn of a standard Am-241 alpha source in a vacuum was used to calibrate the energy scale on the x-axis, as described in Chapter 2. The different extents of narrowed shapes for grid A, B and C came from the collimation effects of different sizes of holes (figure 4-6),
which cut off the low energy tails of the spectra. The y-axis represents relative counts of alpha particles in different energy channels... 134
Figure 4-5. The LET spectra at the cell position for the #4 source with and without grids. The
collimations effects from different sizes of holes are also reflected in the narrowed shapes of
the LET spectra, resulting in more symmetric peaks and reduced high-LET tails ... 135 Figure 4-6. Schematic view of the collimation effects from different sizes of holes in the three
grids. Smaller holes would block more alpha particles with large incident angles and therefore reduce the low energy and high LET tails in the spectra, resulting in a narrower and more symmetric spectrum, as well as reduced alpha-particle flux ... 135
Figure 4-7. The survival curves of the DU-145 cells after alpha-particle irradiations using the #4
source with and without grids. The measurements were done on the mixed populations of hit cells and non-hit cells. The x-axis represents the alpha dose to the hit cells. The y-axis is on a
log scale and represents the surviving fraction of the mixed cells in the Mylar dish ... 137 Figure 4-8. The co-culture system for the bystander effect study. The cells growing on the Mylar
bottom were defined as the "targeted cells"; the cells growing on the Snapwell insert were
defined as the co-cultured cells", which were 4 mm above the targeted cells and worked as the receptor of the soluble bystander signal from the targeted cells ... 140 Figure 4-9. The Snapwell insert used in the co-culture system from Corning Life Sciences ... 140 Figure 4-10. Micronucleus formation in the co-cultured DU-145 cells as a function of direct
alpha-particle doses. The co-cultured cells were incubated in the medium above the irradiated cells for 2 hrs after the irradiation. The control produced 10.0 1.0% MN/BN ratio; 0.1 Gy produced 13.5 ± 0.8% MN/BN ratio; 0.6 Gy produced 14.8 ± 0.1% MN/BN ratio; 1.2 Gy
produced 14.5 ± 1.0% MN/BN ratio; 6.0 Gy produced 13.4 ± 0.3% MN/BN ratio. The numbers
within the shaded bars indicate the number of replicate experiments: 1000-2000 BN cells were scored for each experiment. (*)p < 0.0001 relative to controls ... 144 Figure 4-11. Micronucleus formation in the co-cultured cells following various treatments: ' 1.2 Gy to targeted cells, co-cultured cells present, then co-incubate for 2hr' is the core experiment
replicated from figure 4-10 and produced 14.5 i 1.0% MN/BN ratio; 24 hr co-incubation after irradiation instead of 2hr co-incubation produced 15.2 ± 2.2% MN/BN ratio in the co-cultured cells; When the co-cultured cells were absent during the 1.2 Gy irradiation of the targeted cells but added to the medium after the irradiation and then co-incubate for 2hr, the MN/BN ratio
11.1 0.6%M MN/BN ratios in the co-cultured cells. In all experiments the co-cultured cells were incubated for 2 hrs after the irradiation. (*)p < 0.0001 ... 146 Figure 4-12. The effect of radical scavengers on the bystander effect. MN/BN ratio in the co-cultured cells fllowing irradiation of the targeted cells in the presence of radical scavengers added to the medium 10 min before the irradiation and maintained in the medium during the 2-hr incubation after the irradiation. DMSO was used at a concentration of 1% (vol/vol). PTIO was present at a concentration of 100 uiM. DMSO alone produced 9.7 + 0.02% MN/BN ratio; PTIO alone produced 10.2 ± 0.7% MN/BN ratio: DMSO plus 1.2 Gy produced 10.5 ± 0.1% MN/BN ratio; PTIO plus 1.2 Gy produced 14.3 ± 0.1% MN/BN ratio. (*)p < 0.0001 relative to
controls ... 148
Chapter 5
Figure 5-1. The molecular structure of paclitaxel ... 163 Figure 5-2. Chemical structures of oxaliplatin and cisplatin ... 167 Figure 5-3. The survival curve of DU-145 cells after 24 hr treatment with various concentrations of Taxol. The data points represent the means + standard deviation of five replicate dishes in each
experiment from two independent experiments. ... 173 Figu-.re 5-4. The survival curve of DU- 145 cells after 24 hr treatment with various concentrations of
oxaliplatin. The data points represent the means ± standard deviation of five replicate dishes in
each experiment from two independent experiments ... 173 Figure 5-5. The DU-145 cell survival curves for alpha-particle irradiation only, alpha-particle
irradiation following 0.005 gpg/ml Taxol treatment for 24 hr and alpha-particle irradiation following 0.5 lig/ml oxaliplatin treatment for 24 hr. The data points represent the means i
standard deviation of five replicate dishes in each experiment from a total of five independent alplia-only experiments, two "0.005 pg/ml Taxol plus alpha" experiments and two "0.5 ag/ml oxaliplatin plus alpha" experim ents ... 174 Figure 5-6. The DU-145 cell survival curves for alpha-particle irradiation only, alpha-particle
irradiation following 0.01 lag/ml Taxol treatment for 24 hr and 0.05 [lg/ml Taxol treatment for 24 hr. The data points for "Taxol plus alpha" represent the means ± standard deviation of five
replicate dishes in one experim ent ... 175
Figure 5-7. The DU-145 cell survival curves for alpha-particle irradiation only and alpha-particle irradiation following I ug/ml Oxaliplatin treatment for 24 hr. The data points represent the means ± standard deviation of five replicate dishes in one experiment ... 175
Figure 5-8. Illustrative isobologram for drug A and drug B. When the dose-response data for both drugs could be fitted by linear regressions, the diagonal line represents dose pairs producing additive effects; when non-linear curve fitting is desired or actually required for the dose-response data for one drug and both drugs, the area defined by the two fine curves near the diagonal represents additive effects. The shape of the additive area is decided by the dose response curves of the two drugs (31) ... 177 Figure 5-9. 50% SF isobologram for 24 hr Taxol treatment and alpha-particle irradiation. The 0.2 Gy alpha-particle dose on the y-axis and the 0.01 ug/ml Taxol concentration on the x-axis define the additivity line; the 0.005 ug/ml Taxol plus 0.095 Gy alpha-particle dose define the actual dose pair point (empty dot). The dose pair point falls right on the line, suggesting an
additive effect ... 178
Figure 5-10. 50% SF isobologram for 24 hr Oxaliplatin treatment and alpha-particle irradiation. The 0.2 Gy alpha-particle dose on the y-axis and the 0.86 ug/ml Oxaliplatin concentration on
the x-axis define the additivity line; the 0.5 ug/ml Oxaliplatin plus 0.135 Gy alpha-particle dose
define the actual dose pair point (empty dot). The dose pair point falls above the line, suggesting a subadditive effect or probably just additive effect, as explained by Figure 5-8.. 178 Figure 5-1 1. The horizontal histogram of MN/BN ratio for the combined effects of Taxol plus the bystander effect. Data are shown as means ± SD. The control produced 10.0 ± 1.0 % MN/BN; the bystander effect at 1.2 Gy direct dose produced 14.5 ± 1.0 % MN/BN; 0.005 [lg/ml Taxol alone treatment for 24 hr produced 20.0 + 0.6 % MN/BN; 0.005 Clg/ml Taxol treatment plus the bystander effect produced 24.3 + 1. I % MN/BN; 0.01 pg/ml Taxol alone treatment for 24 hr produced 36.7 ± 1.0 % MN/BN; 0.01 ltg/ml Taxol treatment plus the bystander effect produced 44.3 ± 1.7 % MN/BN. The right parts of the bars for the "Bystander" and Taxol+Bystander" are the schematic increments from corresponding baselines (control or drug only). The numbers to the right of the bars represent the numerical values of the incremental means. The
,'n" within the bars indicates number of independent samples analyzed ... 180
Figure 5-12. The cell cycle distributions of DU-145 cells for control (top left), 0.005 pg/ml Taxol treatment for 24 hr (top right) and 0.01 pg/ml Taxol treatment for 24 hr (bottom). The left peak is GO/G I phase; the right peak is G2/M phase; the lower area with oblique lines between the two peaks is S phase; the solid lower area on the left and underneath the left peak is sub-G 1 phase and indicates apoptosis. 0.005 pig/ml Taxol treatment for 24 hr did not change the cell cycle distribution significantly from the control, except that a small amount of apoptotic cells
LIST OF TABLES
Table 1-1. The alpha-particle emitting radioisotopes of current interest in RIT (21) ... 25 Table 2-1. Dimensions and activities for the five Am-241 alpha foils ... 41 Table 2-2. Simulation Results for residual energy and LET at the cell position for different alpha-particle incident angles. The influences of different thickness of air and different thickness of polypropylene/Mylar were examined, assuming an initial incident energy of 4.9 MeV ... 58 Table 2-3. The simulation results for residual energies and LET at the cell position for different
incident angles in the second design of alpha-particle irradiator, assuming the initial incident
energy of the alpha particle was 4.7 MeV; the alpha particles passed through 5 mm air and 1.4 pm Mylar film before they hit the monolayer of cells grown on the Mylar bottom ... 62 Table 2-4. Surface dosimetry for the five "'Am foils. Alpha-particle energy and flux measurements2
were made with the PIPS detector directly over the bare tfoil surfaces. The errors of the results are not shown in this table. The percentage errors for the alpha dose rates were estimated to be 5.4% for all five foils . ... ... 72 Table 3-1. Components of the Trevigen comet assay kit ... 96 Table 3_-2. The comet assay analysis results for the six comet images showed in figure 3-12. Eight measurements were automatically generated by LACAAS for every captured comet image. Among the eight measures, the tail moment, % DNA and tail length are most commonly used t'or results analysis and dem onstration... 1 10 Table 4-1 . Detailed information of the three grids designed for the bystander study... 132 Table 4-2. Comparison of the alpha-particle flux results between CR-39 track-etch detector and PIPS detector. The errors of the CR-39 results are the standard deviation from counts in 20 fields. The errors of the PIPS results came from the reproducibility of the measuring system. For the #4 source without grid, the PIPS result is significantly smaller than the CR-39 result. For the #4 source with grids A, B, and C, the results from the two detectors are consistent. 136 Table 4-3. Dosimetry results for the #4 source and the #4 source with and without the grids. The media that alpha particles passed through were different for the #4 source alone and the #4 source with grids due to the thickness of the grids and the different designs of the adaptors. The alpha-particle flux results came from the PIPS detector. The weighted average energy was calculated from the energy spectra in figure 4-4. The weighted average LET was calculated from the LET spectra in figure 4-5. The average dose rate was calculated from the equation: Dose rate = (average LET) x (alpha-particle flux) x 0.016 ... 136 Table 5-1. the dose information for 50% surviving fraction. ... 177
Chapter 1 Introduction
1.1 Background
1.1.1 Prostate cancer
Carcinoma of the prostate is the most common male cancer in Western countries. Approximately 230,000 new cases were diagnosed, and about 30,000 died of prostate cancer in 2004 in the United States ( 1).
The prostate is a walnut-sized gland located between the bladder and the penis and
in front of the rectum. The primary function of the prostate is the production of seminal
fluid. Prostate cancer occurs when cells within the prostate grow uncontrollably, creating
small tumors. There are different types of prostate tumor. The term "primary tumor" refers
to the original tumor; secondary tumors are caused when the original cancer spreads to
other locations in the body. In the early stage, prostate cancer typically is comprised of
multiple very small, primary tumors within the prostate. At this stage. the disease is often
curable (rates of 90% or better) with a wide range of treatments, such as external beam
radiotherapy (2), surgery (radical prostatectomy), brachytherapy and hormone therapy
(androgen deprivation therapy) (3), that aim to remove or kill all cancerous cells in theprostate (4). Unfortunately, at the early stage the cancer produces few or no symptoms and
can be difficult to detect. The use of prostate-specific antigen (PSA) testing has allowed
physicians to detect prostate tumors before the primary tumor spreads (5).
PSA is an enzyme produced by cells in the prostate that is found in the seminal
fluid and the bloodstream. Although with a name specific to prostate, PSA is produced by
to elevate the PSA level in the bloodstream but an elevated PSA level does not necessarily
indicate prostate cancer, since PSA can also be raised by infection or other prostate
conditions. For diagnosis of prostate cancer in asymptomatic men, clinical practice
guidelines recommend the use of both PSA and digital rectal exam, in which a physician
will insert a gloved finger into the rectum to feel the peripheral zone of the prostate where
most prostate cancers occur. Detection of the prostate cancer at an earlier stage is very
important and can significantly increase the cure rate (5, 6).
If the prostate tumor is undetected and untreated, the cells from these tumors can
spread through the lymphatic system and the bloodstream to other parts of the body where
they lodge and form secondary tumors. This process is called metastasis. Once the cancer
spreads beyond the prostate gland (30,000 - 40,000 cases annually in the US), the
treatment options are largely ineffective and the cure rates drop dramatically. Metastatic
prostate cancer responds initially to hormone therapy but the majority of patients develop
hormone-resistant disease that in 80% of cases will develop metastases in bone.Chemotherapy is largely ineffective due to systemic toxicity (7). Bone-seeking
radiopharmaceuticals are used for palliative relief of pain. The attachment of radioisotopes
to tumor-specific monoclonal antibodies (Radioimmunotherapy) is an experimental
approach being evaluated against both blood-borne tumors (leukemia) and metastatic solid
tumors including prostate (8, 9).
1.1.2 Radioimmunotherapy
can be used in two ways: conjugated or unconjugated. The unconjuaged or "naked"
antibodies can kill cancer cells by enhancing complement fixation or initiating
antibody-dependent cell-mediated cytotoxicity. They may also exert antitumor activity bymodulating signaling pathways activated by the cell surface target to which they bind.
When conjugated. antibodies can be used to deliver a variety of toxic agents to tumor cells.
Antibodies can be conjugated to radioisotopes, cytotoxic agents or immunotoxins.
Antibodies currently being investigated for prostate cancer include those that target
tumor-specific antigens, such as mucin and prostate tumor-specific membrane antigen PSMA, cell
surface receptors such as epidermal growth factor receptor EGFR, and immunostimulatorymolecules such as CTLA-4, an antigen expressed on T cells. Radioimmunotherapy or RIT
has been used for the treatment of leukemia and lymphoma. Compared with external
radiation beam therapy, in which a limited area of the body is irradiated, and withchemotherapy in which the treatment is systemic and the therapy depends on the
differences in drug toxicity between normal tissue and the tumor, systemic targeted
radioimmunotherapy delivers the toxic substance - radiation - to the site of the tumor by
monoclonal antibody. The radioisotope is linked to the monoclonal antibody by a chemicallinkage that includes a specifically designed chemical chelator linkage to hold the
radioisotope (9).
Multiple considerations are involved in selection of the therapeutic radioisotope.
Ready availability and a half-life sufficiently long fbr formulation and delivery are clearlyimportant. A major consideration is the path length of the decay particle, which can range
from < 1 m for Auger electrons to millimeters for some beta particles. The radioisotopes
iodine-131 (1-131) (8, 10, I1i), yttrium-90 (Y-90) (11-14) and samarium-153 (Sm-153) (14,
15). 1-131 is a beta decay product from tellurium- 131. It has a half-life of eight days and
decays by emitting a beta particle, forming a stable isotope of xenon-131, (decay energy:0.971 MeV). It also gives off gamma radiation, which can be imaged with a standard
gamma camera. Y-90 is the decay product of strontium-90. Y-90 has a half-life of 64
hours and decays to zirconium-90 by emitting a beta particle (decay energy: 2.282 MeV).There is essentially no gamma radiation associated with the decay of Yt-90, making it hard
to image directly. Sm-153 is a beta decay product from promethium-153. Sm-153 has ahalf life of 46 hours and decays to europium-153 by emitting a beta particle, (decay
energy: 0.808 MeV). -particles emitted from these radioisotopes have maximum energies
from 0.5 to 2.0 MeV and ranges of 1-10 mm in tissue, which are much larger than the
diameter of a cell. This causes problems because the neighboring normal cells also receivea radiation dose even when the radioisotope is attached only to the tumor cells. Meanwhile,
compared to high-LET (linear energy transfer) radiation such as alpha particles, protons
and neutrons, the relatively low LET and small RBE (relative biological effect) of 3-raysmake them not very efficient in killing tumor cells. While successful in some applications,
such as thyroid cancer and lymphoma, 3-particle RIT has generally been disappointing,requiring high activities to compensate for poor overall efficiency in clinical trials (16).
To limit alpha-particle emitters deposit a large amount of energy over a short track
length, and consequently a few alpha particles through the nucleus are sufficient to kill aalpha particles is not affected by oxygen. Due to the short range, little collateral damage
may be inflicted upon non-targeted cells so less side effects would be caused. Alpha
emitters have the potential to yield a more homogeneous distribution of dose within a
tumor, particularly in micrometastatic sites, compared to the longer-range beta emitters
(20). It has been calculated that 60% of the radiation energy from a uniformly distributedalpha emitter is absorbed within a 100 tm diameter spheroid, while only 2% of the energy
from a beta emitter is retained within a spheroid this size (19). As a result, alpha-particle
therapy has received renewed interest recently, especially with 212 and
bismuth-213, which can be eluted from radium-224 and actinium-225 generators, respectively (21).There are other alpha-particle emitting radioisotopes of therapeutic interests such as
terbium- 149, astatine-2 11 and actinium-225. Their properties are listed in table 1.
Table 1 -1. The alpha-particle emitting radioisotopes of current interest in RIT (21)
Radioisotope Half-life Alpha-particle Branching ratio Range
Energy (MeV) (%) (tm) Terbium-149 4 h 3.97 17 26 Astatine-211 7.21 h 6.0 41.7 65 7.5 58.3 75 Bismuth-212 I h 8.79 64 87 6.0 36 65 Bismuth-213 45.6 min 8.4 97.8 80 5.9 2.2 58 Actinium-225 10 days 6.0 100 65 6.0 100 65 7.0 100 70 8.4 97.8 85 5.9 2.2 58
In principle, alpha-emitting radionuclides are significantly more selective and
potent in killing targeted cells. They have been proposed for use in single-cell disorders,
alpha-emitting actinium antibody conjugates were recently reported in mouse xenograft
models (22). However, the short range of the alpha particles (20 - 90 tm in tissue,depending on the energy), together with the limited penetration of the monoclonal
antibodies or monoclonal antibody fragment into the tumor site, make it difficult to deliver
a lethal dose to cells at depth in the tumor. Radioimmunotherapy has had most success in
bloodborne tumors where access of the antibody to the tumor cells is unimpeded (13). In
solid tumors, however, radioimmunotherapy has had only limited success due largely to
the problems associated with non-uniform binding of the radioimmunoconjugate to the
tumor and/or poor penetration of the antibody into tumor sites (23, 24).1.1.3 The bystander effect
Until a decade ago, it had been generally accepted that the important biological
effects of ionizing radiation in mammalian cells were direct consequences of un-repaired
or mis-repaired DNA damage in the irradiated cells. It was presumed that no effect wouldbe expected in cells that receive no direct radiation. However, recent experimental
evidence, mainly from in vitro alpha-particle studies, indicated that ionizing radiationcould also cause biological effects, including DNA damage, by mechanisms that are
independent of nuclear traversal: cells in the vicinity of directly irradiated cells or
recipients of medium from an irradiated culture can also show damage response (25-29).
The radiation-induced bystander effect has been broadly defined as referring to the
occurrence of biological effects in un-irradiated cells as a result of exposure of other cells
to ionizing irradiation. The "bystander effect" was first described by Nagasawa and Littleless than 1%, but over 30% of cells showed chromosome damage (sister chromatid
exchange). These results indicated that the target for genetic damage by alpha particles is
much larger than the nucleus or even the cell itself. Since then, the literature on thebystander effect has expanded enormously. Other endpoints for bystander responses
include gene mutations, micronucleus formation, apoptosis, changes in gene expression,oncogenic transformation and cell survival (28, 30-35).
The bystander effect is actually a class of effects that differs with cell type,
endpoint and in actual mechanism (33. 34). Radiation induced bystander effects are under
intense investigation in the radiation protection area, where the effects predominate at low
doses and have been discussed mainly in terms of the impact on low-dose risk assessment.
As a result, most of the bystander effect studies have been done with normal cell lines. The
relevance of the bystander effect in vivo remains unclear. There have been very few studies
of the bystander effect in three dimensional cell systems. Mothersill irradiated human
urothelium explants and showed that the overlying medium could cause effects in
unirradiated urothelium explants or cells in culture (36). Howell has used pelleted mixtures
of V79 hamster fibroblasts, some with 125I incorporated into the DNA, to show cell killing
in a greater fraction of cells than was labeled; interpreted as evidence of a bystander effect
in the cell pellet (37, 38). All of the above studies used normal cells or tissues. Carcinoma
cells have been shown to undergo a bystander effect in vitro, where cells not directly
irradiated, nevertheless die (39), and in vivo, where the specific irradiation of human tumor
cells leads to a bystander effect in subcutaneously growing tumors (40).
These recent reports of bystander effects in tumor cells, together with the need to
or micrometastatic disease prompted the studies described in this paper. In this project, we
focus on the possible therapeutic implications of the bystander effect in RIT to see whether
the bystander effect can be manipulated or exploited to increase the level of tumor cell killin those cells not directly targeted with the alpha particles. (A more detailed background of
the bystander effect will be given at the beginning of Chapter 4)
1.1.4 Combined modality therapy and synergy effect
There is a long history of attempts to combine radiation and chemotherapy with
the hope of producing specific interactions that can enhance cytotoxicity in the tumor, but
not in critical normal tissues. In 1979, Steel proposed a nomenclature for mechanisms by
which radiation and chemotherapy might be combined (41). Synergistic effects between
chemotherapy drugs and low LET irradiation (X-ray and gamma irradiation) have been
reported in various cancer types, both in vitro and in vivo (42-48). Paclitaxel (Taxol), a
microtubule stabilizer, has demonstrated efficacy in the treatment of various types of
cancers (49-52). Taxol is also a potential radiation sensitizer. It has shown synergisticenhancement with both external beam radiation therapy (53) and Y-90 conjugated
radioimmunotherapy in breast cancer (54, 55), ovarian cancer (56), prostate cancer (57)
and lung cancer (43). Another chemotherapy drug Oxaliplatin, which forms reactive
platinum complexes and interferes in the work of DNA repair enzymes, was also reportedto demonstrate irradiation sensitizing activity, both in vitro and in vivo (46, 58).
Hydroxymethylacyflulvene (HMAF), a novel agent with alkylating activity and a potentOur studies, however, look into the combinational effects of chemotherapeutic drugs and
high-LET alpha-particle irradiation. (A more detailed background of combined modality
therapy will be given at the beginning of Chapter 5.)1.2 Objective
This project will contribute to the overall goal of improving the effectiveness of
radiation therapy for metastatic prostate carcinoma. The role that the bystander effect playsin damaging the non-irradiated tumor cells and the mechanisms of the bystander effect
were investigated when the prostate tumor cells were irradiated with alpha particles. A
combined modality study using alpha particles and chemotherapeutic drugs that have been
reported to act synergistically when combined with gamma or beta irradiation, was carried
out. Finally, as a brand new topic, the interactions between the chemotherapeutic drugs and
the bystander effect were investigated. Potential synergistic effects between the drugs and
alpha-particle-based radioimmunotherapy for prostate tumor cells could improve the
clinical management of this disease at an early stage.
1.3 Study Design
Part 1: An alpha particle irradiator was designed, constructed and calibrated. Alpha
particle fluxes were measured using a track-etch detector and the alpha-particle energy
spectra were measured with a solid-state semiconductor detector. The dose rates to
monolayer cells were calculated for different experimental conditions. The irradiator has
been used for several alpha-particle irradiation studies and has proven to be consistent andPart 2: The biologic effects of alpha-particle irradiation on the human prostate tumor cell
line DU-145 were examined with three endpoints: the clonogenic assay (at
population-level), the comet assay (at single-cell level) and micronucleus formation. (Chapter 3)
Part 3: Two experimental models were used to study the bystander effect (Chapter 4):
·
Grids model: Three plastic mesh grids were designed and fabricated that can be
interposed between the alpha-particle source and the Mylar bottoms of the celldishes to block part of the monolayer of cells from the alpha-particle irradiation. As
a result, two subpopulations of cells were formed - cells that were directly subjectto alpha particle irradiation (hit cells) and the non-hit, neighboring cells. The
clonogenic assay was used to measure if there is a bystander effect in those non-hit,
neighboring cells.* Co-culture model: A novel co-culture system was designed that enabled two layers
of cells growing in the same medium. The cells growing on the bottom Mylarmembrane were directly exposed to alpha particles. The cells co-cultivated on the
inserts, positioned -4 mm above the bottom cell layer and out of the range of the
alpha particles, served as the non-targeted bystander cells. DNA damage, as
measured by micronucleus (MN) formation in the non-targeted prostate tumor cells
was used as a measure of the bystander effect.
Chapter 5: The effects of two chemotherapeutic drugs, Taxol and Oxaliplatin on the
DU-145 cells were studied first. The combined effects of each drug with high-LET
synergetic effect in vitro indicates a possibility of beneficial combined drug-irradiation
therapy in vivo.Once established, this model system can be used to test for the synergistic effects in
combined modality studies using other drugs and other cell lines.
The results of the model studies carried out in the two-dimensional monolayer of
cells in this project can serve as a fundamental frame work to be further applied to a three
dimensional tumor micrometastasis model - spheroids - in the future. The understanding
of the role the bystander effect plays in tumor cell killing and its mechanisms may make itpossible to manipulate these factors to improve the effectiveness of radioimmunotherapy.
The ability of the treatment to increase the cell kill at depths beyond the range of the alphaReferences:
1. Jemal, A., Tiwari, R. C., Murray, T., Ghafoor, A., Samuels, A., Ward, E., Feuer, E. J., and Thun, M. J. Cancer statistics, 2004. CA Cancer J Clin, 54: 8-29, 2004. 2. Pisansky, T. External beam radiotherapy as curative treatment of prostate cancer.
Mayo Clin Proc, 80: 883-898, 2005.
3.
Drudge-Coates, L. Prostate cancer and the principles of hormone therapy. Br J
Nurs, 14: 368-375, 2005.4. Trojan L, K. K., Knoll T, Alken P, Michel MS Prostate cancer therapy: standard
management, new options and experimental approaches. Anticancer Res, 25:
551-561, 2005.5. Routh JC, L. B. Adenocarcinoma of the prostate: epidemiological trends, screening. diagnosis, and surgical management of localized disease. Mayo Clin Proc, 80: 899-907, 2005.
6. Cohen S, S. S., Kelty P PSA screening. Med Health R I., 88. 90-91, 2005.
7. Smith, D. C. Chemotherapy for hormone refractory prostate cancer. Urol Clin
North Am, 26: 323-331, 1999.
8. Meredith, R. F., Khazaeli, M. B., Macey, D. J., Grizzle, W. E., Mayo, M., Schlom, J., Russell, C. D., and LoBuglio, A. F. Phase II study of interferon-enhanced
131I-labeled high affinity CC49 monoclonal antibody therapy in patients with metastatic
prostate cancer. Clin Cancer Res, 5: 3254s-3258s, 1999.9. McDevitt, M. R., Barendswaard, E., Ma, D., Lai, L., Curcio, M. J., Sgouros, G., Ballangrud, A. M., Yang, W. H., Finn, R. D., Pellegrini, V., Geerlings, M. W., Jr., Lee, M., Brechbiel, M. W., Bander, N. H., Cordon-Cardo, C., and Scheinberg, D. A. An alpha-particle emitting antibody ([213Bi]J591) for radioimmunotherapy of prostate cancer. Cancer Res, 60: 6095-6100, 2000.
10. Denardo, S. J., O'Grady, L. F., Richman, C. M., Goldstein, D. S., O'Donnell, R. T.,
Denardo, D. A., Kroger, L. A., Lamborn, K. R., Hellstrom, K. E., Hellstrom, I., and Denardo, G. L. Radioimmunotherapy for advanced breast cancer using I-131 -ChL6 antibody. Anticancer Res, 17. 1745-1751., 1997.
11. Vallabhajosula, S., Smith-Jones, P. M., Navarro, V., Goldsmith, S. J., and Bander, N. H. Radioimmunotherapy of prostate cancer in human xenografts using monoclonal antibodies specific to prostate specific membrane antigen (PSMA):
studies in nude mice. Prostate, 58. 145-155, 2004.
12. Boiardi, A., Bartolomei, M., Silvani, A., Eoli, M., Salmaggi, A., Lamperti, E., Milanesi, I., Botturi, A., Rocca, P., Bodei, L., Broggi, G., and Paganelli, G.
Intratumoral delivery of mitoxantrone in association with 90-Y
radioimmunotherapy (RIT) in recurrent glioblastoma. J Neurooncol, 72: 125-131, 2005.
13. Ma, D., McDevitt, M. R., Barendswaard, E., Lai, L., Curcio, M. J., Pellegrini, V., Brechbiel, M. W., and Scheinberg, D. A. Radioimmunotherapy for model B cell
malignancies using 90Y-labeled anti-CD19 and anti-CD20 monoclonal antibodies.
15. Fani, M., Vranjes, S., Archimandritis, S., Potamianos, S., Xanthopoulos, S.,
Bouziotis, P., and Varvarigou, A. Labeling of monoclonal antibodies with 153Sm
for potential use in radioimmunotherapy. Appl Radiat Isot, 57. 665-674, 2002. 16. PW, J. The emerging role of radioimmunotherapy in hematological malignancies.Br. J. Haematol, 108: 679-688, 2000.
17. Allen, 13. J. Targeted alpha therapy: evidence for potential efficacy of
alpha-immunoconjugates in the management of micrometastatic cancer. Australas Radiol,
43: 480--486. 1999.
18.
Waldmann, T. ABCs of radioisotopes used for radioimmunotherapy: alpha- and
beta-emitters. Leuk Lymphoma, 44. S 107-113, 2003.19. Imam, S. K. Advancements in cancer therapy with alpha-emitters: a review. Int J Radiat Oncol Biol Phys, 51. 271-278, 2001.
20. Ballangrud. A. M., Yang, W. H., Charlton, D. E., McDevitt, MN. R., Hamacher, K. A., Panageas. K. S., Ma, D., Bander. N. H., Scheinberg, D. A.. and Sgouros. G.
Response of LNCaP spheroids after treatment with an alpha-particle emitter
(213Bi)-labeled anti-prostate-specific membrane antigen antibody (J591). Cancer
Res, 61: 2008-2014, 2001.21. McDevitt, M. R., Sgouros, G., Finn, R. D., Humm, J. L., Jurcic, J. G., Larson, S. M., and Scheinberg, D. A. Radioimmunotherapy with alpha-emitting nuclides. Eur JNucl Med, 25. 1341-1351, 1998.
22. McDevitt, M. R., Ma, D., Lai, L. T., Simon, J., Borchardt, P., Frank, R. K., Wu, K., Pellegrini, V., Curcio, M. J., Miederer. M., Bander, N. H., and Scheinberg, D. A. Tumor therapy with targeted atomic nanogenerators. Science, 294: 1537-1540, 2001.
23. Koppe, M., Bleichrodt, R.. Oyen, W., and Boerman, O. Radioimmunotherapy and colorectal cancer. Br J Surg. 92. 264-276, 2005.
24. DeNardo, G. L., O'Donnell, R. T., Kroger, L. A., Richman, C. M., Goldstein, D. S.,
Shen, S., and DeNardo, S. J. Strategies for developing effective
radioimmunotherapy for solid tumors. Clin Cancer Res, 5. 3219s-3223s, 1999. 25. Nagasawa, H1. and Little, J. B. Induction of sister chromatid exchanges by
extremely low doses of alpha-particles. Cancer Res, 52: 6394-6396, 1992.
26. Azzam, E. I. and Little, J. B. The radiation-induced bystander effect: evidence and significance. Hum Exp Toxicol, 23. 61-65, 2004.
27. Azzam, E. I., de Toledo, S. M., and Little, J. B. Stress signaling from irradiated to non-irradiated cells. Curr Cancer Drug Targets, 4. 53-64, 2004.
28. Nagasawa, H. and Little, J. B. Unexpected sensitivity to the induction of mutations by very low doses of alpha-particle radiation: evidence for a bystander effect. Radiat Res, 152. 552-557, 1999.
29. Huo, L., Nagasawa, H., and Little, J. B. HPRT mutants induced in bystander cells
by very low fluences of alpha particles result primarily from point mutations.
Radiat Res, 156: 521-525, 2001.30. Prise, K. M., Belyakov. O. V., Folkard, M., and Michael. B. D. Studies of bystander effects in human fibroblasts using a charged particle microbeam. Int J Radiat Biol, 74. 793-798, 1998.