THE DISTRIBUTION OF DISSOLVED SILICA IN THE DEEP WESTERN NORTH ATLANTIC OCEAN
by
Gerald J. Needell
B.S., Northeastern University (1975)
SUBMITTED IN PARTIAL FULFILLMENT OF THE REQUIREMENTS FOR THE DEGREE OF
MASTER OF SCIENCE at the
MASSACHUSETTS INSTITUTE OF TECHNOLOGY and the
WOODS HOLE OCEANOGRAPHIC INSTITUTION November, 1978
Signature of Author... .-... . ...
Joint Program in Oceanographr, Massachusetts Institute of Technology - Woods Hole Oceanographic Institution, Department of Meteorology, Massachusetts Institute of Technolog November,C/L9f78. .
Certified by... ...
Thesis Supervisor Thesis Supervisor Accepted by...
Chairman, Joint Oceanography Committee in the Earth Sciences, Massachusetts Institute of Technology -Woods Hole Oceanographic Institution.
MASSACHUSESOF TECH rwK
IT
THE DISTRIBUTION OF DISSOLVED SILICA IN THE
DEEP WESTERN NORTH ATLANTIC OCEAN by
Gerald J. Needell
Submitted to the Department of Meteorology
on November 13, 1978 in partial fulfillment of the requirements for the Degree of Master of Science
ABSTRACT
The distribution of dissolved silica in the deep western North Atlantic Ocean is presented. The potential temperature-dissolved silica relationship is compared with the potential temperature salinity relationship in the North Atlantic Deep Water. Geographical variations in the potential temperature-dissolved silica relation-ship are discussed with particular emphasis on the low silica signal of the Western Boundary Undercurrent (WBUC). The WBUC is shown to have a significant influence on the potential temperature-dissolved silica relationship from the tail of the Grand Banks of Newfoundland to Cape
Hatteras.
It is suggested that a region of enhanced mixing is present west of 65*W that is responsible for the observed changes in the dissolved silica distribtution.
ABSTRACT
The distribution of dissolved silica in the deep western North Atlantic Ocean is presented. The potential temperature-dissolved silica relationship is compared with the potential
temperature salinity relationship in the North Atlantic Deep: Water. Geographical variations in the potential
temperature-dissolved silica relationship are discussed with particular emphasis on the low silica signal of the Western Boundary Undercurrent (WBUC). The WBUC is shown to have a significant influence on the potential temperature-dissolved silica
relationship from the tail of the Grand Banks of Newfoundland to Cape Hatteras.
It is suggested that a region of enhanced mixing is pre-sent west of 65*W that is responsible for the observed changes in the dissolved silica distribution.
Table of Contents Abstract
I. Introduction
II. Background
2.1 Historical uses of dissolved silica as a water mass tracer.
2.2 The deep western North Atlantic Ocean.
III. Data and methods.
IV. Water mass characteristics.
4.1 Potential temperature-salinity characteristics. 4.2 Potential temperature-dissolved silica
characteristics.
4.2.1 Polynomial fits to the O-SiO2 relationship
V. The distribution of dissolved silica on surfaces of constant potential temperature.
5.1 The 1.9*C potential temperature surface. 5.2 The 2.20C potential temperature surface. 5.3 The 2.40C potential temperature surface.
5.4 The 3.0*C potential temperature surface.
VI. Discussion
6.1 The O-SiO2 relationship
6.2 Geostrophic transport measurements.
6.3 Moored current meter observations.
6.4 Enhanced mixing west of 65*W.
VII. Summary
Appendix I
Acknowledgements Bibliography
I. Introduction
The distribution of dissolved silica in the deep western North Atlantic Ocean may be used to identify water masses with distinct characteristics within the potential
tempera-ture and salinity range of the ubiquitous North Atlantic deep water.
The most prominent feature of the silica distribution is a narrow band of low silica along the continental rise. This low silica feature shall be identified as the Western Boundary Undercurrent CWBUC) in keeping with the literature
(Richard-son (1977)). It shall be demonstrated that the WBUC can be
traced from the tail of the Grand Banks of Newfoundland to Cape Hatteras. With the data presented below, a "global" view of the WBUC shall be provided.
In the past, observations of the WBUC have consisted of hydrographic sections across the continental rise for which
the geostrophic transport was computed. Either neutrally buoyant floats or moored current meters were used to set
ab-solute velocities (Swallow and Worthington (1961), Volkmann
(1962), Richardson (1977), Clarke, Hill, Reiniger, and Warren
(1978)). Occasionally, dissolved silica was measured and it
could be demonstrated that the water observed did have a northern origin (Richardson (1977), Clarke, Hill, Reiniger, and Warren (1978)).
Eight month long current meter records along 700W show
1977). Unfortunately, one cannot be sure whether the
west-ward flow is the WBUC (i.e., low silica) or is part of a
broad westward flow in the slope water region (Webster (1969)). This brings up an important problem with the historical observations of WBUC. Stommel (1957) postulated the exis-tence of a deep southward flowing western boundary current in the Atlantic Ocean. His model was based on the hypothesis that some thermohaline process caused sinking of water in arctic regions and upwelling in antarctic regions. To con-serve mass, he argued that a deep flow would be present along the western boundary.
In the following year, Swallow and Worthington (1961) occupied hydrographic sections and tracked neutrally buoyant floats near Cape Romaine, North Carolina. In the hydrographic data, they found that the deep isotherms sloped downward off shore indicating the presence of westward shear. When they observed that the neutrally buoyant floats moved westward, it was assumed that the WBUC had been found. The current meter data from 70*W shows that even where the flow is relatively steady toward the west, it is not always so. O-ccasional re-versals in the flow are not uncommon. Thus one must be
cautious in the interpretation of few day-long float tracks. It should also be noted that the spatial coverage of the data from which we car observe the WBUC is not uniform. The only long-term current meters on the continental rise were
at 70*W. Hydrographic sections wiLh some method of determin-ing absolute velocities are only availaS.e near 70*W and Cape
7
Hatteras. The results of a section at 50*W are not considered realistic for reasons discussed in the text. Thus we are left with only a limited set of observations of the WBUC. There is no direct evidence for a continuously flowing current that passes arcund the tail of the Grand Banks of Newfoundland and
follows the cortinental rise toward the west. To the contrary, the current meterz data and the variations in the transport
calculations suggest that whatever flow there is, is not steady.
The distribution of dissolved silica will be used to demonstrate that the WBUC can be identified in terms of its water mass characteristics. The effects of the WBUC can be traced along the continental rise from the tail of the Grand Banks of Newfoundland to Cape Hatteras. However, the struc-ture of the flow cannot be determined from the available data.
Evidence is presented below which suggests that a
region of enhanced mixing is present west of 650W and has a
pronounced effect upon the dissolved silica distribution.
II. Background
2.1 Historical uses of dissolved silica as a water mass tracer
It has only been in the past three decades that one has been able to map out the distribution of dissolved silica. On the basis of sparse data, Sverdrup, Johnson, and Fleming
increased monotonically with depth everywhere in the world oceans. They pointed out that the silica values in the
Atlantic Ocean were in general, lower than those of the other oceans. Cooper (1952) examined the sources and sinks of dis-solved silica and suggested that the concentration of silica in the deep water should be in equilibrium and might be use-ful as a water mass tracer. Without any observations to rely on, Cooper assumed that the tundra drainage in the Arctic would result in a high silica content of the waters of the North Polar Sea. He then reasoned that there would be a flow of high silica water in the Greenland and Irminger Currents which could be easily detected by its silica content. While recent observations have indeed shown that there exists high
silica water inthe Baffin Basin (SiO2 > 80pg A/k - Corwin and
McGill (1963), Grant (1970)), there is no evidence of it getting over the sill and into the Labrador Basin. In fact, the Norwegian and Labrador Seas are characterized by a low
silica signal (SiO2 nu 10-15 pg A/k). As it shall be
demon-strated, these waters are easily detected along the western boundary of the western North Atlantic Ocean.
Armstrong (1965) showed the distinctly lower concentra-tions of silica in the deep Atlantic Ocean, when compared to the world oceans. He concluded that this was a result of the unique exchange of bottom waters that occurs in the
Atlantic Ocean and suggested that "...our understanding of
water movements and of mixing processes in the Atlantic Ocean would be greatly increased by more knowledge of the silica content of Arctic waters."
Metcalf (1969) showed that the concentration of dis-solved silica could be used to identify Antarctic Bottom Water, North Atlantic Deep Water, and Antarctic Intermediate Water. He also suggested that silica might be useful in studying the NADW where little variation in the potential temperature-salinity relationship is found.
Carmack (1973) found that silica was a valuable tracer in the Antarctic. He found that he could distinguish be-tween water masses that appeared indistinguishable on the basis of 0-S data alone.
2.2 The deep western North Atlantic Ocean
It is well known that there is a tight correlation be-tween potential temperature and salinity in the deep western North Atlantic Ocean for potential temperatures below 3.0*C
(Worthington and Metcalf (1961), Wright and Worthington
(1970)). Most of the water characterized by this 0-S
corre-lation for 0 > 1.9*C have been classified as North Atlantic
Deep Water (NADW) (Wright and Worthington (1970)). There is
little geographic variation in the 0-S distribution of the western North Atlantic in this potential temperature range
(Worthington and Wright (1970)). This has made it difficult
for physical oceanographers to study the deep general circu-lation in terms of potential temperature and salinity
characteristics.
Near the continental rise, geostrophic calculations and direct velocity measurements (neutrally buoyant float and
moored current meters) allowed observers to deduce the ex-istence of a deep southward flowing current (Swallow and Worthington (1961); Volkmann (1962); Richardson (1977)).
This flow has become known as the Western Boundary Under-current and is responsible for the equatorward movement of deep water from the Norwegian and Labrador Seas (Stommel
(1957); Richardson (1977); Clarke, Reiniger, Hill, and
Warren (1978)).
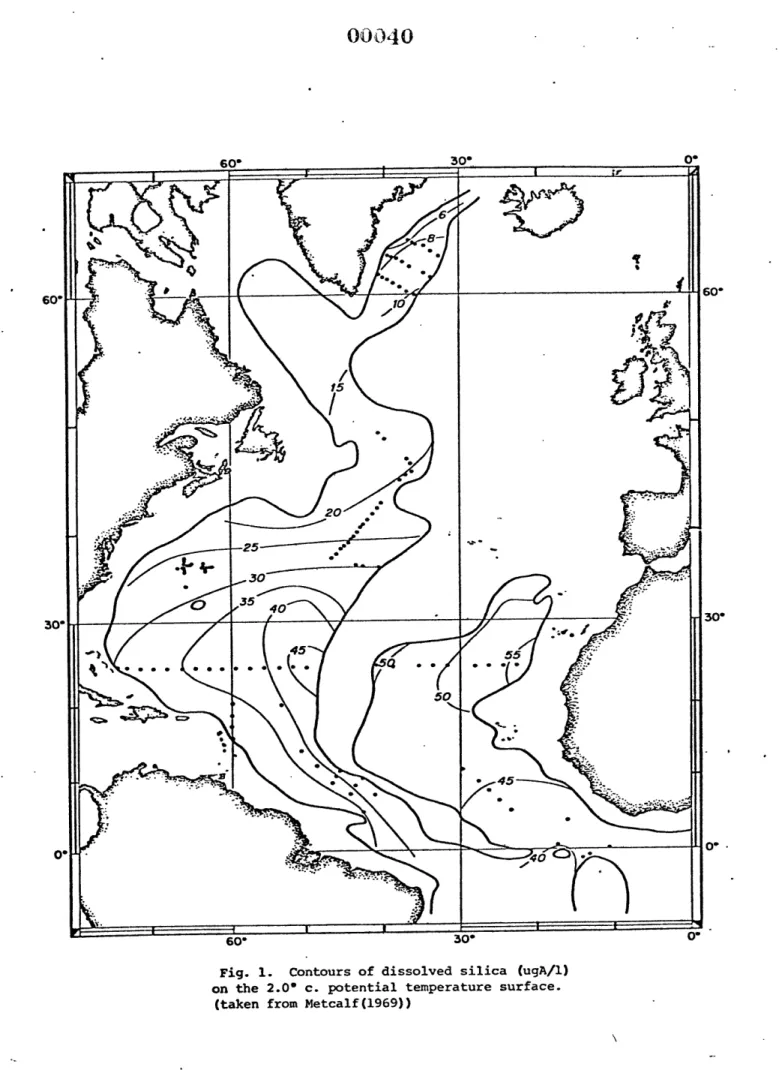
Metcalf (1969) demonstrated the usefulness of the dis-solved silica content of deep water as a water mass tracer. Using the available data, he constructed a map of the con-centration of dissolved silica on the 2.0*C potential tem-perature surface. His figure is reproduced as Fig. 1. The principal feature of this map is the general north-south gradient of dissolved silica. The paucity of data prevents a detailed analysis of the distribution but this map does suggest that dissolved silica is a useful tracer of the general circulation of the North Atlantic Ocean.
Richardson (1977) and Worthington (personal communica-tion) found that there is a drop in the silica concentration along potential isotherms as one approaches the continental rise.
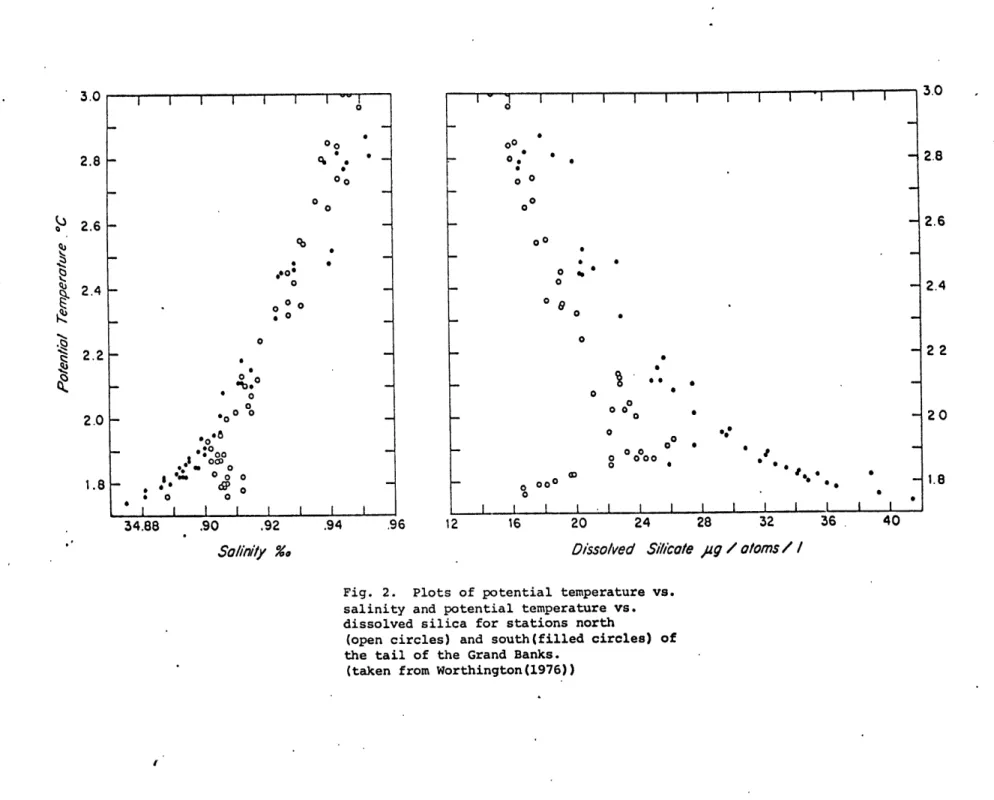
Worthington (1976) has proposed a model of the general circulation of the North Atlantic Ocean, in which he postu-lated the existence of two anti-cyclonic gyres. One to the north of the Grand Banks of Newfoundland, and the second comprised of the Gulf Stream and its return flow bounded to
the south by the Mediterranean salt tongue. In the deep water Worthington based his interpretation partly on the
change in the dissolved silica distribution in the deep water across the proposed boundary between the two gyres. His
fig-ure showing characteristic deep O-SiO2 plots for the two
gyres is reproduced as Fig. 2. Worthington's model also allows for a WBUC passing around the tail of the Grand Banks of Newfoundland and along the continental rise until it
crosses beneath the Gulf Stream near Cape Hatteras. He al-lows for no exchange of water between the WBUC and the south-ern gyre.
Clarke, Hill, Reiniger, and Warren (1978) have criti-cized Worthington's model. They claim that in the deep water, no evidence exists for two distinct gyres, and that the
silica distribution (from a survey of their own) indicates that there is an exchange of water between the "Northern Gyre" area and the Sargasso Sea.
In this work the distribution of dissolved silica in the deep western North Atlantic Ocean, based on several sec-tions occupied during the last two decades, shall be pre-sented. A large portion of the data is from the last six years. After presenting a summary of the data and methods of analysis used, we shall describe the water mass character-istics present and form a consistent picture of the
geo-graphical variations in the silica distribution. It shall be demonstrated that there are significant variations of the silica distribution within the NADW. These variations
will allow us to trace the origins of some components of the
NADW which cannot be distinguished on the basis of 0-S char-acteristics. The distribution of silica on potential temper-ature surfaces shall be examined and these distributions
compared with models of the general circulation. In addition the WBUC shall be examined by following its silica signal along the continental rise from the tail of the Grand Banks to Cape Hatteras. Evidence shall be presented for isopycnal mixing along the WBUC path, resulting in downstream dilution of the low silica WBUC water.
The data coverage of the western North Atlantic Ocean has expanded greatly over that which was available to Metcalf
(1969) and Worthington and Wright (1972). More structure in
the silica distribution can be discerned here than was pos-sible previously. The time span over which the data was collected must certainly be kept in mind. Little is known of the temporal variations of the deep water properties. That a consistent picture of the deep silica distribution can be presented is taken to indicate that these temporal variations are indeed small.
It must, of course, be kept in mind that local anomalies do exist. They may be either due to temporal, spatial, or possibly instrumental effects. As discussed in Appendix I large anomalies which contradict surrounding data must be suspect, but more reasonable local features are retained in the data set and are accepted as essential characteristics of the ocean. Where these features stand out they will be noted.
III. Data and Methods
The data used in this report was obtained by searching the WHOI and NODC oceanographic files for cruises in which temperature, salinity, and dissolved silica were measured. Only those cruises where salinities were measured by a con-ductivity bridge (i.e., three decimal place precision) were used. This basically restricted the data set to cruises
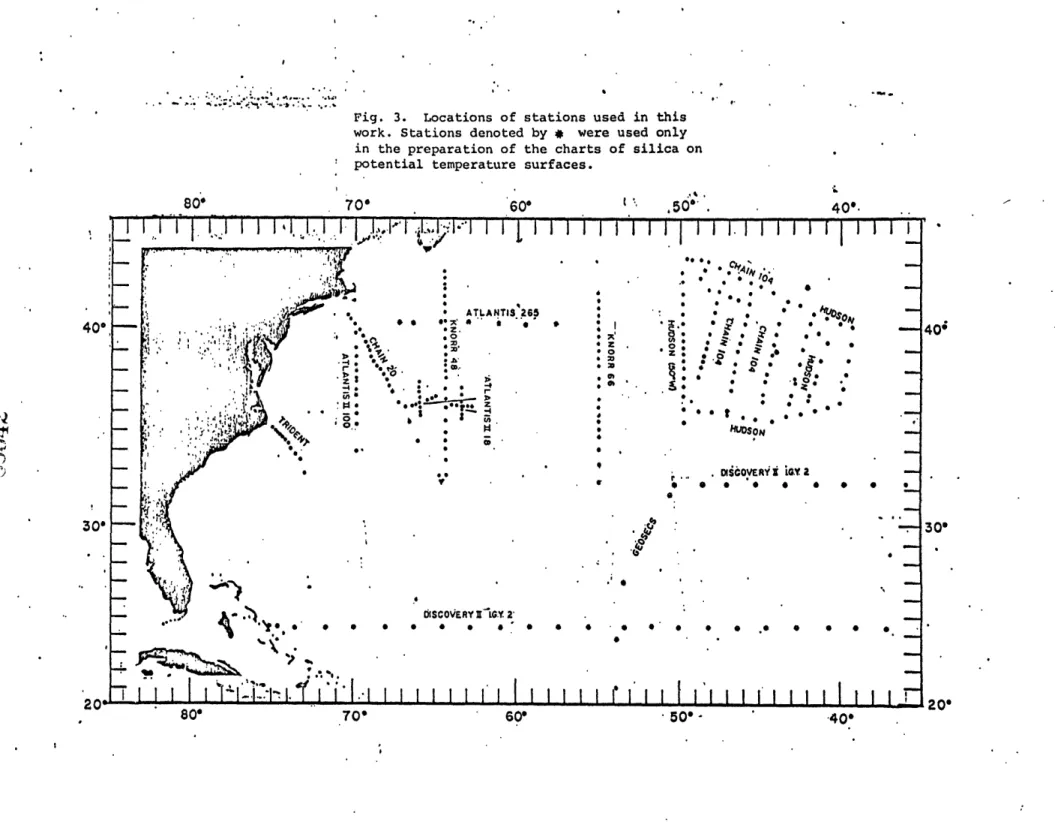
since 1958. The data used is summarized in Table 1 (Fig., 3). The
data from one cruise, KNORR 12, was rejected for reasons given in Appendix I.
In a few cases, duplicate sections (i.e., two or more sections at the same location) existed in the data. The section with more closely spaced stations was used. In add-ition, cruises for which samples were analyzed at sea were preferred to those during which the samples were frozen. All
of the data used in this report was analyzed at sea with either a spectrophotometer or autoanalyzer.
For all cruises except AII 100 (see below) the data were accepted as they existed in the files. Observations denoted as questionable by the observers were discarded. Plots of
O-SiO2 and S-SiO2 were formed and observations which
dis-agreed with the main body of data were rejected (see
discus-sion of O-SiO2 data). All of the data (again with the
exception of AII 100 as noted below) were from previously published sources (see Table I) and had been edited on the basis of the mean 6-S distribution of the North Atlantic Ocean.
14
Table I.
Cruise Location Previous Publication
DISCOVERY II ATLANTIS CHAIN ATLANTIS TRIDENT HUDSON CHAIN KNORR KNORR KNORR ATLANTIS I.G.Y. 2 240 30' N* 320 15' N* 265 40* 15' N* 20 Woods Hole-Bermuda 18 near 360N,66*W and 36*N,63*w Cape Hatteras 50*W and around the tail of the Grand Banks 104 30 48 66 100
around the tail of the Grand Banks
GEOSECS stations* 27-34 640 30'W 55*W 70*W 1958 1961 1961 1966 1971 1972
* used only in the preparation of
temperature surfaces
the maps of dissolved silica on potential
Year Ship
Metcalf (1969)
Worthington and Wright (1970)
Worthington and Wright (1970) Metcalf(1969)
Richardson (1977)
Clarke, Hill, Reiniger and Warren (1978)
Clarke, Hill, Reiniger and Warren (1978)
Broeker, Takahashi and Li(1976)
Worthington(in preparation) Worthington(in preparation) 1972 1972 1975 1977 1978
The section from cruise AII 100 was occupied by the author in the spring of 1978. The samples were collected with a 24-bottle rosette of Niskin bottles on a Neil Brown
CTD. For this work only the temperature data from the CTD
was used. The salinities were determined at sea on a Guild-line Autosal salinometer and the dissolved silica was de-termined with a spectrophotometer. The data were edited by plotting both salinity and silica versus pressure and remov-ing those points from which both salinity and silica values indicated contamination of the sample. For the thirteen
stations occupied, the worst had eight "contaminated" samples and the best had none (there were 24 samples per station). The final 0-S data set was then compared to the Worthington-Metcalf (1969) mean 0-S curve and no other questionable
salin-ities were obvious below 4.0*C.
The contour plots presented in Section V were prepared
by linearly interpolating the 0-SiO2 data for each station
to the 0 values used.
IV. Water Mass Characteristics
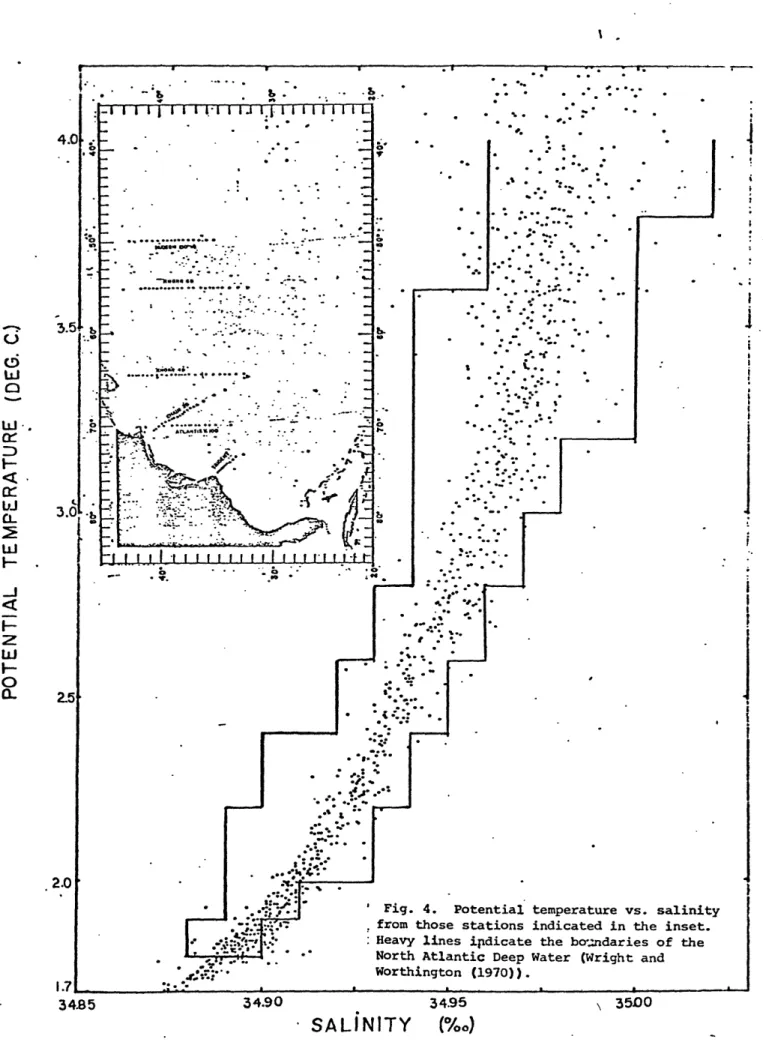
4.1 Potential temperature salinity characteristics As previously stated, the deep western North Atlantic Ocean is characterized by a tight potential temperature salin-ity correlation. Figure 4 is a composite plot of deep 6-S observations for those stations indicated. The boundaries of the North Atlantic Deep Water are indicated (Worthington
and Wright (1970)). Below the inflection point at 6 " 1.85*C
a low salinity tail is present indicating the effects of
Antarctic Bottom Water (Wright and Worthington (1970); Broeker, Takahashi, and Li (1976)).
4.2 Potential temperature-silica characteristics Figure 5 is a composite plot of deep observations of potential temperature and dissolved silica for those stations indicated. It should be noted that within the potential
tem-perature range of the North Atlantic Deep Water (6 > 1.9*C),
we find the maximum scatter in the 8-Sio2 plot.
Note also that for 0 < 1.850C there is a sharply
increas-ing silica tail correspondincreas-ing to the low salinity tail of the Antarctic Bottom Water (AABW) (Broeker, Takahashi, and Li
(1976)). This high silica branch is confined to the south of the tail of the Grand Banks of Newfoundland. One can see the difference clearly when the data are separated into groups of data from either side of the tail of the Grand Banks (see
Figures 6a and 6b). Those stations east of 50*W show no AABW.
This geographical limit to the northward influence of the AABW is similar to that used by Wright and Worthington (1970) in their volumetric potential temperature, salinity census of the North Atlantic Ocean. The AABW was seen clearly in the North American Basin, but not in the Labrador Basin (Figures 7a and 7b were reproduced from Wright and Worthington (1970)).
Wright and Worthington (1970) also found that in the Labrador Basin (but absent in the North American Basin) there
was a relatively saline (with respect to the Antarctic Bottom Water) and cold (6 < 1.9*C) water mass (Denmark Straits,
Overflow Water (DSOW)). In agreement with this we find that for 0 < 1.9*C, east of 50*W (Figure 6b), there is a low silica
branch on the O-SiO2 plot. This water is not generally
ob-served west of 50*W (see exception noted below).
The two branches of the 6-SiO2 plot come together at
o
". 1.9C as did the two branches of the 0-S distribution(Wright and Worthington (1970)). Worthington and Wright (1970)
showed that at 1.80C and below there is no direct path between
the AABW and the DSOW. It is between 1.80C and 1.90C a direct
path first exists (Figures 8a and 8b).
The data presented above suggest that for 0 < 1.9*C both salinity and dissolved silica can be used to identify the AABW and the DSOW.
In the range of the NADW (0 > 1.9C) one may take advan-tage of the wide variation of dissolved silica (whereas there is very little variation of salinity) to distinguish between water masses of different origin within the NADW.
In the data from east of 50*W (Figure 6b) there is a
distinct gap in the data from 0 = 1.9* to 3.4*C. The higher
silica branch runs from 0 Ix, 3.40C and SiO2 'x 18 pg A/ to
0 "u 1.9C and SiO2 n 32 pg A/ where it joins in with the
AABW and the DSOW. In this same potential temperature range,
there exists a lower silica branch running from 6 % 3.4C,
SiO2 "- 16 pg A/9 to 0 % 1.90C, SiO2 % 18 pg A/2. This lower silica water may be traced back into the Labrador and
Norwegian Seas (Grant (1970)), and is presumed to be the source of the Western Boundary Undercurrent (WBUC) (Richard-son (1976); Clarke, Hill, Reiniger, and Warren (1978)).
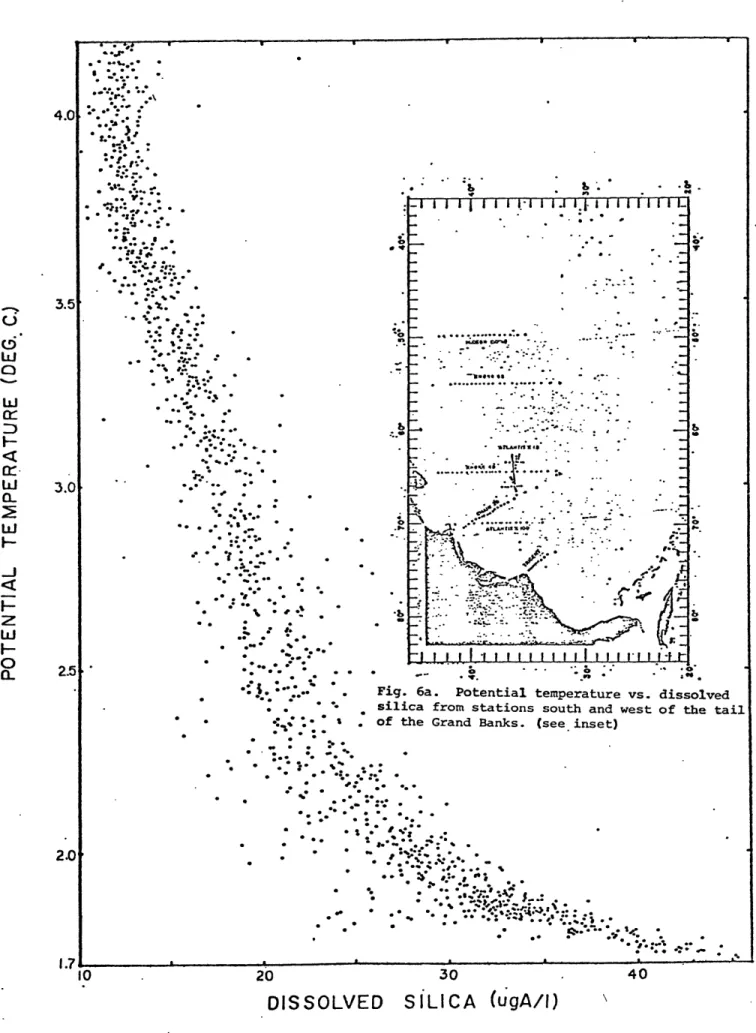
West of 50*W, the distribution is quite different (Figure 6a) in the NADW range of potential temperature. There are only a few observations to the low side of the majority of the observations. The distinct gap seen to the east is not evident here. In fact, most of the "anomalous" observations come from two cruises. The section along 50*W shows the two branched distributions clearly and also shows
some of the DSOW water at 0 % 1.8*C (Figure 9). This
sec-tion was grouped with the western group because of the AABW
seen for e < 1.90C and SiO2 > 30 pg A/2. The other source
of the anomalous data is AII 18 (Figure 10). These data
also show evidence of DSOW (0 % 1.85*C, SiO 2 'u 24 pg A/k).
These are the only observations of the water mass at a point so far west. Since these observations of the DSOW are so isolated, it is assumed that there was an intrusion of this water mass into the area at the time these data were
collected.
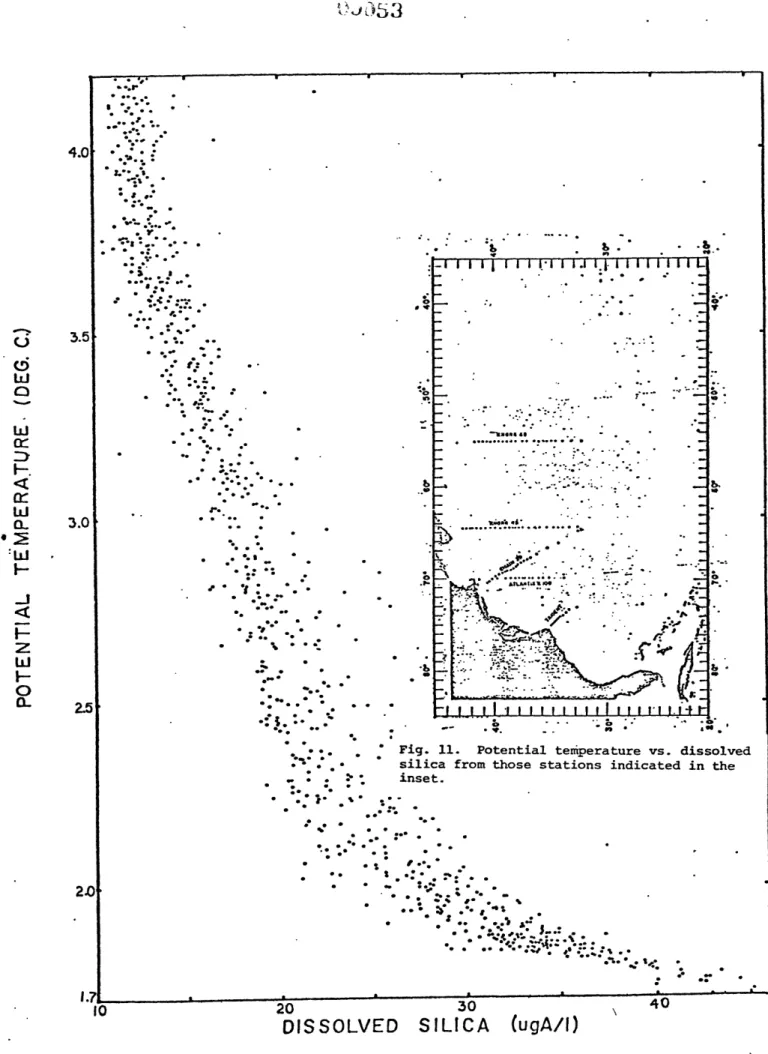
With the two sections discussed above deleted, the
o
- SiO2 distribution west of 50*W consists of a broad lineof values from 0 = 3.5*C and SiO2 = 14 pg A/ to 0 = 1.9*C
SiO2 = 30 pg A/ where it meets the AABW (Figure 11).
We stated previously that it was, in general, the lower values of silica that were found closer inshore. This will become more clear when the charts of silica on constant
potential temperature surfaces are discussed in Section V. The reason for the lower values inshore is assumed to be the influence of the WBUC (Richardson (1976); Worthington (1976)).
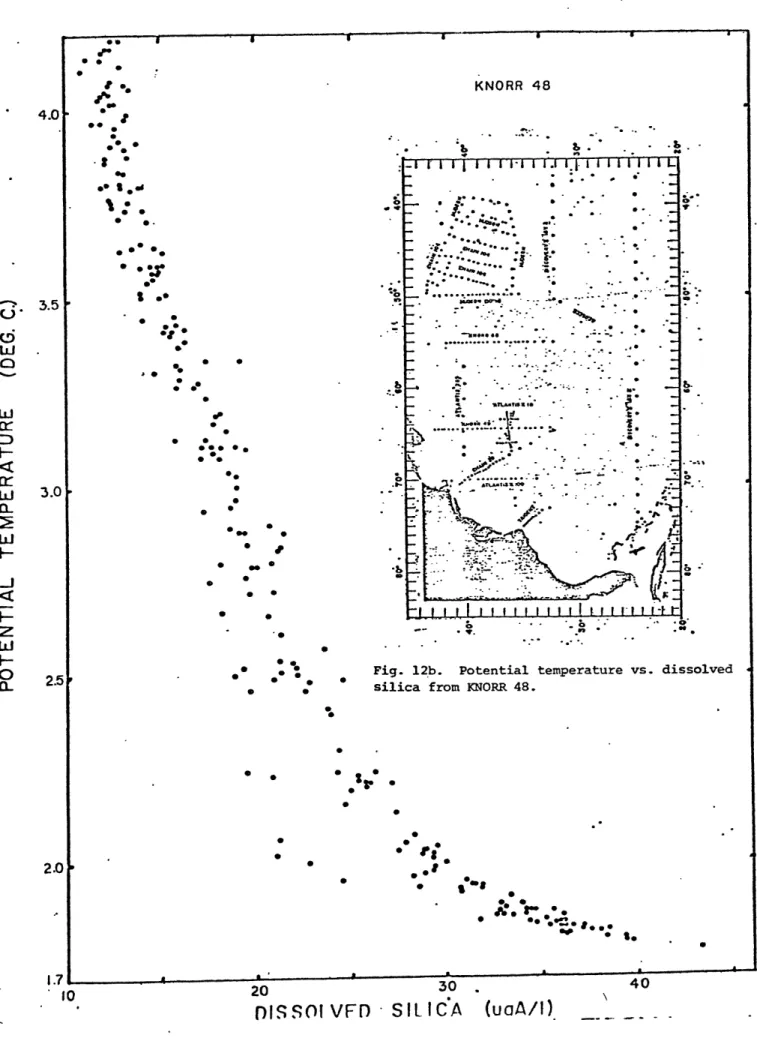
Examination of the individual sections which extend from the abyssal plain up onto the continental rise reveals that while there is a general tendency toward lower values of silica inshore, the strength of the gradient and the extreme
values vary considerably (Figures 12a-e). The figures may be
divided into two categories. The first are those sections which show a distinct gap between the WBUC and the remainder
of the NADW (HUDSON, KN 48). The second are those which show
a continuous band of observations but are limited to a range
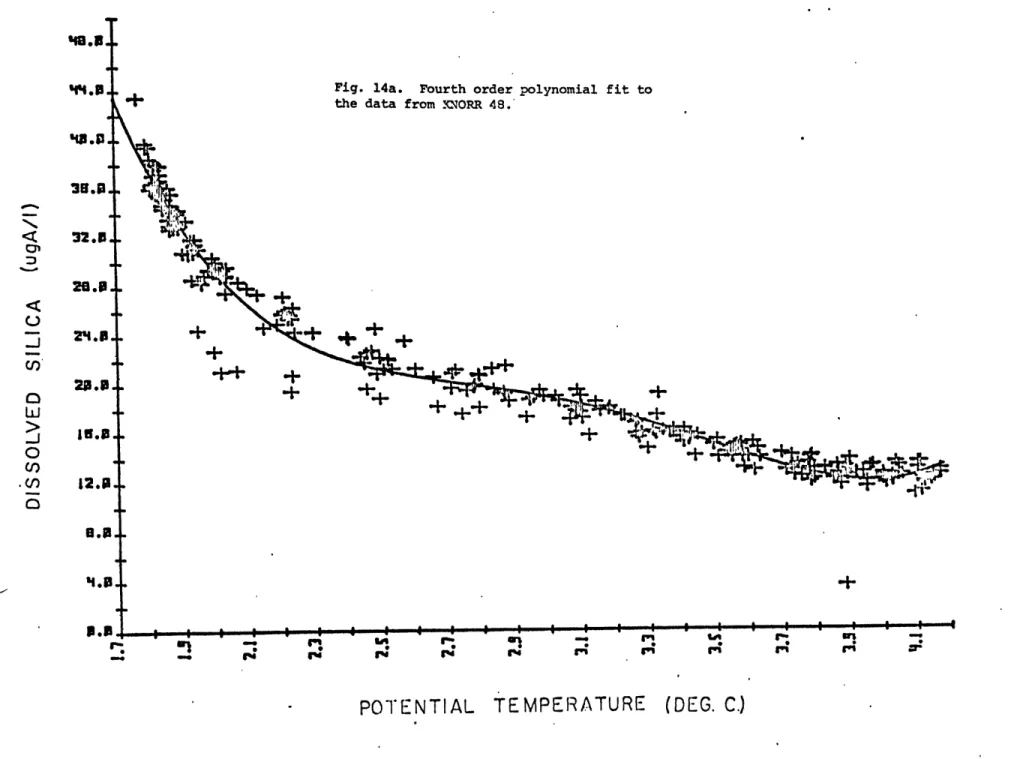
of values within the extremes of HUDSON and KN 48 (AII 100, CH 20, TRIDENT). These types of distributions are grouped geographically, the two branched distributions being to the east (east of 65*W) and the more uniform distributions being to the west.
4.2.1 Polynomial fits to the potential temperature silica relationship
To quantify the differences between these distribu-tions, polynomial fits to the data were made. It was found that little was gained for fits of higher than fourth order. The fits were obtained with a least square polynomial
regres-sion program for the Hewlett-Packard 9830 calculator. The
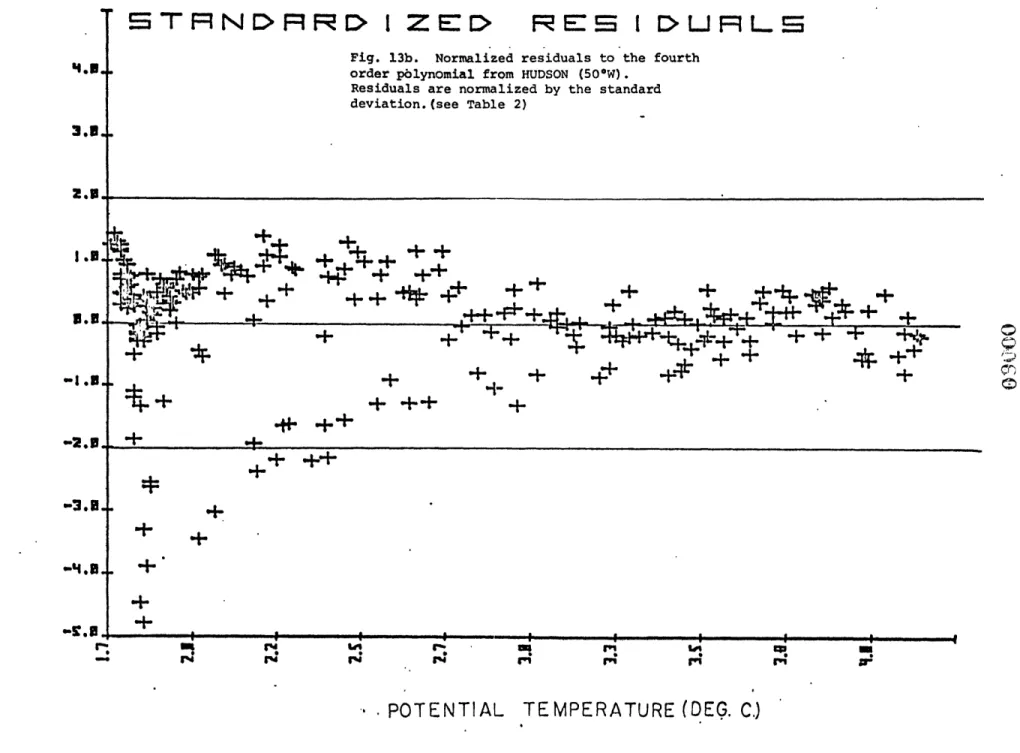
fits and residuals are presented in Figures 13-17. Root mean
(Table 2). It should be noted that the r.m.s. deviations are lower to the west than to the east, the plots of the residuals show that for CH 20, AII 100, and TRIDENT, the residuals are evenly distributed between ±2a with an increase of the scatter toward lower potential temperatures. For both KN 48 and
HUDSON, we find that the residuals are evenly distributed
above 0 = 3.0*C but break into two branches for 0 < 3.0*C.
The low residuals can readily be identified in the WBUC water
which forms the low silica branch of the 0 - SiO2 plots. To
illustrate the effects of the WBUC on the fits, the inshore stations were removed (containing the WBUC observations) from the KN 48 and HUDSON sections and re-computed the fits
(Figures 18, 19). The r.m.s. deviations are now 1.10 for
HUDSON and 1.01 for KN 48. The plots of the residuals now show a more uniform distribution than did the fits including the WBUC. The curves fitted to the KN 48 (65*W) and HUDSON
(50*W) sections with the WBUC removed are nearly identical
(Figure 20). To the west of 65*W, the three fits produce
similar curves. Above 20*C those for TRIDENT and AII 100 are nearly identical and CHAIN 20 shows a deviation from the
other two between 2.50 and 40C (Figure 21). In Figure 21 a
2 standard deviation envelope has been included to show that the discrepancies are not statistically significant even from
2.5 C + 4C.
To demonstrate that the WBUC has an effect on the
21
Table II.
Cruise Location Stand4rd Deviation
(ugA/l)
HUDSON 50*W 2.72
KNORR 48 650W 1.46
CHAIN 20 Woods Hole-Bermuda 1.41
ATLANTISII 100 70*W 1.10
and TRIDENT were plotted along with HUDSON and KN 48 (With WBUC
removed) (Figure 22). The 2a envelope is from KN 48. It can
be shown that for 2.00 < 0 < 2.40*C there is a significant
dif-ference between the AII, CH 20, TRIDENT curves and the HUDSON
aknd KN 48, indicating that the water of the WBUC has a
signifi-cant effect west of 650W.
It should be emphasized that the data being compared were collected over a span of several years. The three sections
which show- the effect of the WBUC west of 650W were occupied in
1961, 1971, and 1978 (CH 20, TRIDENT and AII 100, respectively).
Th-e cons-istency of the data suggests that the conditions were not anomalous at the time of the observations.
For comparison, the e ' SiO2 plots for the sections
dis-cussed above are presented again with the KN 48 (without WBUC) curve and 2a envelope (Figures 23a-h).
Thus it has been shown while there are dramatic changes
in the 0 - SiO distribution from the tail of the Grand Banks 2
of Newfoundland to Cape Hatteras, one can demonstrate that the low silica signal of the WBUC can be traced throughout the region.
V. The Distribution of DIssolved Silica on Surface of Constant Potential Temperature
In the previous section, the plots of silica versus po-tential temperature demonstrated the existence of geographic variations in the silica distribution of the deep western North Atlantic Ocean. In particular, it was found that near
the tail of the Grand Banks of Newfoundland and along the
continental rise as far west as 650W, the North Atlantic deep
water consisted of two distinct water masses, easily disting-uished by their silica content. Further west, the water masses
could not be so easily separated on the O-SiO2 plots,
how-ever, it was shown that the low silica water did have a
sig-nificant effect on Q-SiO2 relationship as far west as Cape
Hatteras.
To illustrate further the geographic variability of the silica distribution, four potential temperature* surfaces were chosen upon which to prepare contour maps of the silica distribution (Figures 24-27).
The data base used in preparing these maps is presented in Table I.
For potential temperatures less than 1.9*C one cannot trace water continuously throughout the North Atlantic Ocean. Figures 8a,b (Worthington and Wright (1970)).
Between 1.8*C and 1.9*C the bottom waters from northern and southern origin come in direct contact.
*Due to the tight 6-S relationship in the deep western
North Atlantic Ocean for 0 < 3.0C (Wright and
Worth-ington (1970); WorthWorth-ington and Metcalf (1961)) poten-tial temperature surfaces nearly coincide with potenpoten-tial density surfaces.
5.1 The 1.90 potential temperature surface
The distributions of dissolved silica on the 1.9*C
sur-face (Figure 24) shows the general southward increase in silica
noted by Metcalf (1969) on the 2.0*C surface (see Figure 1). Along the mid-Atlantic Ridge, a tongue of high silica water is found to extend northward. This is AABW and was
identified by Metcalf (1969) using the same IGY sections. In the vicinity of the tail of the Grand Banks of New-foundland, there is a sharp silica gradient, with the lowest values inshore, following the bottom topography. One should
note that this sharp gradient cannot be traced westward around
the tail of the Grand Banks. The lowest contours (<22.5 pgA/L) are only resolved by a few observations and our interpretation of this as a continuous feature may not be justified. Since none of the very low silica water penetrates around the tail of the Grand Banks, it is not associated with the WBUC, but rather with the Denmark Straits overflow water that is usually observed to be confined to the Labrador Basin (Figure 2, Wright and
Worthington (1970); Worthington (1976)). Away from the contin-ental rise the silica values are uniformly high (>35 yg A/i) and join with the plume of AABW extending north. It should be
noted that 1.9*C is the potential temperature at which the
O-SiO2 and
e-S
(Wright and Worthington (1970)) plots show thejoining of the DSOW and AABW (Figure 5).
West of 50*W, the silica distribution takes on a differ-ent character. There is a decrease in the silica values as
one approaches the continental rise but the sharp gradient of the DSOW is not present. After passing around the tail of the Grand Banks, the 30 and 32.5 pg A/Z contours diverge leaving a large area with little change in the silica concentration. This is the location of the deep anti-cyclonic gyre proposed
by Worthington (1976).
It should also be noted that the 30 pg A/t contour
follows the topography of the continental rise until it dis-appears west of 70*W. It is commonly observed that the lowest silica contours will follow the topography until they end by running into the coast indicating some mixing process
(Figures 24-27).
5.2 The 2.2*C potential temperature surface
On the 2.2*C potential temperature surface (Figure 25) the general north-south gradient is again present with a zonal gradient with the higher values of silica being found along the mid-Atlantic Ridge. There is a sharp gradient near the tail of the Grand Banks with the lowest value nearest the continental rise. This gradient may be traced along the continental rise and westward around the tail of the Grand Banks.
In contrast to the 1.90C surface, the sharp gradient
along the continental rise may be traced further west to
650W. As it was previously defined, this is the WBUC
trans-porting water southward from the deep Labrador Sea (.Grant
West of 65*W the gradient weakens. The 20 pg A/Z con-tour runs into the coast and the 22.5 and 25 pg A/t concon-tours diverge. Similar to the 1.9*C surface, the silica contours on the 2.2*C surface, away from the continental rise, near the Grand Banks diverge as one proceeds westward. Here the
25 and 27.5 pg A/k contours diverge. The waters above the
abyssal plain are characterized by a nearly uniform distribu-tion of silica.
5.3 The 2.4*C potential temperature surface
The 2.4*C potential temperature surface, Figure 26, is similar to the 2.2*C surface. We see once again the northwest-southeast gradient with the highest values of silica found
along the mid-Atlantic Ridge and the lowest along the continen-tal rise.
One can trace a sharp silica gradient from the tail of the Grand Banks westward to 65*W where the 20 and 22.5 pg A/ contours then diverge in a similar fashion to the 22.5 and
25 pg A/Z contours on the 2.2*C surface. Also similar to the 2.2*C surface, the 22.5 and 25 pg A/Z are close together near
the tail of the Grand Banks but diverge when traced westward beyond 50*W. Thus it is found that the waters above the abyssal plain nearly uniform in silica.
The inshore gradient on the 2.4*C surface is not as sharp
as that seen on the 2.20
C surface. As shown on the
e-SiO
2 plots (Figure 23a for example) the spread between the WBUC water and the remainder of the NADW increases with decreasing5.4 The 3,0*C potential temperature surface
The 3.0* potential temperature surface (Figure 27)
shows a departure from the contribution on the previous sur-faces. There is the expected southward increase in silica but at this potential temperature, there is open communica-tion across the mid-Atlantic Ridge. The data indicate a
sharp gradient near 320N with abrupt changes above the
mid-Atlantic RIdge. These features are not well resolved and shall only be pointed out here without further comment.
Near the tail of the Grand Banks, and along the contin-ental rise, the sharp gradients seen on the previous surfaces are no longer present. The distribution is nearly uniform throughout the entire region north of 35*N from the Grand
Banks to Cape Hatteras. This was shown also in the O-SiO2
plots (see Figure 5) by the narrowing of the Q-Sio2 scatter
for 6 > 3.0*C.
VI. Discussion
6.1 The 0-SiO2 relationship
In the preceding sections a silica minimum (on surfaces of constant potential temperature) was found along the
con-tinental rise. This feature has been associated with the
WBUC (Richardson (1977); Clark, Hill, Reiniger, and Warren (1978)). It has been demonstrated that the low silica
water can be traced from the tail of the Grand Banks of New-foundland to Cape Hatteras. However, it was also found
that the 6-SiO2 characteristics of the WBUC do not remain
un-changed throughout the region of study. There is a marked
change in the 6-SiO2 relationship to the west of 650W. The
data suggest that a narrow band of low silica water comes around the tail of the Grand Banks and extends to 65*W along the con-tinental rise. Further west, the silica minimum is less pro-nounced. The two branches of the O-SiO2 plot seen at 50*W are no longer distinguishable at 70*W where a more diffuse silica pattern exists. At 50*W the low silica branch was
8-10 pg A/k lower in silica (for 0 = 20-2.2*C) than the high
silica branch. When compared to the high silica branch at
the KN 48 (650W) station (or equivalently the high silica
branch of the HUDSON section, see Figure 22), the TRIDENT,
AII 100, and CH 20 sections all show a 2-4 pg A/ silica
deficit in the same potential temperature range.
The process(es) responsible for the alteration of the
0-SiO2
relationship west of 650W is not a simple one to iden-tify. The distribution of dissolved silica has been described, but it has not been related to the flow field. It has beensuggested that since the low silica water undoubtedly
originated in the northern regions, its presence in a narrow band along the continental rise implies the existence of a
WBUC.
6.2 Geostrophic transport measurements
Several observers have made hydrographic sections and computed the geostrophic transport of the WBUC. Richardson
(1977) compared the results and Table III is reproduced from
his work. A wide range of values is found. How much of the variability represents changes in the mass flux of the WBUC and how much is due to the choice of stations or the method used to establish the absolute velocities is not known.
Richardson (1977) has described the methods used in each com-putation and suggested possible error sources. All of the data listed in Table III came from sections to the west of
650W.
There are few available calculations of the transport to the east. Clarke, Hill, Reiniger, and Warren (1978) found no evidence for the WBUC at 50*W but they suggested that this was due to unrealistic reference velocities used. The current meters used to adjust the geostrophic velocities were probably outside the WBUC (see further discussion below).
Worthington (1970), in his model of the circulation of 16 3
the North Atlantic Ocean, allows only 6 x 10 m /s to flow in
the WBUC, although he suggests that the flow may be unsteady. +6 3
Although Worthington's 6 x 10 m /s is smaller than most of the observations to the west of 65*W, it is not felt that any of the measurements are precise enough to be compared. Collectively, these data do suggest that the WBUC is present
from the Grand Banks to Cape Hatteras. It cannot, from the
available data, be determined if any changes in the transport
are occurring to accompany the changes in the 0-SiO2
Table III.
(taken from Richardson (1977))
Volume transport estimates of the Western Boundary Undercurrent. The value in parenthesis is the r.m.s. deviation of the innividual transports about the mean.
Measured by Transport Latitude Date
6 3
(10 m /sec)
Swallow & Worthington(1961) 7 33 Mar 1957
Volkmann (1962) 50 38 Jul 1959
17 38 Jul 1960
Barrett (1965) 4 35 Oct 1962
12 35 Oct 1962
Worthington & Kawai (1972) 2 35 Nov 1966
Richardson & Knauss (1971) 12 35 Jul 1967
Amos,Gordon & Schneider(1971) 22 31 May 1968
6.3 Moored current meter observations
There have been several current meters moored in the
WBUC. Along 70*W steady westward flow was observed for
eight months on the upper continental rise (bottom depth
<4000) (Luyten (1977)). Off Cape Hatteras, records less than
one month long show flow to the southwest directly beneath
the Gulf Stream (Richardson (1977)). Recent data from the
Blake-Bahama Outer Ridge indicate the presence of a strong
westward flow (Rhines, personal communication). To the east,
at 50*W, a two-month record just to the south of the tail of the Grand Banks shows a predominently westward flow. In gen-eral, however, the current meter data along 50*W and along
another line to the north of the Grand Banks running southeast, show little evidence of the WBUC. Clarke, Hill, Reiniger,
and Warren (1978) remarked that "...our velocity vectors do not show a definite westward flow along the continental slope
in conformity with the unequivocal evidence in the deep silica
field for the western boundary undercurrent." They suggested
that the disparity between the current meter and hydrographic data was due to a difference in the time scale to which the two
types of data respond. While this may in fact be true, an alternative explanation is offered. In this case, it appears
that the current meters were placed outside the WBUC. Some idea of the location of the WBUC may be gained from the deep
silica data (Figure 28). The 2,0*C potential isotherm has
been added to and one can identify the WBUC where the silica contours sharply turn downward and cross the isotherm. Note
also the slope of the 2.0*C isotherm indicating the presence of deep shear. Along the section running southeast (Figure 29) none of the instruments were in the low silica water. Along 50*W (Figure 28) one instrument is located clearly within the
low silica water. The record from this instrument shows a
predominantly westward flow for two months (Figure 30). Thus
we feel that the disparity between the current meter and hydro-graphic data is due to the location of the instruments outside the WBUC.
Fortunately, it is along 50*W that the silica data pro-vides the clearcut evidence for the WBUC. Along 70*W and near Cape Hatteras, the silica data alone suggests only that the WBUC has had some influence but the current meter data and the geostrophic transport calculations offer evidence that the
undercurrent is present. It is from this observation that one
may anticipate that the change in the silica distribution is not due to a fundamental change in the character of the flow, but rather is caused by some external effect which results in an exchange of water between the WBUC and the central basin.
6.4 Enhanced mixing west of 650W
The current meter data may be used to offer a suggestion as to the nature of the process which provokes this exchange
of water particles. Current meter measurements along both
70*W and 550W indicate that the floT.? ovor the abyssal plain is
characterized by energetic eddy activity (Schmitz (1976)(1978);
silica distribution by the nearly uniform silica level over the abyssal plain (Figure 24).
When the WBUC rounds the tail of the Grand Banks, it fol-lows the topography westward and effectively skirts around the deep eddy field. After passing through the New England sea-mount chain (near 65*W) the topography steers the WBUC south-ward and forces it to flow directly under the Gulf Stream and presumably into more vigorous contact with the deep eddy field.
Thus the topography steers the flow into a region of enhanced mixing which exchanges the low silica water along isopycnal
surfaces with the surrounding North Atlantic deep water, thus eroding the silica signal and providing the smoother distribu-tion observed.
VII. Summary
The distribution of dissolved silica in the deep western North Atlantic Ocean has been presented. It has been found that the dissolved silica content can be used, in conjunction with potential temperature, to identify water masses.
For potential temperatures less than 1.9*C the dissolved silica potential temperature relationship is similar to the salinity potential temperature relationship. Both show two distinct branches which identify the Denmark Straits overflow and the Antarctic bottom water.
In the North Atlantic deep water, where the 6-S
a wide range of values. It has been shown that a silica mini-mum, on surfaces of constant potential temperature, can be traced along the continental rise from the tail of the Grand Banks of Newfoundland to Cape Hatteras.
The low silica water has been termed the Western Boundary Undercurrent (for historical reasons), which has been inter-preted as the mechanism by which water is transported from the Norwegian and Labrador Seas toward the equator.
Given this observed silica distribution, one is left with a difficult task of interpretation. The WBUC is the most
prominent feature in the distribution yet little is known about the structure of the flow. What roles do advection and diffu-sion play in determining the observed silica distribution? It has been hypothesized that a region of enhanced mixing is present west of 65*W. It has been suggested that this enhanced mixing is due to the presence of the deep eddy field observed with moored current meters.
Appendix I. Rejected Data
The data collected on KNORR 12 has been rejected because
of anomalous 0-S and 6-SiO2 characteristics. This was
unfortu-nate since the stations were located in the region between 55*W
and 650W where there is no other data (Figure 31).
The -S relationship from KN 12 shows a consistent bias toward lower salinities when compared to neighboring sections
(Figure 32). The 6-SiO2 relationship shows a consistent bias
35
It may be argued that the low salinity and high silica values imply an intrusion of water from the south. However, since these anomalous conditions were observed in the data from only a single cruise, it is felt that they should be suspect.
ACKNOWLEDGEMENTS
An advisor who is willing to give advice when sought and support when needed is extremely important to a graduate
student. Jim Luyten has been such an advisor.
There are many people who have helped in the preparation of this thesis and in my training as an oceanographer. I would like to thank Val Worthington and Mike McCartney for teaching me the joys of collecting hydrographic data. Thanks are also due to all those who helped on ATLANTIS II 100.
Val Worthington and Bruce Warren generously allowed me to use their unpublished data.
I would like to thank Doris Haight for typing this manuscript.
Finally, I would like to express my thanks to the other students in the WHOI/MIT Joint Program in Oceanography who have been a constant source of encouragement and enjoyment. I am particularly indebted to Nan Bray, Dean Roemmich,
Neal Pettigrew, and John Toole for being patient whenever I took to roaming the halls.
BIBLIOGRAPHY
Armstrong, F. A. J. (1965). Silicon. In: Chemical
Oceanog-raphy, Vol. I. Eds. J. P. Riley and G. Skirrow.
Broecker, W. S., T. Takahashi, and Y.-H. Li (1976). Hydrography
of the central Atlantic - I: The two degree discontinuity.
Deep-Sea Research 23, pp. 1083-1104.
Carmack, E. C. (1973) Silicate and potential temperature in the deep and bottom waters of the western Weddell Sea. Deep-Sea Research 20, 927-932.
Clarke, R. A., H. W. Hill, R. F. Reiniger, and B. A. Warren
(1978). Current system south and east of the Grand Banks of Newfoundland, in press.
Cooper, L. H. N. (1952) Factors affecting the distribution of silicate in the North Atlantic Ocean and the formation of North Atlantic deep water. J. Mar. Biol. Ass. U. K. 30,
511-526.
Corwin, N. A. and D. A. McGill (1963). Nutrient Distribution
In the Labrador Sea and Baffin Bay. U. S. Coast Guard Bulletin #48.
Luyten, J. R. (1977). Scales of motion in the deep Gulf Stream
and across the Continental Rise. JMR 35, 49-74.
Metcalf, W. G. (1969). Dissolved silicate in the deep North
Atlantic. Deep-Sea Research 16 supplement, 139-145.
Richards, F. A. (1958), Dissolved silicate and related
prop-erties of some western North Atlantic Caribvean waters. JMR 17, 449-465.
Richardson, P. L. (1977). On the crossover between the Gulf stream and the western boundary undercurrent. Deep-Sea Research 24, 139-159.
Schmitz, W. J. (1977). On the deep general circulation in the
western North Atlantic. JMR 35, 21-28.
Schmitz, W. J. (1978) Observations of the vertical distribu-tion of low frequency kinetic energy in the western North Atlantic. JMR 36, 295-310.
Stommel, H. M. (1957). A survey of ocean current theory.
Deep-Sea Research 4, 149-184.
Sverdrup, H. U., M. W. Johnson, and R. H. Fleming (1942).
The Oceans: Their physics, chemistry and general biology. Prentice Hall, 1087 pp.
Swallow, J. C. and L. V. Worthington (1961). An observation of
a deep countercurrent in the western North Atlantic. Deep-Sea Research 8, 1-19.
Volkmann, G. (1962). Deep current observations in the western
North Atlantic. Deep-Sea Research 9, 493-500.
Webster, F. (1969). Vertical profiles of horizontal ocean
currents. Deep-Sea Research 15, 85-98.
Worthington, L. V. (1976). On the North Atlantic circulation.
The Johns Hopkins Oceanographic Studies 6, 110 p.
Worthington, L. V. and W. R. Wright (1970). North Atlantic
Ocean atlas of potential temperature and salinity in the deep water including temperature, salinity, and oxygen profiles from the Erika Dan cruise of 1962. Woods Hole Oceanographic Institution Atlas Series, 2. 58 plates.
39
Worthington, L. V. and W. R. Wright (1971). Discussion of
a paper by X. LePichon, S. Eittreirr and J. Ewing, "A
sedimentary channel along Gibbs Fracture Zone." JGR 76,
6606-6608.
Wright, W. R. and L. V. Worthington (1970). The water masses
of the North Atlantic Ocean; a volumetric census of temperature and salinity. Ser. Atlas Mar. Envir. 19,
00040
60.. 300 10r
--25 20. 30 45 55 5o 460Fig. 1. Contours of dissolved silica (ugA/l) on the 2.0' c. potential temperature surface.
0 0o 0 0 0 0 0 0 .0 C0O o 0 0 o 0 1 00 0 0 0 0 I I I I I .90 .92 .94 .96 12 Salinity %, I~ 1 I I I I I I I 00 0o 000 *0 Se 0 0 0 0 0 0 * 0 0 000 0 * * S S 0 1 0 0 000 * S ~ 0 1 16 20 24 28 32 36 40
Dissolved SIlicate pig / atoms / /
3.0 2.8 2.6 2.4 22 -.8
Fig. 2. Plots of potential temperature vs. salinity and potential temperature vs. dissolved silica for stations north
(open circles) and south(filled circles) of the tail of the Grand Banks.
(taken from Worthington(1976))
2.8 2.6 2.4 2.2 2.0 -1.8 0 34.88 I I I I
Fig. 3. Locations of stations used in this
work. Stations denoted by * were used only
in the preparation of the charts of silica on potential temperature surfaces.
80* 70* -'_ _ _-_'__ .l__ _ _ _ _ - I 1 L 'C ~. 0 .- 4. I-. 20 40 30* * 0 * ATLANTIS 265 *. *.~*.** 3 0 02. 00 .5. .1. 'et'-.0* * 0 * 0* 5 5 4'. *SS0*~ *OofSO ~ * 0 V .* 0 *2 -'I, -'0 DISCOVERY I LGY. 2' 0 0 0 **** * 0 * 0 *.iy ,~ .0 6 ** 'Oq Os ** 0 * 0 0 * 0 * S
j:
:
F
*0* * * S 2. * * 0 -. S .. ~ 0 '~ 0 * * a *4 0 ~ I' ' * *~Al 'S 0 * 0 0 .' *. $* ' * 0 * *.--* . DisO.VE RYi G.Y 2
I.... e e * * 0 0 0 * e 30' 20* SO' 7.'.6. .Q...*.0 60* .50 40*. I F qk. .5 JAJ 70* 60* '50*- -40*0 t..O .
043
t..J Cc 4.0 . -C-O . . 3.5 zO 3.0 e -2----5- -I.- .-. . 2.5J bt 2.0 X .*.-. -- a .- *Fig. 4. Potential temperature vs. salinity
from those stations indicated in the inset.
: Heavy lines ipdicate the bcr.ndaries of the
North Atlantic Deep Water (Wright and
Worthington (1970)).
3485 34.90 34.95 s 3500
000C44
. .. s-. ., .. **- -* *S~b -. , , . 4.0 P% .. .* , - * - *--. . .- - . - o o 3.0. - - .. -CL. 81b:.* .-. - . :- - -- t.- -. . -. - :. .I.-. . ---- .*-..-.- --" .. :..-- - -. .- .. . silca ro ths4ttosidctdi h .. --. .: ... inet ... ... . . . -* - .-.. - . -.-. 3.5. .LOi 3.0 4 .z2 2 * *4I .'. *Fig. 5. Potential temperature vs. dissolved
-sili.ca from those stations indicated in the
0~~~ *.* - 07. 0 *~ 00~ o.. 4. 20 30 4.
t.... * S ... , . .... e e 0 Al *.. .....* :.* 1., goe* e S. ... .*:. .a ... 0 a 0 0 to 0 . e..-.. ... ... . . - . - * . * * . * *.. -* *0. . *.* -.-. * es*.. *, .. .*.. . *. 5a 0 1, - - . . 0 .
Fig. 6a. Potential temperature vs silica from stations south and wes of the Grand Banks. (see inset)
* -; * SS 0 LiJ CL i -CL
DISSOLVED SILICA (ugA/I)
3.51
.. 0. . dissolved of the tail .-~1-I--j Ii I [I -*..--..- . -- --'a I-: 1* -2.5 2.0 I.7 0PLATE 4 34.70 34.80 34.90 35.00 35.10 4.0 -13.9 69 ' I 19 .t i.59
2,e". 27
18 12 2426 /0476 14991 .X6 553 5 S960 3 452 0 34.80 34.90 SALINITY (e/*a)NORTH AMERICAN BASIN
A Volumetric Census
.The nurher n iach bo* gvs rhe volume of .ster , thoands of cu.ct kom!ers, in at
.The fiatc numt-%er fletcaf to*) at the right of exh diagraem gve tre vorum, subterilsx 41to
.m') by f rin' rv. a
*The fi.C mumbe., in the hCOr.znl row at the tutto-n of eacht d.h .ag~ ta nd thk hr.Ior-fa no.s above Ile 10' "n 20* Isoes in the warm water diagram. g-se the volume sub-otals
(0 10, hr'") by Sa'-mryrrv'
.The tor ore of .,..e (, 10' k') i each dgrm aCs shown m 4ta14s at the-l- r ght
. ,. c,,d rms on the rm tr d e reresent thermosterc anomaly m cententers
per ton (ci!! ) On ithe cold w~a'er diagram the curves showi potential thermoveic Frc~a y
CENT 50% of total volume 75% of total volume 90% of total volume 0.S. *3..4 7 3 ese ... -*.J 7t -35 16'-Y-4*-30. 34*Ce-76%0 4*-3. .34 4'!. r.. 4*-30' 16es'-30' " -1.0 0.5 0.0 281081 26/02'" 0 I3968 7 64 3 940530 42251 tPv . G.aGAMUA. . P'" C i.T NJ
ASPA.J01.A C LORAPCIUCAZ.6'ACUXY. I"
Voulo 1i
Fig. 7a.
(taken from Wright and Worthington (1970))
Z; -2.4 .] g2.0 0 a- L5
PLATE 2 34.70 34.80 34.90 35.00 35.10 4.0 1 . 2 . v . - , ' 1 . . . 1 4.0 u *2A - 2.2 2.0 z 0 IaI LABRADOR BASIN A Volumetric Census
.Th n be w e 1ch bo. res tt.e vlme of w.ter n thousands f cub. 1ometers m th
.I he u- a numes(eiclrw at the rght o' e ach d sc i gve fle .1-e e s Ato'a-s (. 10
h,j bly temfreature tervah.
." .c r. the hoN t ro t .too of .h d r a-d te horzortal
rws above th, 10* and 20' I---. .th. Aa- .ce d r. the voi. e sbt.ots
(1 10 krr)- by sa, Illy mea
. tne WIa "-."m of Mlle (0 16' 1,.' . eVch d..,:-,J e, shown In stt.:s a* the, lower t'ht aN~d o,,eI.
-The c.ed brees onl, the -- * water d .srne'ectemseramay ceriftaf-S
Vr- Ior Ict'tI) Olt the co1 =A4 1 d.gram thel curvs Sh. PotNb1.s' tl -rr s'in a Im
50% of total volurne 75% of total volume 9011 of
totalvolum-~7f/~JX
:~ ~ ):. L.Lj ~ 0-4*. 34 10%71-35.16%1 10487/i a-A'. -34 70- 1693 7..' 0-4* 10656 4 4'-30. 3h 4%. -37 6%. 33?8 4 -30. *34 4%. 175 Ters s'- xr33145 9 1er4 o -3X7 140X 3ALRLP1CA7CLIbRCAJ1CA1 MDITI , I9n
Srfit AL. TLAS Of I ti L .'A:%I F U %if .I ST
Fig. 7b.
(taken from Wright and Worthington(1970))
34 42 ..4, - -.11 c --, -s
--SALINITY (S..) AT TlE I C POTr.NTIAL 1!.MPIRA-1URV St-l ACV
Fig. 8a.
(taken from Worthington and Wright (1970))
00049
e5K 9)7
92
040 7<..
Yf. r
SA LINITY (/,)AT T HE 1.9'C POTENTIA L 'lLMiPi RATUIP.E. SURl'A CE
Fig. 8b.
(taken from Worthington and Wright (1970))
I * . 4. ** *- -~000~l *00 0 * 0 * *00* .0 000 S ~0 * 0% .0 0 0 0 0 0 0 * a 00 00 .0 0 0. 0 0 0 0 0 0 0. 0 03 00 0 0 *** 0 0 * .*a . * .y
-tail of the Grand Banks. (see inset)
a-0 * : 170 * . DI 00 0 . e 2.0 . .* ** . *' o~~ u0 1*.. Fi.6.0oetiltmprtrev.disle
DISSOLVD
S
frIC stain)ot n atoh
. - -- * --0 -- *. . -.... . 04 -..-- 0 -. - -- - --1- - . - . 3.5 3.0 0 LiiJ 0
cr.
Lii -LJ '0CL
1 0POTENTIAL
TEMP.ERATURE.
(DEG.
C.).
0 IV 0 0 o %10ot0 0 , 0 * e Og 0 0 e 0 *e * 0 0 0 0 0 e et* S 0 0 I-.. M 00 Crt*o o.~ OM Di CA SO*. 70 ' I I .6* * ~. ~' ~4Li 2 ~1'
A I. *wg.*#vtIawg It, iij~! 60- .50 . . 40*. LI I I I I I I .I Ij II II I I I III I II I I .3 I .0 a 79L ;:* 0 0 0 ** 0 0 6 6 .0 *00** *i * 01-~ ;*1-~
~
40...
0 0 0 0 , 0 0 , 1 0 I * 90 0 0 0. 0 0 -. e 0 0 e 0 ~00 0 9 . 0 0 00 09 e (A s 0 * 0 000 0* or.
0 I * ?6 * 00 0'7!
3V. tu . . 49.i.Ai h% 0oe ..
*
ATLANTISU[
18
S*. * 55 0 gO St.. S * e. eS .. * 0 e ,0 * 5O( e . ** S 0 0 0*a%-* S S * ~ 0 b - #4 :.. --*.... . -e *,.. ... 5 5iy1so e4-e -*. e% *~4u~m4*. -- 9.1*%. .5- ...- -I# w. *
SQ
L ..:w
0 --jZ
Q.. -.-* ". OS' ~0 OS.,. * .3 * S S ~ 1 . 5 *0 ***~* :I.I:,~IE~.s:~S1.7
- 20 30 401o
oIS
SOIiVFD
SILICA
(uA/I)
4.0
3.5 t
Fig. 10. Potential temperature vs.
dissolved silica from ATLANTIS II 18.
3.0 1.
-2.5
4.0 .* 0 . 0.55 * s o 0 --. 0 5. .. . s ,, -. .. . e * ,.5 55 a .**... .*. ... --.-. I 1.1 Ij I I I 1 IL -I I ...
Fig. 11. Potential temperature vs. dissolved
silica from those stations indicated in the inset. 555 .s S St ~ S... 24ft 145 5 55 20 30
DISSOLVED SILICA (ugA/l)
I I j I I I I*I 0 -1.71 K0 4U 0 a I a I 40