Driving Change in Commodity Management in Engineering Led Firms Through Optimization Studies, Modeling, and Data Driven Decision Making
By Jeremy Weinstein
B.S. Chemical Engineering, Rensselaer Polytechnic Institute (2001) Submitted to the Sloan School of Management and the Department of Electrical
Engineering in Partial Fulfillment of the Requirements for the Degrees of Master of Business Administration
Signature of Author
Certified by
and
Master of Science in Electrical Engineering
In Conjunction with the Leaders for Manufacturing Program at the Massachusetts Institute of Technology
June 2006
02006 Massachusetts Institute of Technology. All rights reserved.
f
Sloan School of Management Departmedt of Electrical Engineering and Computer Science May 6, 2006iesis
Supervisor rno)Ue
ricUMssur U1 ivianagement ScienceCertified by
alies ,miniey, i nesis Supervisor Professor of Electrical Engineering
Accepted by
cogram
tement
Accepted by
Art Theses
Department of Electrical Engineering and Computer Science
MA SSUETS INSTITUTE, OF TECHNOLOGY
NOV
L
2 2006
LIBRARIES
Driving Change in Commodity Management in Engineering Led Firms through
Optimization Studies, Modeling, and Data Driven Decision Making
by
Jeremy Weinstein
Submitted to the Sloan School of Management and Department of Electrical Engineering on May 6, 2006 in partial fulfillment of the Requirements
for the Degrees of Master of Business Administration and Master of Science in Electrical Engineering Abstract
Engineering focused companies often find difficulty in managing costs. As the innovations begin to slow and key products are commoditized these companies often find themselves far behind their competition from a cost perspective and quickly lose margin and market share. Shifting the supply organization towards one of cost awareness is a difficult and slow task. The challenge and goal in changing the mindset of the organization is to create a team which actively seeks and analyzes all opportunities to remove inefficiencies in the purchasing and management of supply. Large cost cutting initiatives start the process, but changing the mentality and culture of a supply organization involves more than shifting the factory footprint, reducing inventory, and taking away the free pots of coffee.
ABB is a large global engineering company with products ranging from automation to power technology. Historically relying on technological superiority and a strong customer focus, ABB has focused energy on growth of the top line revenues, and was inconsistent in managing the bottom line costs. In 2004 ABB margins were the thinnest among all of their competitors, and they were the furthest behind in EC sourcing.
This thesis emphasizes the need for engineering companies to manage commodity costs and describes different activities, performed within ABB to change the mentality and the culture of the supply organization from one of cost acceptance to one of cost awareness. The challenges in managing the indirect commodity spends at ABB will be outlined and the need for optimization studies, modeling, and data driven decision making to control costs and quality will be shown. Discussed will be the difficulties and discoveries from three projects: the modeling and optimization of European ground transportation, the management of a pan-European team to manage the electrical energy spends, and the development of cost models for training of the supply organization. These activities were performed to challenge the complacent mindset toward managing commodity costs and to effect organizational change.
Following the discussion of specific projects and results, higher level thoughts and more general considerations will be summarized.
Thesis Supervisor: Jeremie Gallien
Title: Assistant Professor of Management Thesis Supervisor: James Kirtley
Title: Professor of Electrical Engineering Company Sponsor: John Walker
Acknowledgements
The Leaders for Manufacturing Program has been afantastic learning experience. The diversity and knowledge of colleagues, faculty, and industry partners allowed for a unique learning environment that promoted open thought and development. I am grateful to have been a part of such an amazing program This internship and thesis would not have been possible without the tremendous opportunities provided to
me by ABB. Thank you very much to the people at ABB headquarters in Oerlikon, Switzerland for guidance and knowledge sharing. Also thanks to my contacts in Sweden, Poland, Germany, Italy,
Switzerland and Spain for giving me historical context and in-depth process knowledge. And special thanks to my project supervisor, John Walker, for his support and vision. Thanks also, to Oliver Bergmann for his guidance and trust and in addition to Francois Roblin, Herbert Brecheis, and
Table of Contents
1 INTRODUCTION AND OVERVIEW...9
1.1 PROJECT MOTIVATION AND GOAL ... 10
1.2
PROJECT A PPROACH ... ...---. ...- .-... .--... 1010... 1.3 T HESIS O VERVIEW ...--... ... ----... 122 ABB AND GROUP SUPPLY MANAGEMENT BACKGROUND...13
2.1 CORPORATE STRUCTURE ...-- - .. 13
2.2 GLOBAL BUSINESSES VS. GEOGRAPHIC ORGANIZATIONS ... 14
2.3 ABB COMPETITIVE ENVIRONMENT...15
2.4 GLOBAL SUPPLY CHAIN ORGANIZATIONAL STRUCTURE...15
3 EUROPEAN BUSINESS ENVIRONMENT FOR GROUND TRANSPORTATION...18
3.1 ABB FACTORY, SUPPLIER AND CUSTOMER PROFILE ... ... 18
3.2 FACTORY PROFILE AND LOGISTICS ... 19
3.3 TRANSPORTATION CARRIERS AND LOGISTICAL MODELS ... 23
4 OPTIMIZATION SOLUTION DEVELOPMENT...27
4.1 O PTIM IZATION O PTIONS...---... ... ---... 27
4.2 COST M ODEL D EVELOPMENT... ... ... . ...-- 30
5 OPTIMIZATION MODEL ANALYSIS...38
5.1 FLOW B ALANCING ...---... ... ... 38
5.2 M ILK RUNS / SHUTTLES ... 40
5.3 HUB / CROSS-DOCKING SOLUTIONS ... 45
5.4 SUMMARY AND RECOMMENDATIONS FOR THE TRANSPORTATION OPTIMIZATION STUDY ... 49
6 CHANGING M INDS AND M INDSETS... 52
6.1 ORGANIZATIONAL CHANGE MODELS... .. ... 52
7 ORGANIZATIONAL CHANGE AND LEADERSHIP ANALYSIS ... 56
7.1 USING THE THREE PERSPECTIVES ON ORGANIZATIONAL PROCESSES...56
7.2 VIRTUAL TEAMS AND CROSS-SITE PROJECTS ... 67
7.3 PROJECT LEADERSHIP ANALYSIS ... 70
8 CO NCLUSIO NS ... --- . ...---... 76
9 BIBLIOGRAPHY ...---. . ---... 79
10 AUTHOR'S BIOGRAPHY ...--.... ... ---.----... 81
11 APPENDIX A: MILK RUN MODEL EXAMPLE FOR SPANISH FACTORY ... 82
Table of Figures:
Figure 1. Direct Comm odity Team Structure ... 17
Figure 2. Indirect Commodity Team Structure... 17
Figure 3. Transformer types: Dry-Type and Oil Immersed Distribution Transformers, and Oil Im m ersed Pow er Transform ers... 19
Figure 4. Investigated ABB European factories with PP-TR, PP-MV, PP-HV and RO for op tim ization study ... 20
Figure 5. Transformer factory types and outputs... 21
Figure 6. PP-TR inter-factory shipments with the arrows representing direction of traffic and the magnitude of the line and arrow representing the dollar value of traffic... 22
Figure 7. Map of supplier locations for ABB European transformer facilities. ... 23
Figure 8. Schematic of logistics model where ABB coordinated, tracked and followed-up on sh ip p in g issu es. ... 2 5 Figure 9. Schematic of external logistics model where a supplier implant coordinates, tracks, and follow s up on shipping issues ... 25
Figure 10. Schematic of current and future states for the flow balancing solution ... 28
Figure 11. Schematic of milk run/shuttle optimized solution... 29
Figure 12. Schematic of a hub / cross docking optimization solution... 29
Figure 13. Scale and change magnitude for the different optimization options... 30
Figure 14. Characteristics of full truck load (FTL) and less than truck load (LTL) shipping ... 31
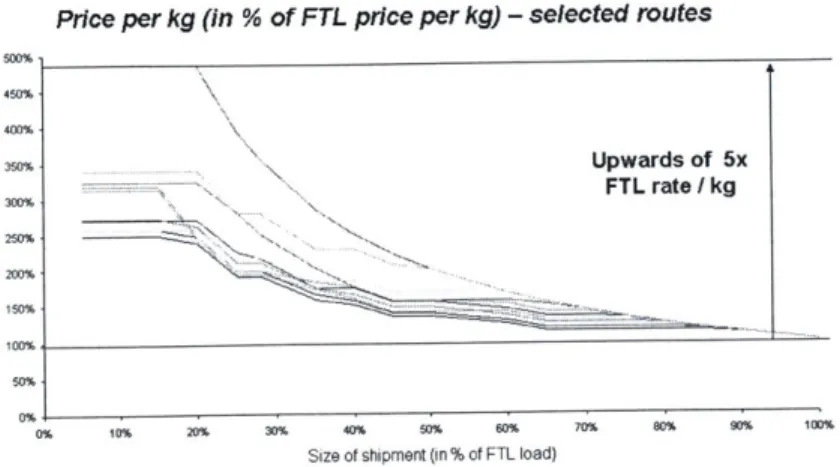
Figure 15. LTL shipping cost increase as compared with FTL shipping ... 32
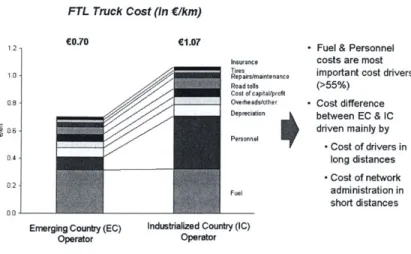
Figure 16. Trucking cost drivers for emerging country (EC) and industrialized country (IC)... 33
Figure 17. Representation and explanation of distance and LTL premium costs... 34
Figure 18. Representation and explanation of the access and handling costs drivers ... 34
Figure 19. Model for exponentially decreasing handling costs vs. fill factor... 35
Figure 20. Summary of optimization schemes with cost drivers and success factors ... 36
Figure 21. FTL and LTL model parameters. The FTL model is a simple model based on distance that is accurate if distance > 200 km; the LTL model is based on distance costs, an LTL premium for less than full trucks, and handling and access costs. ... 37
Figure 23. Results from modeling flow balancing for the local sites (percentage savings included
below site) ... ... 39
Figure 24. Map of Spanish distribution facility with top 20 European suppliers ... 42
Figure 25. Sam ple m ilk run input ... 42
Figure 26. Two proposed milk runs for a German facility. ... 43
Figure 27. Results from potential milk runs at two distribution transformer sites. ... 44
Figure 28: Schematic and assumptions of a hub / cross docking solution... 46
Figure 29. Locations of two proposed hubs and an optimal hub for pan-European shipping... 47
Figure 30. Model results for the cost savings opportunity for a two hub European solution... 48
Figure 31. Summary of savings potential for the proposed optimization solutions. ... 49
Figure 32. Ease / impact matrix for the potential optimization solution. ... 49
Figure 33. M odels for organizational change ... 52
Figure 34. Ten commandments for enacting organizational change ... 55
Figure 35. Organization chart showing group supply chain management and the location of the LFM intern relative the country and business unit organizations... 58
Figure 36. Sample iron casting cost model used to identify cost drivers ... 64
1
Introduction and Overview
ABB is a global company with over 150 manufacturing factories across countries in North America, Europe and Asia. ABB offers a wide range of products and services in power technologies, process automation and robotics, and systems. Within these product families, ABB is seeking, as a strategic objective, to increase manufacturing excellence and reduce commodity costs.
ABB had grown historically through the strategic acquisition of companies which augment the core competencies of ABB, mainly power and automation technologies. Individual factories have maintained their autonomy of decision making as well as the responsibility to perform on a profit and loss statement. Tying the company together was ABACUS, software that allowed for internal analysis of the financial performance of each individual company. As the company grew, the structure evolved into a matrix of a strategic hierarchy for product and design decisions, and country hierarchy for the control and reporting of the financial figures. This structure allowed the individual companies to respond quickly to domestic markets and encouraged each company to be self sustainable. In addition, this structure effectively isolated factories from one another, did not stimulate cooperation, and at times put ABB factories against one another in bidding wars.
Nearly three years ago ABB was struggling to maintain profitability. To recover, a newly nominated CEO began to sell off all non-profitable, non-core activities and reduced debt payments through financial re-engineered. Over the past two years, to remain competitive, ABB had struggled to decrease
manufacturing cycle-times, increase quality, streamline product designs, eliminate overlap in production, and reduce commodity costs.
To accomplish a reduction in commodity costs, commodities were first divided into two categories, indirect and direct. Direct commodities included all supply which directly goes into the manufacturing of ABB products, such as core steel, copper wiring, steel cabinets and cases, etc. Indirect commodities include transportation of material, electrical energy purchase, travel expenses, cell phones, etc... that supported the manufacturing of the finished products. Cross company, virtual teams were formed to manage each of the commodity spends.
My project focused directly on two of these commodity teams: transportation and electrical energy. Over 100 million dollars was spent on the ground transportation of ABB material in 2004. In the past there was limited communication between factories to leverage the overall ABB volume and achieve economies of scale. Silos were developed based on product groups, and factories of different product groups were only occasionally coordinated at a country level. Attempts at global coordination and optimization were met with stiff resistance in the organization and could neither be agreed upon nor implemented. The majority of this document will discuss the approach, the challenges, the modeling and the conclusions gained from performing a detailed study of the transformer division (PP-TR) within ABB Europe.
In addition to the transportation project, the thesis author managed the electrical energy commodity team; a team formed of country representatives from the top nine spends of electrical energy across Europe. Each representative had different levels of experience in the position, knowledge of their markets, and had multiple local responsibilities that often conflicted with the development and implementation of strategies at the country sites. Proper management and progress reporting required careful definition of the current state within each country, as well as a detailed picture of the critical events and actions that
affected each region. Negotiating the responsibilities of local stakeholders to global commodity team was a challenge.
1.1 Project Motivation and Goal
Managing the flow of material across a network of factories, suppliers and customers could be a costly and complex challenge. Multinational corporations with global factories footprints were faced with additional country-specific regulations that impeded the free flow of materials and added to the cycle time and cost of these shipments. Adding to the complications were factors, which were shared across many large companies: a diverse group of products, a changing base of suppliers, and few repeat customers locations.
As a company grew, the solution of these complex logistics issues were often delegated to the control of the individual sites, allowing each factory to ensure that it had the material that it needed to meet production schedules and customer requirements. However, this method led to local optimizations with each of the sights developing its own information technology infrastructure and supplier base based on non-uniform requirements and cost structures. In a company of significant size, the economies of scale and scope should allow for better than market pricing for material transportation, based on increased volume with decreased variation. However, by disaggregating the total volume of supply, and decentralizing the decision-making, leveraging the total network volume and building consensus from all of the local decision-makers became complex and problematic.
The goal of this project was to perform an optimization study of ground transportation of materials across the ABB European network and present the results and recommendations. Discussion included a
summary of the issues involved with defining and structuring the optimization problem, as well as case studies and models to determine where efforts with limited resources should be focused for maximum return. The true purpose of this project was to show that there was opportunity for cost savings by changing the way the supply organization approached commodity management issues - working smarter not harder.
A different approach of working with local sites for data collection and idea generation was developed to confront the challenging ground transportation situation. The strengths and limitations with this approach will be outlined. By applying the collected local data with developed cost models, a clear picture of savings was seen of opportunities within the organization. A roadmap was developed to determine the structure and scope of the response, allowing for determination of where the largest cost savings would be realized and have a high probability of success. Finally, the challenges involved in developing and implementing a global solution in a decentralized company structure and gaining uniform buy-in will be discussed.
1.2
Project Approach
The approach for this project followed three phases: Phase 1: Current state investigation and definition; Phase 2: Building consensus, gathering support, and collecting data; Phase 3: Model development and cost structure analysis; and Phase 4, Feasibility analysis and roadmap creation.
Phase 1: Current state definition and project scoping
The current state of inbound and outbound material transportation was defined for divisions within ABB Europe at a high level, using e-smart supply-side data, to show the volume and complexity. E-smart is a
software application that allowed for review and analysis of supply spend data parsed by business unit, region, supplier, etc. The approach and scope of the project to focus only on the transformer division will be discussed, and limitations with this approach will be highlighted. The three types of optimization schemes: matching flows, milk-run and shuttle solutions, and global hub and cross-docking solutions were selected and will be discussed in detail later in the thesis.
Deliverables from this phase included the following
* Initial maps of the supply material flow across the network * Identification of factories on which to focus more investigation. * Selection of optimization schemes to model
Phase 2: Building Support, Gathering Buy-in, and Collecting Data
The second phase of the project began with the development and distribution of a general survey to collect initial information about the focus factories. This information was used to develop accurate supplier and customer maps for each factory and for the network in general. However, this information was not easily obtained and very often required repeated documentation of the value of the project, site visits and at times, escalating issues through the chain of command. Site visits were invaluable. Deliverables from this phase included the following:
* Understanding the differentiating product and process flows across ABB facilities * Detailed supplier maps
* Process flow maps for the two types of logistical shipping models within the factories. * Detailed flow information on the customers and suppliers of the selected factories. Phase 3: Model Development
Models were developed for each of the possible optimization schemes by working with transportation providers to determine costs, existing contracts to determine pricing, and an existing limited trucking cost model. Other cost models were enhanced to include the two groups of underlying costs associated with hiring trucks, which were per kilometer costs, such as gas, maintenance, with a premium based on fill factor, and access costs, such as administration fees, permits, insurance, etc, with a premium based on fill factor due to handling fees.
Deliverables from this portion of the project included the following:
* Cost model development for matching inbound and outbound flow of goods * Cost model development for performing a milk run or shuttle
* Cost model development for shipping through global hubs.
Phase 4: Feasibility analysis, Implementation Issues and Roadmap Creation
Finally, using the data acquired from the local sites, each optimization scheme will be tested for
feasibility at the local, regional and pan-European levels. From this analysis, a best case cost savings was developed for each of the schemes, regardless of the cost of implementation and the associated issues. These issues can be divided into four categories: cultural issues, strategic issues, provider uniformity, and the changing supplier/factory landscape. The first were cultural issues, which included factory planning changes, alignment of factory goals, relationships with transportation providers, communicating with local factories etc. The second was strategic issues, such as decreasing cycle-times to customers, and not paying for supply deliver. The third was supplier uniformity issues. Transportation providers do not provide uniform service across Europe and thus global solutions will always favor certain factories and cost others in quality or reliability. The fourth were issues associated with a changing supplier and factory landscape, and thus any solution will have to be somewhat flexible. These issues will be discussed in detail and then a roadmap for implementation and next step analysis will be presented.
Deliverables from this portion of the project include the following:
* Numerical analysis of ABB data with approximations of cost savings for each optimization solution.
* Recommended roadmap of how to move forward with the optimization solutions. * Clear identification of implementation issues with recommended solutions. " Identification of other opportunities for future analysis
1.3
Thesis Overview
The thesis proceeds as follows:
Chapter 2, ABB and Group Supply Management Background provides a brief explanation of the management structure, culture and competitive environment of ABB as well as a more in-depth look at the structure of supply management within ABB.
Chapter 3, Business Context for European Ground Transportation discusses the transportation indirect commodity team and outlines the business environment for pan-European ground transportation. Chapter 4, Cost Model Development describes the development of trucking cost models for analysis of the optimization routines discussed in chapter 6. Also modeled was the effect of EC vs. IC trucking. Product cost models were developed and will also be discussed to promote cost up negotiating techniques.
Chapter 5, Optimization Routine Model Analysis will discuss the limitations and results from each of the different optimization routines that were examined. Focus will be on the critical factors for success moving forward.
Chapter 6, Changing Minds and Mindsets will discuss research and activities undertaken to change the mindset and culture of the supply organization. An analysis will be discussed of past behaviors with suggestions of future activities such as workshops to create a flexible, fast moving, and cost aware organization.
Chapter 7, Organizational Change and Leadership Analysis examines this thesis work from the three perspectives of organizational processes - strategic design, political, and cultural. This chapter also includes a project leadership assessment, evaluation of the change process, and recommendations for continued success in global supply chain management. Power in the organization will be discussed and how the reporting structure should be reorganized to align strategic objectives with overall business goals. Chapter 8, Conclusions ties the results and discussion of the preceding chapters together and offers some perspectives on how the framework developed in this thesis can be applied to other engineering-led firms navigating the perilous waters of cultural change and cost management.
2 ABB and Group Supply management Background
This chapter provides a brief explanation of the management structure, culture and competitive environment of ABB as well as a more in-depth look at the structure of ABB group level supply management. A short history of ABB's formation and development is also included. The objective of this chapter is to provide the reader with a sufficient knowledge of ABB's business structure, products, and culture to understand the remaining chapters of the thesis.
2.1 Corporate Structure
In 1987 ASEA AB of Vasterits, Sweden and BBC Brown Boveri Ltd of Baden, Switzerland, announced a merger of their operations to form ABB Asea Brown Boveri Ltd, one of the largest electrical engineering companies in the world. The global headquarters was decided to be Zurich, Switzerland. Prior to the merger Asea was one of the top ten companies in the world in power technology and had 12 years of manufacturing experience in building industrial robots. BBC had nearly 100 years of experience in power transmission and a market almost exclusive of the Asea's market.
In its first year ABB acquired over 40 companies including the power transmission and distribution businesses of Westinghouse Corporation. Over the next 10 years, under the leadership of Percy Barnevik, ABB was focused on growth, both organic and through aggressive acquisitions. In 1998 ABB acquired Elsag Bailey Process Automation, the largest acquisition in its history to become the market leader in the global automation market.
In 1999, ABB began to divest non-core businesses and sold off the nuclear power, power generation, and rail businesses. Financial services were sold in 2002 and the Oil, Gas and Petrochemicals divisions as well as the Building Systems businesses were put up for sale. The company reorganized its core businesses into Power Technologies and Automation Technologies and continued to divest all non-core businesses. Under the divisions were the business areas that acted as "silos", or isolated vertical units within the company that did not communicate or coordinate with each other. Business areas were as follows: Transformers (PP-TR), Medium Voltage Products (PP-MV), High voltage products (PP-HV), Manufacturing Automation and robotics (RO), Process Automation (ATPA), Automation Products (ATAP), and Systems Engineering. In 2004 Fred Kindle became the youngest CEO of ABB and Michele Demare was hired as the CFO. (ABB Website)
ABB Organization 2006:
"We need to take what has been accomplished and established in the last two years and lead it forward to ensure further profitable growth." - Fred Kindle (Webpage)
In 2006 in order to strengthen execution, exploit economies of scale and scope, and to accelerate global optimization and globalization, ABB restructured. The core divisions of power technology and
automation were eliminated and new business areas were created and elevated to division status. The new business areas became the following: power products, power systems, automation products, process automation, and robotics. In addition, geographic areas, which were countries, were aggregated into regions with more executive level control available for each. Two positions were created, one to focus on global markets and technology to manage the geographic profit and loss, and the other position to manage operations. The operations position tied together mergers and acquisitions, manufacturing and supply chain, and footprint to create a coherent strategy moving forward.
2.2 Global Businesses vs. Geographic Organizations
Local business units, named LBUs, reported not only to the global business divisions, but also to the geographic organizations. The role of the global business unit was the following:
* Run the businesses from R&D to sales * Primary profit and loss responsibility
* Maximize global performance of specified products * Execute strategies and deliver expected results
The global business units were the heart of ABB and had the mandate to develop, manufacture, market and sell innovative products to maximize global penetration and profitability. The global business units set the direction and decided the product mix for specific factories or business area units, BAUs, and were supported by the geographic organizations.
The roles of the geographic organizations were the following: * Actively support business lines
* Monitor performance of business lines
* Carry legal and tax responsibilities for the factories within the region
* Provide efficient customer and factory support for cooperation and flexibility " Provide a key decision maker and spokesperson for ABB on a country level
Historically, the geographic organization allowed for each autonomous business unit to be flexible and quick to react to changes in the market or country to which it provided products and services. In addition, because Europe did not have uniform tax laws, the global organization would handle all tax implications within their regions. Another role of the geographic organization was to coordinate operations and commodity purchases, such as electrical energy, between regional factories.
Both the global businesses and geographic organizations were directed by the corporate center, whose responsibility it was to shape policy and strategy, drive execution and performance to the strategy and provide shared services, such as IT.
2.3 ABB Competitive Environment
ABB's two major product divisions were power products, selling items such as transformers, relays and gas insulated switchgear, and automation products, selling items from small to large manufacturing robots. ABB's revenues from 2002-2004 had averaged around 20 billion dollars, and they were either the market leaders or second, from a volume perspective, in each of the market segments in which they compete.
In the power technology business, ABB's major competitors included giants such as GE, Siemens, and Honeywell, as well as Areva and Emerson Electric. These companies sold similar products to similar industries, but in general had smaller market shares than ABB. However, from a financial perspective, the earnings before interest and tax, EBIT, of ABB's competitors was nearly triple that of ABB. In addition the gross margin of ABB's competitors was nearly double and the cost of goods sold, COGS, nearly half.
Pre-Tax Protit EBIT Margin
Source: Factiva, Thomson One Banker
It is clear from this data that ABB's competitors were managing costs better than ABB, and were seeing higher profits and EBIT because of it. The largest components of the cost of goods sold for ABB were raw material costs, transportation, direct labor, and fixed cost allocation of facilities, corporate entities, cell phones, travel, and energy costs. The largest costs commodity cost for ABB were raw materials, which had not been hedged and had severely increased with the cost of steel, aluminum, and copper prices in 2004, 2005.
Recently, ABB had taken actions to reduce these costs. They had consolidated product lines, reducing facility and labor costs, and had drastically reduced the corporate fixed expense by reducing labor and consultant costs accrued by the corporate entities. The global supply chain organization was also working on programs, such as materials hedging, and sourcing from low cost countries, to ultimately reduce raw materials costs. Cell phones, travel and hotels, energy and transportation costs were coordinated centrally through the group supply chain organization and strategies and policies to address these costs were in different stages of development.
2.4 Global Supply Chain Organizational Structure
ABB group supply chain management was managed by John Walker, my project sponsor, who had years of experience in supply management, but had only been with ABB for about a year. It was his role to align the organization to the vision of a dramatic commodity cost reduction and execute. Commodities at
EBITDA Margin 6.8% 26.9% 9.7% 11.6% 7.3% 13.2% 17.8%
Gross Marg in 30.0% 65.2% 57.6% 56.0% 66.0% 32.2% 38.9%
Cost of Goods Sold
as % of Revenue 70.0% 34.8% 39.2% 44.0% 34.0% 67.8% 61.1%
... 9 . ... ... - --- r ... ... ... . ... ... ... .... . ... t -- -- --- - -- --- - - - t ... * ... ... ... ... t --- - -
ABB were segmented into two categories, direct and indirect. Direct commodities were items which directly went into ABB products, such as grain oriented and non-grain oriented core steel, steel cabinets, copper, aluminum, components, etc. Indirect commodities comprised such items as electricity,
transportation, cell phones, travel, etc.
The method in which direct and indirect commodities were managed within ABB was fundamentally different. Direct materials contracts were negotiated by group supply chain and, thus, the global group could leverage ABB's economies of scale to gain favorable pricing. Although, it was worth noting that local sites were not forced to use the globally negotiated prices. Indirect materials were mostly managed by the local regions / countries because of regulation or localization. For example electricity was regulated and the country markets which were all highly structured, different, and not open to free trade. Electrical energy was negotiated by country managers, who had expertise in the local market, for all ABB
sites within a country. Similarly, hotels, transportation, and cell phones varied from country to country and, thus, local expertise was required for optimal service and price. These commodities were controlled by country or local logistics managers, although global contracts were possible with global suppliers. However, group supply management was responsible for global cost reduction in both direct and indirect commodities. To achieve this goal, commodity teams were formed with local, country, and global representation. Commodity team leadership was distributed between the global and local representation on the teams. The team leader was responsible for leading commodity team meetings and gaining buy-in from the local representatives on team and individual goals. The leader would then report progress to the head of group supply chain management, John Walker, who would report this information directly to the CFO and CEO. Historically there was no official accountability for missing cost reduction targets. To summarize, group supply chain management was in a support role to the local units to ensure that logistics and purchasing costs were controlled across the global network of ABB facilities. In addition they were to assist the local sites by leveraging ABB's economies of scale and scope with suppliers for direct and indirect commodities. Although group supply chain management had the ability to sign global contracts and negotiate global deals, local BUs had the final decision to either use the global contracts or go out and find local contracts, which better met the needs of local sites. In addition, commodity teams had been set up to manage individual commodities, but accountability to global goals had historically limited success.
In addition to the commodity teams, the global supply chain group was developing IT systems that would allow for spend visibility by division. Historically, there has been very poor spend visibility because of the sheer number of ERP systems used across the company. Currently, there still exists nearly 200 different systems which could not easily be connected to collect summarized data. Recent advancements in the supply chain IT at ABB allow for full transparency and visibility into the income statements by local business unit. This visibility has two effects: first, it allows for an analytic, apples to apples comparison at a local factory level, and second it is a signal to the factory purchasing people that group level supply chain management not only cares, but monitors closely their local spends.
2.4.1 Direct Commodity Team Structure
Group Supply Chain Management
Direct Commodity Manger
Cabinets and Cable and PCBA and Steel - Non Steel
-Components Wire Products Electronics Electrical Electrical
Shaped and Iron Castings Aluminum Plastics Copper
Welded Metals P Castings I Products
Figure 1. Direct Commodity Team Structure
2.4.2 Indirect Commodity Team Structure
Group Supply Chain Management
Indirect Commodity Manger
Travel and Transportation Electrical Mobile Commodities
Hotels Energy Telecom (other)
3 European Business Environment for Ground Transportation
This chapter is designed to give the reader and overview of the ABB transformer division as well as the structure of ABB's layout across the European landscape. The European ground transportation market and major players will be summarized and ABB's developing strategy toward managing ground transportation will be discussed. The objective of this chapter is to provide the reader with an understanding of the current logistical needs and the business environment in which ABB managed ground transportation.
3.1 ABB Factory, Supplier and Customer Profile
ABB was the quintessential multi-national company with large manufacturing facilities and suppliers in most every European country. Initially the thesis author reviewed about 50 different European factories for applicability to the transportation optimization study, but limited the scope of this project to the transformer, PP-TR, division. Initially, this section will review the various types of supplies and products which were shipped within this division. Then the profile and logistics involved in dealing with ABB suppliers will be discussed as well as the inter-factory shipping. The customer profile and the logistical difficulties of managing a highly variable customer base will be discussed. Finally, the major
transportation carriers will be reviewed as well as the two different logistics models within the factories, and their implications on the optimization study.
3.1.1 ABB Transformers
Generally, a transformer was an electrical device that transfers energy from one circuit to another purely by magnetic coupling. No relative motion of the parts of the transformer was required for the transfer of energy. Transformers were most often used to convert between high and low voltages to change the impedance and to provide electrical isolation between circuits. (www.wikipedia.com)
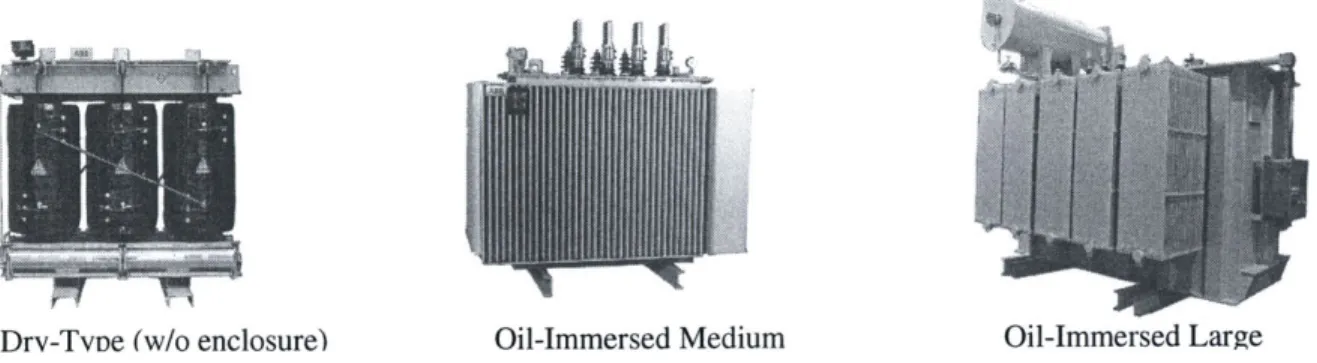
ABB builds three types of transformers, as shown below, that can be separated into two categories, Power Transformers, and Distribution Transformers. Power transformers, shown below as the oil-immersed large transformer, tended to be extremely bulky, weighing in excess of 60 tons. Each power transformer was specialized both in its internal specifications and external shape and size. Distribution transformers, both dry and oil-immersed, tended to be small to medium sized transformers. There was a high degree of specialization in design for both categories of transformers, and a low level of automation associated with the manufacturing and productions of each.
I f F
Drv-Tvne (w/o enclosure) Oil-Immersed Medium Oil-Immersed Large Figure 3. Transformer types: Dry-Type and Oil Immersed Distribution Transformers, and Oil
Immersed Power Transformers
Each product was constructed at multiple manufacturing facilities across Europe and shipped across Europe and the globe. Because of the high degree of customization, the European factories were mainly build-to-order and because of the sheer size of the products, many factories had to use creative solutions, such as railroads into the factory and direct to ports to transport the material.
What was important about transformers was that technology was no longer driving the business, and had not been for nearly 20 years. The products could be thought of as a specialized commodity product. Consequently, ABB competed on product flexibility and customizability, and overall service. This strategy added to the cost of manufacturing, and complicated logistics, but allowed ABB to maintain its market share.
3.2 Factory Profile and Logistics
ABB factories from the six different business areas are scattered across Europe. Critical to the success of the project was choosing a representative set of factories that could implement a solution on a small scale and serve as a role model for other factories and other divisions. Initially, it was necessary to investigate 20 factories from 4 different divisions to determine the possibility of performing a study across divisional silos with the results applicable for a broader range of factories. However, due to limiting scope creep, it was decided that a single division with a small range of products would be an acceptable study.
The transformer division was chosen after speaking with the business area supply chain managers from each division. The transformer division would be a challenge because of the product dimensions, and customer profiles, but if a solution was found in this division, it would have a large business impact. In addition the transformer division had two interesting characteristics: a distributed pan-European layout where each factory responsible for manufacturing one type of transformer or component, and large amounts of inter-factory shipments.
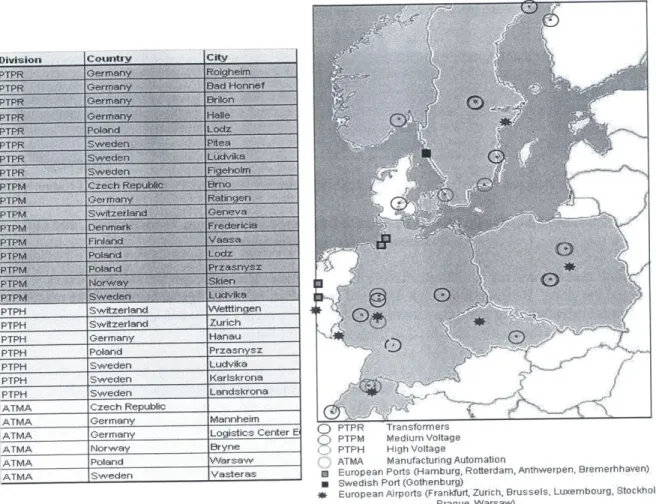
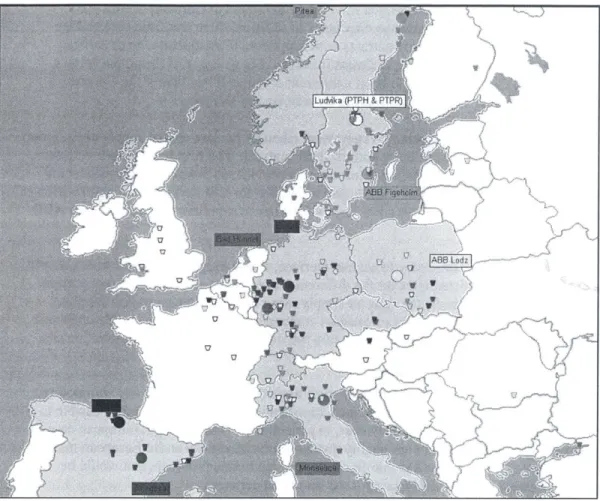
Below was the original selection of factories that was considered. This figure was included to give the reader further insight into the distribution of ABB factories across Europe. The four divisions shown are PP-TR, transformers, PP-MV, or medium voltage products, PP-HV, high voltage products, and RO, manufacturing automation and robotics.
ATMA Germany Logistics Center E, PPR Transformers
ATM PTPM Medium Voltage
ANorway Bryne PTPH High Voltage
ATMA Poland VVarsaw ATMA Manufacturing Automation
ATMA Sweden Vasteras Um European Ports (Hamburg, Rotterdam, Anthwerpen, Bremerhhaven) * Swedish Port (Gothenburg)
* European Airports (Frankfurt, Zurich, Brussels, Luxembourg, Stockholm, Prague, Warsaw)
Figure 4. Investigated ABB European factories with PP-TR, PP-MV, PP-HV and RO for optimization study
3.2.1 European Transformer Manufacturing Facilities
Within the transformer division, 12 plants were chosen for study. These locations had a variety of products, 5 distribution transformer plants, 4 insulation and components plants, and 3 power transformer plants, as well as a variety of production schemes. The yearly production of the facilities ranged from 69 power transformers per annum in a western European facility to 15,000 small oil filled distribution
transformers per annum at a eastern European site.
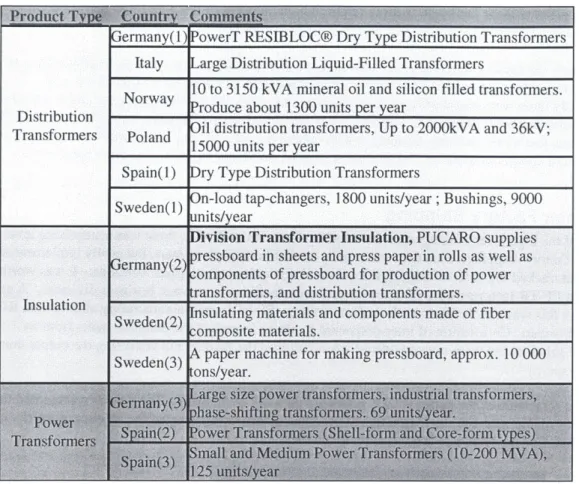
The location and product type, product description as well as outputs for selected locations are listed in the table below:
ermany(l)lPowerT RESIBLOC@ Dry Type Distribution Transformers
Distribution Transformers
Italy Large Distribution Liquid-Filled Transformers
10 to 3150 kVA mineral oil and silicon filled transformers. Norway Produce about 1300 units per year
Poland Oil distribution transformers, Up to 2000kVA and 36kV; 15000 units per year
Spain(l) Dry Type Distribution Transformers
Sweden(l) on-load tap-changers, 1800 units/year ; Bushings, 9000initN/vt-4r
Figure 5. Transformer factory types and outputs
The Germany (1) facility, the Italy facility, the Spain (1) facility and the Poland facility were high volume distribution transformer facilities. The product size ranged from large distribution transformer, with unique design characteristics, in Italy, to small distribution transformers that were more standardized products, as in Poland. The larger distribution transformers were manufactured with little automation, and often had groups devoted to preparing and managing the special shipping requirements. To the contrary, the small distribution transformers were produced in a more automated facility, although they too required a considerable amount of manual labor.
Distribution transformer facilities required supplies of raw materials at an irregular basis, depending on particular orders at the facilities. Because of varying product specifications, it was difficult to produce to stock, and thus make-to-order manufacturing schemes had been created. The types of raw materials supplied to these factories were: copper wire, grain oriented and non-grain oriented steel, components such as bushings, steel cabinets, transformer oil and insulation. Outputs of these factories were distribution transformers, which on the whole, could be shipped using standard or minimally modified trailers.
The Germany (3) facility, and the Sweden (1) and Sweden (2) facilities were three insulation producers that supplied raw material for power and distribution facilities. Supply for these factories comprised of raw pulp, plastics, and other chemicals, and outputs were wet and dry paper insulation, as well as fiber composite insulation material. These raw materials were often shipped to a "kitting" facility, in Poland, where they were arranged into kits for all European transformer plants, based upon orders and designs
already received at these facilities. Kitting required high amounts of labor and was performed in Poland, where the labor rates were considerably less than ABB's other European locations.
The Germany (2) facility, and the Spain (2) and Spain (3) facilities produced large, highly unique power transformers. Shipping for these products could exceed 20% of the entire invoiced cost, and,
consequently there were teams of logistics specialists that managed the transportation and installation of every power transformer produced. Supplies for power transformers facilities were similar to distribution transformers, just more massive. Outputs, which ranged between 69 and 120 power transformers per
year, required special methods of transportation, and the outbound logistics was often outsourced.
3.2.2 Inter Factory Shipping
Because of the high level of integration between the factories in PP-TR, there was a surprising level of factory to factory shipping. This data was readily available through e-smart, the newly implemented system that tracked the value of supply-side material deliveries and supplier locations. It was worth noting that PP-TR factories were often co-located with facilities from other business divisions. A good example of this was a co-location with medium voltage, PP-MV, and manufacturing automation, RO, in Ludvika, Sweden. Co-location of inter-divisional facilities increased the potential gains from an optimized solution, but were not considered when building the models and analyzing the output due to project scope
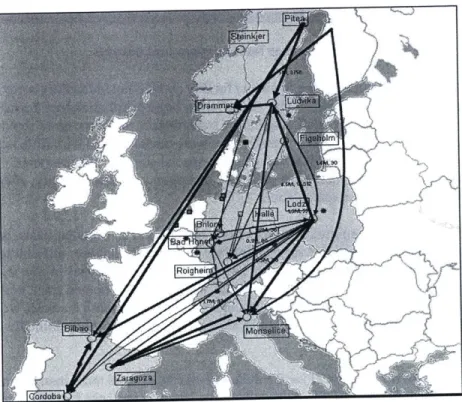
Below is a schematic of the entire PP-TR European network of facilities. The arrows represented the direction of traffic, whereas the magnitude of the line and arrow represented the amount of traffic, in dollar value, flowing from one ABB facility to another.
Figure 6. PP-TR inter-factory shipments with the arrows representing direction of traffic and the
magnitude of the line and arrow representing the dollar value of traffic
3.2.3 Supplier Profile and Logistical Challenges
Suppliers varied in characteristics by the nature of the product produced at the ABB facility. The suppliers of the direct commodities such as grain oriented and non-grain oriented steel were often shared between transformer factories because of globally negotiated reduced rates. However, common to most facilities was the idea of localized supply, or having the majority of suppliers within 200 kilometers from the factory, and this will become evident when reviewing the supplier map for the European factories attached below:
V 7 POW
Figure 7. Map of supplier locations for ABB European transformer facilities.
This map was color coded by facility. The supplier data for this graph was gathered with much effort by visiting each ABB facility and speaking directly with the site logistics managers. Although supplier locations and dollar values were listed in e-smart, the delivery logistics information was known only by the local sites and the data was not tracked electronically. So, although it may not be very clear in black and white prints, this figure showed that the majority of major suppliers for the facilities were located close to the factories, with the exception of Pitea which was in the very far north of Sweden. This was an important observation for suggesting and validating optimization schemes later in the project.
3.3 Transportation Carriers and logistical models
Although ABB was looking to determine a method to optimize its ground transportation across Europe, they were not looking to enter the trucking business. Thus, the transportation carriers were an integral
factor in this study, and will be key suppliers and stakeholders in the implementation of an optimized transportation scheme.
3.3.1 Major European Transportation Carriers
As ABB grew in the 1990's each autonomous transformer factory was charged with the task of managing its own transportation to the success metrics that it saw desirable. Thus, across ABB European facilities there were over 100 different carriers used by the factories, making costs difficult to control and overall quality nearly impossible to tabulate. Materials that traveled from Poland to Germany would use a different carrier than product traveling the reverse direction. In addition, there was little cooperation between factories, and little transparency into contracts with suppliers. Consequently, large carriers would have different contracts with each of the different factories. For example, if the polish factory hired a truck from Poland to Germany, it would be at a different contracted rate than if the German factory hired the same truck going along the same route from Poland to Germany.
Management at a global level was needed and two steps were taken by the new global supply chain group that were important factors for the transportation optimization analysis. The first was to work with the local sites across Europe to reduce the number of transportation provider to 3-4 per factory. Reducing suppliers allowed each of the local sites to leverage higher quantities for cost savings and conformation to quality metrics. At a global level, allowed for a few key pan-European suppliers that worked with ABB across regions.
The second step was to create an on-line, easy to access interface, called freight calculator, which clearly and quickly showed all of the contracted rates for the different carriers from all of the different regions. Instead of searching through spreadsheets for rates, or simply using the same transportation suppliers regardless of destination, now the local logistics managers compared the rates provided by the different carriers from the different regions. If it was cheaper to hire the transportation from the destination site, they would do so.
Contract transparency and supplier reduction were key steps in global cost savings for any commodity. By reducing the number of transportation suppliers, and consolidating volumes, it was now possible to reap the benefits of an optimization solution. However, in general there was no single European carrier that could provide both cost-effective and high quality transportation across the entire European market. Regardless, it was evident that there were key pan-European transportation providers that would be stakeholders in any optimized solution developed for the European network.
The foremost suppliers for transportation across Europe were as follows: * Supplier A, a key supplier for Sweden, Norway and Finland,
* Supplier B - a key supplier active in western Europe from Sweden to Spain * Supplier C - a key supplier very effective in Eastern Europe
The majority of the negotiations and partnerships were with Supplier C and Supplier B and the potential cross-docking warehouses analyzed in the hub solution optimization study were suggested by Supplier B. It was worth noting that UPS was very eager to get into the European market, but did not yet have the infrastructure to talk seriously with ABB on this project. However, if UPS could match the quality, cost, and service that they provide in other regions of the world, they would be ideal for future projects. In addition by adding UPS as a potential global transportation provider, it would give ABB considerable negotiating leverage with current suppliers to reduce cost and increase quality.
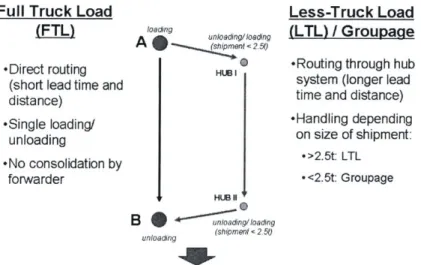
For this project two basic trucking services were examined: Full Truck Load, FTL, and Less than Truck Load, LFL. There were intrinsic cost differences between the two models based on supplier and historical data. These differences will be discussed to greater detail in the cost model section.
3.3.2 Internal Logistical Models
There were many value added services that the transportation suppliers provided to extend their product beyond shipping material from point A to point B. Specifically, in a handful of ABB locations
transportation providers had implants, which coordinated the logistics for shipping finished goods to customers. These implants then followed up to make sure the good arrived as scheduled, handling issues that result from mishandled or late deliveries.
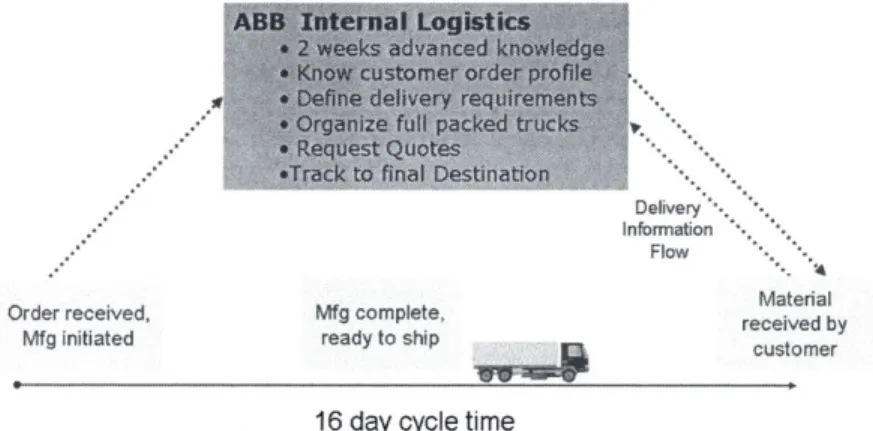
Schematics of a standard logistics model and an external implant logistics model for a particular ABB factory in Eastern Europe are as follows:
Order received, Mfg initiated Mfg complete, ready to ship Delivery Information Flow Material received by customer
16 day cycle time
Figure 8. Schematic of logistics model where ABB coordinated, tracked and followed-up on shipping issues.
ABB responsibility Implant responsibility
4. Mfg complete, ready to ship Delivery Information Flow Material received by customer
16 day cycle time
Figure 9. Schematic of external logistics model where a supplier implant coordinates, tracks, and follows up on shipping issues
In both models the cycle time for shipping was 16 days, but in the implant model, a hand-off of responsibility to the transportation provider occurred at the ABB shipping dock. The implant provider
Order received
then packed the trucks to take advantage of economies of scale and tracked the delivery and ensured timeliness and high quality. Although the price of the implant was rolled back into the price of transportation, having this service allowed ABB to cut back on its logistics staff to focus on its core competencies. The downside of an implant model was that by handing over the responsibility for systems development and logistics management, there is a potential for the ABB location to lose its talented people and experience in managing its own logistics. In addition, the implant logistics provider gained considerable more bargaining leverage to increase prices in the future.
There is also danger that the implant model may be inflexible and contractually tied to particular
manufacturing locations. Thus, companies that are planning a considerable shift in their factory layout or supplier base should be wary of entering into binding and inflexible agreements with logistics providers. In this respect a logistical solution should reflect the overall strategy of the company. ABB had a strategy to move its supplier base and manufacturing to match with product demand, which was in the US and developing nations. It followed that ABB should choose a logistics strategy which was more flexible; they should either choose flexible contracts with logistics implants or maintain internal capabilities to handle logistics and transportation at the local sites.
4 Optimization Solution Development
Summarize up to this point in the thesis, it is difficult for engineering led companies to change both strategy and culture to focus on controlling costs. In order to achieve this, ABB segmented all direct and indirect commodities and set up teams, which were at a global level responsible for setting goals and achieving cost savings on a particular commodity. The formation of virtual teams did not address the cultural issue of complacency but focused the ABB supply chain network to gather data on costs and create metrics.
The optimization study was designed as an example of thinking unconventionally to achieve commodity cost savings and the results would be shared with the local sites. The goal was to provoke out of the box thinking in the supply chain to re-invent the way that ABB managed its cost. In addition to incremental
savings through contract negotiations, the group level supply chain organization wanted to determine if cost savings could be achieved by changing the system.
The focus of this study was only on optimizing transportation, and not on changing product or factory characteristics. This chapter was designed to discuss the various optimization solutions which were studied after the acquisition of supply chain data from the local organizations. In addition to the potential optimization options, this chapter will outline a cost model that was developed after talks with numerous suppliers, which was subsequently used to analyze each of the optimization options.
4.1 Optimization Options
Logistics surveys had been completed by a subset of the European factories that included representation from each of the business areas. Previous survey information was a good starting point as it provided the revenue and expenditure on transportation and logistics for a small subset of sites across the divisions. This information provided a reality check for the optimized solutions being considered, as the data allowed for some rough global assumptions about overall spend and traffic. With this survey knowledge, it became clear that consolidating material for transportation was the key to reducing the transportation spend without changing manufacturing and purchasing procedures.
The network optimization problem was broken down into three subsets for study. The thought was that it may be too complicated and convoluted to only consider a global optimization. However, breaking down the overall problem would allow for further insights into the local regions and the overall system and may uncover pockets of inefficiency that would yield considerable savings. The optimization was thus divided into factory level transportation inefficiencies, regional transportation inefficiencies, and pan-European transportation inefficiencies.
Specifically, the three optimization schemes that were mathematically modeled and tested for economic feasibility were as follows.
* Flow Balancing * Milk Runs / Shuttles
4.1.1 Flow Balancing
Most Factories
Matched Flow
Incoming
Outgoing
Full in / Full out
Figure 10. Schematic of current and future states for the flow balancing solution Supply was delivered to ABB factories in the morning in full trucks. The trucks unloaded the material
and left the factory with an empty payload. Trucks then arrived at the factory in the afternoon with an empty payload to pick up finished goods. In this system ABB not only paid for two empty legs, but also
paid the overhead associated with the coordination and planning to schedule an additional truck.
The vision was that in an efficient system material supply would be delivered and finished goods removed all in the same visit to the factory. This solution would be beneficial for the transportation providers who would save on costs, and for the factories that would negotiate rate reductions. This solution had been implemented in other industries, such as the auto industry, and had been found to be highly cost effective (John Walker).
Stakeholders for this solution were the local logistics manager, and the transportation provider. There were additional stakeholders internal to the factory, such as planning and scheduling, but it was assumed that if the analysis yielded considerable opportunity, then the local logistics manager would pull the
solution into the factory, using influence and local networks to change the internal factory practices. The data requirements to study the economics of balancing flow were at a factory and local transportation provider level. Consequently, the opportunity for flow balancing at each factory was considered independently of any other. Implementation would be at a factory level, independent of the other factories in the region and the network.
4.1.2 Milk run
/
Shuttle Solutions
Milk Run Proposal
Suppliers
rn-i
I
N
F
Figure 11. Schematic of milk run/shuttle optimized solution
As mentioned earlier, ABB factories tended to source a considerable amount of material locally. Because of the size and variation of shipments from each supplier, each supplier hired trucks and delivered the material at LTL, less than truck load, rates. ABB was then paying for this inefficiency either by directly paying for the transportation, or by having the transportation rolled into the cost of the supplied goods. Few single suppliers had enough supply volume to fill an entire truck. However, localized groups of suppliers had supply enough material to yield positive economies of scale.
The vision for the milk run solution, named so because it was reminiscent of the milk man days of old who would deliver milk to all the customers as opposed to having each customer travel to the market to buy milk, was that ABB factories would hire a full truck that would travel to all local suppliers on a regular basis to pick up supply. ABB would get much more favorable rates than smaller suppliers because of ABB's overall global shipping quantities. In addition, the ability of ABB to manage the consolidation of supply into a single truck had potential to save a considerable amount of money. The design of a shuttle was similar to that of a milk run. A single truck would travel to each ABB facility to pick up finished product and would transport the finished product to the nearest airport / seaport.
Stakeholders for this solution were the local logistics manager, the transportation providers, and
additionally the suppliers. The data requirements to study the economics of this option were at localized level. Consequently, groups of suppliers and groups of factories needed to all be aligned in order to sustain positive savings. Although each party would gain financially, factories and suppliers would have to cooperate to consolidate, which proved to be challenging.
4.1.3 Hub
/
Cross-Docking Solutions
Current State
Hub / Cross Dockina ProDosalSuppliers Factories
Suppliers
UHub
Hub
Factories
Figure 12. Schematic of a hub / cross docking optimization solution
IN
Factory
Current StateMany suppliers and customers for ABB European factories were not localized around the factories. Often, the material shipped long distances from these non-localized suppliers and to non-localized
customers was not enough to fill a truck to get the economies of scale. This material was shipped through transportation providers who would perform a value-added service and consolidate the material for shipping. By performing this value-added service for ABB's network, the transportation providers were demanding higher costs - this concept will be elaborated on in the cost model section later in this chapter. The vision of this solution would be that ABB had multiple hubs across Europe to facilitate cross docking material and to reduce costs by consolidating both supply and finished product for pan-European
shipments. Initial data showed that the volume of material that ABB ships between Sweden, Spain, Italy and Poland was large enough to allow for consolidation and economies of scale. ABB would neither own the hubs nor the trucks and so it was critical to find a transportation supplier or group of suppliers that had the capability to offer high quality shipping to all of Europe.
Stakeholders for this solution were the logistics managers from PP-TR facilities across Europe, one and possibly more transportation providers, and many suppliers scattered across the European landscape. Data requirements were considerable and from many different sources that included factories and transportation providers in different European regions. Before the solution could be effectively analyzed all of the data would have to be collected and in order for the solution to be economically viable all of the stakeholders would have to participate.
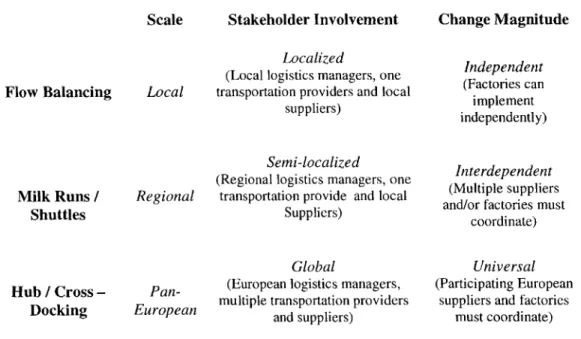
To summarize the three optimization solutions:
Stakeholder Involvement
Localized
(Local logistics managers, one
Local transportation providers and local suppliers)
Semi-localized
(Regional logistics managers, one
Regional transportation provide and local Suppliers)
Global
Pan- (European logistics managers,
multiple transportation providers
European and suppliers)
Change Magnitude Independent (Factories can implement independently) Interdependent (Multiple suppliers and/or factories must
coordinate)
Universal
(Participating European suppliers and factories
must coordinate)
Figure 13. Scale and change magnitude for the different optimization options.
4.2
Cost Model Development
In order to compare the various optimization schemes it was necessary to understand and model the underlying costs involved in running a material forwarding business. Variable factors that affect the costs of any particular shipment were determined to be load factor and distance, as well as traffic on the route
Scale Flow Balancing Milk Runs / Shuttles Hub / Cross -Docking