Drop-in Replacement Biofuels: Meeting the Challenge
byAlok Bhargava
M.S. Computer Science, University of Massachusetts Amherst, 1995 B.S. Computer Science and Engineering, Jadavpur University, 1992 SUBMITTED TO THE MIT SLOAN SCHOOL OF MANAGEMENT IN PARTIAL
FULFILLMENT OF THE REQUIREMENTS FOR THE DEGREE OF ARCHIVES MASTERS OF SCIENCE IN MANAGEMENT MASSACHUSETTS INSTITUTE
AT THE OF TECHNOLOGY
MASSACHUSETTS INSTITUTE OF TECHNOLOGY
JUN 1 52011
JUNE 2011
© 2011 Alok Bhargava. All Rights Reserved. LIBRARIES The author hereby grants to MIT permission to reproduce and to distribute publicly
paper and electronic copies of this thesis document in whole or in part in any medium now known or hereafter created.
Signature of Author:
Alok Bhargava
MIT Sloan School of Management May 6, 2011 Certified by:/
er 6Robon rofessor of A nomics esis Supervisor Accepted by: Stephen Sacca Program Director, Sloan Fellows Program MIT Sloan School of ManagementDrop-in Replacement Biofuels: Meeting the Challenge
byAlok Bhargava
Submitted to the MIT Sloan School of Management on May 6, 2011 in partial fulfillment of the
requirements for the degree of Masters of Science in Management
Abstract
This thesis presents a discussion on the challenges that must be met to fulfill the U.S. Navy's strategic imperatives for its energy vision. It provides an introduction to drop-in replacement biofuels, the options amongst the technologies and feedstock available to produce them, their current economic performance and the evolution of their commercialization. In pursuing the latter a detailed examination of the funding path towards commercialization was undertaken.
The study found that the U.S. Navy's requirements for drop-in replacement biofuels for aviation are best met by hydroprocessed renewable jet fuel (HRJ). Since
feedstock from sources that do not interfere with food markets are preferred, algal oil was identified as extremely promising. The study also found that hydroprocessed fuels are also not yet independently commercially viable. The study identified a critical funding gap between the time startup capital is depleted and prior to reaching the ability to raise capital in the commercial and public markets. Finally a literature survey is performed to address proposals for avoiding this
"dcommercialization valley of death", analysis of the proposals and recommendations made for drop-in replacement biofuels.
Thesis Supervised by Professor Roberto Rigobon
Society of Sloan Fellows Professor of Management Professor of Applied Economics
Acknowledgments
I would like to express my appreciation for a number of individuals whose guidance, feedback, advice and support were instrumental in writing this thesis.
I would like to thank Damien Blazy who whole-heartedly embraced the idea, encouraged its pursuit and provided critical insights.
I would like to thank my advisor, Professor Roberto Rigobon, for his guidance, perspective and advice in developing the thesis. I greatly appreciate his encouragement and support.
I would like to thank Matt Pearlson who shared early results from his techno-economic study of alternative jet fuels. I would also like to thank two teams: the Leadership Lab team with Molly Summersby Bodell, Michelle Lauzon, Jesal Sangani and Ricardo Teixeira who shared their thoughts, advice and findings on the
renewable jet fuel industry's development path; and my Sustainability Lab
teammates, Sarah Meyers, Michael Parran and Jian Helen Yang who helped shape my thinking about the sustainability of biofuels.
I would also like to thank the many people who kindly made available their time for interviews, discussions and generously shared their thoughts. In particular I would like to thank Colin South, Jim Matheson, Bill Harrison, Bruce Jamerson, Keith
I am grateful to Professor Wanda Orlikowski whose help made the thesis possible.
I would also like to thank my Sloan Fellows friends whose rock-solid faith in me fueled my work in understanding a field entirely new to me: Adeel, Ashish, Aurora, Cisco, Claudio, Jesal, Michelle, Nabil, Paul, Sarah and Tonia.
Finally I would like to thank my wife and daughter who soldiered on during difficult times as I pursued my year at Sloan and this thesis. Ariana, you are the light of my life and the motivation for my work everyday.
Table of Contents
ABSTRACT ... 3
ACKNOW LEDGM ENTS ... 4
LIST OF FIGURES...9
LIST OF TABLES... 11
TERM S AND ABBREVIATIO NS... 12
1 INTRO DUCTION ... 13
1.1 2020: SOMEWHERE IN THE PACIFIC OFF THE US COAST ... 13
1.2 M EETING THE CHALLENGE... 15
1.2.1 The Scale...15
1.2.2 The Vision...17
1.2.3 The Challenge Ahead...19
2 ADVANCED BIOFUELS INDUSTRY... 21
2.1 HISTORY ... 21
2.1.1 Alcohols...23
2.1.1.1 Sugarcane and Corn Ethanol... 24
2.1.1.2 Cellulosic Ethanol ... 27
2.1.2 Long-chain Hydrocarbons... 27
2.2 TECHNOLOGY PATHWAYS ... ... 27
2.3 FEEDSTOCK AND PRODUCTION PATHS ... 29
2.4 CHARACTERIZING COMMERCIAL INITIATIVES... 31
2.5 THE SHIFT To DROP-IN REPLACEMENT B0FUELS... . . 31
2.6 RENEWABLE JET FUEL... 34
2.6.1 Technical Requirem ents... .... . . 2.6.2 Pathways ... ... 35
2.6.2.1 Fischer-Tropsch Processing...35
2.6.2.2 Hydroprocessing... 2.6.3 Technologies... ... 38
2.6.3.1 Fischer-Tropsch...38
2.6.3.2 Hydro processing...39
2.6.4 Sustainability...47
3 THE ECONOMICS OF HYDROPROCESSED BIOFUELS... 49
3.1 COST STRUCTURE ... 49
3.1.1 Hydroprocessing Plant...50
3.1.2 Feedstock Production ... 51
3.1.3 Finished Fuel Cost Breakdown... 53
3.2 M ARKET STRUCTURE ... 54
3.2.1 Petroleum Value Chain...54
3.2.2 Hydroprocessed Biofuels Value Chain... 57
3.3 COMMERCIAL ECONOMICS... ... 57
3.3.1 Hydroprocessing Economics ... 57
3.3.2 Overall Economics...58
3.3.2.1 Breakeven Analysis ... 58
3.3.2.2 Feedstock Cost and Availability... 59
3.4 COMPETITIVENESS AND MARKET DYNAMICS ... 59
4 DEVELOPING AN INDUSTRY...62
4.1 AN ECONOMIC SHiFT AND AN EMERGING TECHNOLOGY... 62
4.2 FINANCING TECHNOLOGY COMMERCIALIZATION... 64
4.2.1 From Lab to Market ... 65
4.2.1.1 Venture Capital...66
4.2.2 Understanding the Barrier to Financing: Risk ... 67
4.2.2.1 Characterizing Risk...68
4.2.2.2 Technology Risk and Sources of Funding ... 70
4.3 COMMERCIALIZING BIOFUELS ... 71
4.3.1 The Vector of Biofuels Technology Commercialization...71
4.3.2 The Reach of Startup Financing...-.72
4.3.3 Slipping Into the "Valley of Death"?... 74
4.4 CHASING GROWTH: A PATCHWORK APPROACH So FAR ... . 76
4.4.1.1 Loan Guarantee Programs ... 77
4.4.1.2 Renewable Fuel Standards ... 80
4.4.1.3 Industry Push for Change ... 81
4.4.2 Joint Ventures and Partnerships... 82
4.4.2.1 Beneftsfor a supplier...82
4.4.2.2 Strategic benefits...82
4.4.3 Equity M arkets...83
4.4.4 Revenue from Sales...83
5 PROPOSED APPROACHES TO FINANCING GROWTH ... 85
5.1 Tw o UNDERLYING FUNDAMENTALS... 85
5.2 EXAMINING THE PROPOSALS... 86
5.2.1 Reducing Debt Requirements ... 86
5.2.2 Reducing Risk to Private Capital ... 87
5.2.3 Project Execution Support a. t... ... 89
5.2.4 Direct Funding ... 90
5.2.5 Enhancing Econom ic Com petitiveness ... 90
5.2.5.1 M andated M arket Proposals...90
5.2.52 Carbon Pricing ... 92
5.2.6 Author's Proposals...93
5.2.6.1 Breaking the Value Chain... 93
52.6.2 Structured Finance... ... 94
5.3 RECOM M E NDATIONS... ... ... 97
5.4 THE CLEAN ENERGY DEPLOYMENT ADMINISTRATION... 99
6 CLOSING TH OUGHTS... ... . ... 101
List of Figures
FIGURE 1-1: GLOBAL OIL CONSUMPTION... ... ... 16
FIGURE 1-2: GLOBAL OIL SUPPLY ... ... ... ... 16
FIGURE 1-3: US LIQUID FUELS CONSUMPTION BY TYPE, 2010 ... 17
FIGURE 1-4: US LIQUID FUELS CONSUMPTION BY SECTOR, 2010 ... 17
FIGURE 1-5: US NAvY PETROLEUM CONSUMPTION...--..-... -.... ... 18
FIGURE 1-6: US NAVY PETROLEUM CONSUMPTION BY APPLICATION AND SUPPLY BY SOURCE (SOURCE: CULLOM, SUSTAINABLE ENERGYAND NATIONAL SECURITY) ... 18
FIGURE 2-1: THE MANY PATHWAYS TO PRODUCE LIQUID FUELS FROM BIOMASS ... 28
FIGURE 2-2: BIOFUELS PRODUCTION PATHS ... ... 30
FIGURE 2-3: END-USE DISTRIBUTION FOR A BARREL OF CRUDE OIL...32
FIGURE 2-4: COAL-To-LIQUIDs FISCHER-TROPSCH PROCESSING ... 36
FIGURE 2-5: A SIMPLIFIED HYDROPROCESSING SYSTEM DESIGN ...- ... 37
FIGURE 2-6: THREE TYPES OF CULTIVATION SYSTEMS...3...43
FIGURE 2-7: AN EXAMPLE PROCESS DESIGN FOR ALGAL OIL PRODUCTION AND PROCESSING ...-... 44
FIGURE 2-8: FEEDSTOCK AND CONVERSION ARE KEY AREAS OF COMMERCIAL ALGAL FUEL RESEARCH ...-... 46
FIGURE 3-1: ECONOMIC MODEL FOR HYDROPROCESSED BIOFUELS... .... ...49
FIGURE 3-2: MODEL FOR COST STRUCTURE OF A HYDROPROCESSING PLANT. .... .. 51
FIGURE 3-3: MODEL FOR COST STRUCTURE OF FEEDSTOCK PRODUCTION FROM CROPS AND ALGAE.- 52 FIGURE 3-4: GASOLINE RETAIL PRICE AND REVENUE DISTRIBUTION IN US, 2000 To JAN 2011....--.... -55
FIGURE 4-1: THE EVOLUTION OF A TECHNOLOGY FROM LAB/IDEA TO COMMERCIALIZATION...65
FIGURE 4-2: UNDERSTANDING THE APPETITE FOR TECHNOLOGY RISK...70
FIGURE 4-3: THE FINANCING OF BIOFUELS TECHNOLOGICAL EVOLUTION ... 71
FIGURE 4-4: PRIVATE CAPITAL RAISED BY SOME ADVANCED BIOFUELS STARTUP ... 73
FIGURE 4-5: PATCHWORK APPROACHES ADOPTED TO DATE FOR OVERCOMING FUNDING GAP...76
FIGURE 5-1: THE CLEAN ENERGY ACCELERATOR CORP...87
List of Tables
TABLE 2-1: HISTORICAL EVOLUTION OF ETHANOL BLENDS IN BRAZIL ... 25
TABLE 2-2: COMPARISON OF FARMING COSTS OF VARIOUS OIL SEEDS ... 41
TABLE 3-1: COST BREAKDOWN ESTIMATES FOR PRODUCING HRJ AT PLANT ... 53
TABLE 3-2: SNAPSHOT FINANCIAL DATA OF OIL AND GAS PRODUCERS ... 56
TABLE 3-3: COST BREAKDOWN ESTIMATES FOR PRODUCING HRJ INCLUDING FINANCING, TAX, DEPRECIATION AND IRR ... 58
TABLE 3-4: THE COMPETITIVENESS OF ADVANCED BIOFUELS IN 2011... 60
TABLE 4-1: EXAMPLE RISK FACTORS FOR TWO SAMPLE PROJECTS ... 68
TABLE 5-1: VARIOUS PROPOSALS FOR FUNDING THE COMMERCIALIZATION VALLEY OF DEATH FOR CLEAN ENERGY TECHNOLOGIES...97
Terms and Abbreviations
AFFCO ASTM CEDA CNO DoD DoE EIA En-route value EPA F-T FAA FAME FDA GHG GRAS HRJ IATA ICE PARTNER USDAVC
Association Of American Feed Control Officials, Inc
ASTM International, formerly known as the American Society for Testing
and Materials
Clean Energy Deployment Administration Chief of Naval Operations
United States Department of Defense United States Department of Energy
United States Energy Information Administration
Realizable economic value generated by a technology commercialization firm en-route to its ultimate objectives. See
§
5.2.5.1 for details.United States Environmental Protection Agency Fischer-Tropsch process
Federal Aviation Administration Fatty Acid Methyl Esters
Food and Drug Administration Green House Gases
Generally Regarded As Safe Hydroprocessed Renewable Jet
International Air Transport Association Internal Combustion Engine
Partnership for AiR Transportation Noise & Emissions Reduction (PARTNER), an FAA Center for Excellence sponsored by the FAA, NASA, Transport Canada, DoD and EPA with operational headquarters at MIT United State Department of Agriculture
1 Introduction
1.1 2020: somewhere in the Pacific off the US coast
As the Chief of Naval Operations (CNO) stood on the bow of the carrier USS Greenfuels, she looked out across to a fleet of 20 battle force ships and the 150 fixed-wing battle aircraft and helicopters participating in a war exercise. Each aircraft, vessel and shore-based transport participating in the exercise was runningon "green fuels", the moniker used for the biofuels that had replaced traditional petroleum-based fuels. The CNO reflected with pride on how far the Navy had come; only a month ago the Navy had crossed the 50% mark in converting its energy consumption afloat to being sourced from green fuels. Green fuels fulfilled many imperatives of the Navy's1 strategic vision on energy, chiefly, diversification of supply risk by moving away from reliance on petro-states, improved energy security from national and allied production, enhanced fuel budget management, and playing a leading role in environmental stewardship. The Navy had accomplished the switch without turning over its installed base of infrastructure, using the same engines, appliances etc. that previously ran on petroleum-derived fuels. And although burning the new "drop-in replacement" fuels released the same amount of
greenhouse gas (GHG) emission into the atmosphere, the key point was that they came from the natural carbon cycle, i.e. green fuels simply recycled carbon and other compounds already in the natural cycle. Burning fossil fuels, instead, released new entrants into the ecosystem from their millennia of captivity.
The CNO's thoughts drifted back to a decade ago when the Navy had established a strategy and the audacious accompanying imperatives to push the boundaries of the possible. The strategy was centered on three clear goals to be met without
compromising its operational capability objectives: energy security, energy efficiency and environmental stewardship. Furthermore it could not afford a turnover in its existing multi-billion dollars infrastructure - for its many ships and aircraft it needed alternative liquid fuels that could be used as direct replacements for oil-based fuels. In 2010 there did not exist a single source of competitive commercial-scale drop-in alternative liquid fuel. Although many production
technologies from algae to salicornia were promising they were in very early stages of the path to cost-effective commercial scale. She marveled at the challenge
-humanity had never before crafted, engineered or produced a high energy-density fuel at industrial scale; it had simply extracted (coal, natural gas and oil) or
converted (solar, hydro, wind, nuclear) energy from one source to another. Sure, there was some processing of materials involved for coal and oil but the actual fuel was simply organic matter converted over millennia by natural processes. In 2010 some people were looking to farm oil plants like camelina, jatropha and salicornia; others were trying to engineer organisms like bacteria and algae to produce oils; each had the potential to be converted into liquid fuels. But doing it at industrial scale at costs competitive with petroleum must have been difficult. As she observed the exercises from her post at the ship's bow, she wondered about the human and financial capital that had gone into creating a competitive substitute for fossil fuels, which had enjoyed more than a century's worth of investment and development.
1.2 Meeting The Challenge
1.2.1 The Scale
Global oil consumption in 2010 was 84,400 thousand barrels per day of oil (see Figure 1-1). The US share of global consumption was 22% or about 18,810 thousand barrels per day. China and Japan were the next two largest consumers at 9.9% and
5.3% respectively; US consumption was more than twice that of the second largest consumer China. In terms of supply, the US ranks as the third largest producer (see
Figure 1-2) of oil at 11.17% of global supply, ranking just behind Russia and Saudi Arabia at 11.73% each, and ahead of China at 4.95%. With a marginal difference at
the top, the US is one of the largest producers of oil.
In 2010 the U.S. consumed 18.98 million barrels per day of liquid fuels, of which about 7% (see Figure 1-3) or 1.33 million barrels per day was in the form of jet fuel. And 71% (see Figure 1-4) or 13.5 million barrels per day of all liquid fuels were consumed for transportation. The U.S. is heavily dependent on liquid fuels to meet its transportation needs.
Based on 2008 figures the U.S. government consumes 2% of total U.S. consumption, of which the DoD consumes 93% and the Navy uses a quarter of that. 41% of the
Navy's consumption is for aviation purposes (see Figure 1-5) i.e. the Navy uses approximately 36,200 barrels per day or 1.52 million gallons per day of liquid fuels for aviation purposes. In the absence of officially published figures, if we assume that 50% of the requirement is for jet fuel, then the Navy needs approximately 18,100 barrels per day or 760,200 gallons per day of jet fuel.
20000 country 1.000 Region 16000 4 14000 10000 0000
Figure 1-1: Global Oil Consumption
(Data Source: U.S Energy Information Administration, International Energy Outlook, 2010)2
(Graphic: Author) escow" IS u em SM
//v
Figure 1-2: Global Oil Supply
(Data Source: U.& Energy Information Administration, International Energy Outlook, 2010)3 (Graphic: Author)
2 U.S. Energy Information Administration, International Energy Outlook 2010.
3 Ibid.
Figure 1-3: US Liquid Fuels Consumption by Type, 2010
(Data Source: U.S. Energy Information Administration, International Energy Outlook, 2010)4 (Graphic: Author)
Figure 1-4: US Liquid Fuels Consumption by Sector, 2010
(Data Source: U.S. Energy Information Administration, International Energy Outlook, 2010)5 (Graphic: Author)
1.2.2 The Vision
The US Navy has taken a leadership position in setting a bold vision for moving towards more a secure supply and a cleaner footprint of its energy needs. Its energy
Uquefied Petroleum Gases wi. 11% Residential and Commercial 5% Electric Power 12% 4 Ibid. 5 Ibid.
vision demonstrates its sophisticated understanding of the strategic implications of improving the diversity of energy supply beyond traditional petroleum and other
Navy Petroleum Consumption in Perspective
U.S. Petroleum Consumption
moommho..-aE I along
U.S. Gov't Defmenti
U.S 93% G ofGot)
1% Expeditionaryf -, .- 6% Shore
T : biNavy
(25% of DoD)1111
0 Totl: 29 M bbis In FY08
Figure 1-5: US Navy Petroleum Consumption
(Source: Cullom, Sustainable Energy and National Security)'
-73% -WL -1*~ -- 1* 4r -27% -or Tactical Shore Tactical Shore
01
23%
16% C3 II ~ 3% 3% _ _ _ _ _ _ A *Figure 1-6: US Navy Petroleum Consumption by Application and Supply by Source
(Source: Cullom, Sustainable Energy and National Security)'
sources without compromising its planning and operational objectives. Its consideration of energy efficiency as a tool to increase its tactical capability and logistical performance indicates a sound grasp of a holistic view of energy. And its
aggressive stance with regards to early testing and adoption of alternative energy sources acknowledges its potential to be a resourceful facilitator of energy
innovation. It has backed its vision by setting goals of sourcing 50% of its energy
6 RADM Philip H. Cullom Director, OPNAV N45, "Sustainable Energy and National Security: The U.S.
Navy Perspective."
7 Ibid.
requirements afloat and on-shore from alternative sources such as biofuels and fuel cells by 2020. It went further in setting a target of sailing the "Great Green Fleet: By 2016, the Navy will sail the Great Green Fleet, a carrier strike group composed of nuclear ships, hybrid electric ships running biofuel, and aircraft flying on biofuel", a remarkable milestone sure to spur tremendous innovation.
1.2.3 The Challenge Ahead
For the US Navy to meet its targets a number of challenges must be either overcome or controlled for. Three of these are discussed as illustrative of the issues involved. The remainder of this document will cover these and other issues in detail.
1. To meet its 2020 goal of sourcing 50% of liquid fuels from alternative sources, it will need to ensure a supply of 380,100 gallons per day or 9,050 barrels per day
of jet fuel. Hydroprocessing is a promising pathway for renewable jet fuel but it lacks any scale production capacity for feedstock oil. Pending imminent
certification of HRJ by the ASTM, producers are expected to line up financing for launching HRJ projects using plant oils from farmed crops. On the other hand while Fischer-Tropsch fuels are produced at scale today their relatively worse sustainability footprint reduces their attractiveness as an option.
2. With respect to HRJ, a key issue is the debate over the interaction of food and fuel markets. The farming of food or non-food crops not only results in increased use of water and agrichemicals but also interactions between the food and fuel markets. For instance in 2010 and 2011 much sugarcane has been diverted towards global cane sugar markets instead of domestic ethanol production in
Brazil, leading to the country struggling to meet its national mandates for gasoline with high blended ethanol content.
3. Sustainability concerns favor algal oils as feedstock for HRJ. Yet industrial production of algal oils at scale is still a technology in its infancy and is
navigated in a structured and coordinated manner to ensure consistent progress towards industrial-scale commercialization.
2 Advanced Biofuels Industry
2.1 History
Biofuels have been part of human history ever since fire was invented. Perhaps the oldest known biofuel is wood and plant mass, that when burnt was used for cooking, shelter, light, as a protective measure and many other applications by early humans. As humanity started using water (waterwheels) and wind (windmills, sailing ships)
power, it also discovered plant and animal oils that together with wood and plant mass were significant sources of energy. Coal was known to man for thousands of years, perhaps even as early as 10,000 years ago in China. But it was the
introduction of steam power that cemented coal's role as a large-scale source energy. The steam engine, taking over from the waterwheel8, provided a multiplier for coal's embedded energy, and by the mid nineteenth century coal had replaced wood as steam fuel in the eastern United States and established an enduring link between fossil fuels and industrialization9. The discovery of petroleum yielded yet another substitute for steam power and for a while simple economics drove the use
of either coal or petroleum to generate steam.
However it was two specific significant shifts that led to the modern day energy landscape: the developments of transmitted electricity and the internal combustion engine (ICE). The transmission of electricity through copper wires and the
development of electric motors overcame an enduring challenge of allowing the
8 Wikipedia, "Coal, Early Uses."
geographic separation of the production and consumption of energy. The development of the internal combustion engine (and the automobile industry) provided a cost effective means of mass consumer transportation. These two events set in place the enduring paradigms of energy use for modern society:
- The application of electricity as the most cost-effective means of powering small-scale tasks.
- The use of fossil fuels (coal, natural gas, oil), hydroelectric and nuclear technologies for the large-scale generation of electricity, coupled with large
infrastructural builds of electricity transmission and distribution infrastructure. - The use of petroleum-derived liquid fuels to power flexible transportation such
as cars, buses, trucks, aircraft, ships etc.
Fossil fuels have and continue to remain mankind's largest sources of energy. Coal, oil and natural gas are themselves biofuels formed by the exposure over millions of years of the fossilized remains of dead plant and animal organisms buried in the
earth to heat, pressure and chemical processes. It is precisely because it takes millions of years to create them while their depletion occurs at much faster rates that fossil fuels are termed non-renewable.
On the other hand renewable resources provide energy from sources that are naturally replenished e.g. wind, solar, hydro-electricity, geothermal heat and biomass. But mankind has yet to discover the means to generate energy from
renewable resources that is cost-competitive with fossil fuels. Our efforts to generate energy at large scale via processes designed by humans cannot compete with highly energy-dense ready-made fuels that are readily accessible. Consequently given the fundamental role of fossil fuels in underpinning economic progress and
the economy, our society is extremely susceptible to economic disruptions arising from fossil fuels. The oil crisis of 1973 is the poster child of such disruptions and revealed developed economies' exposure to fossil fuels.
Fossil fuels also contribute to an economic externality but environmental reality that has and continues to generate much debate: the release of greenhouse gases believed by a significant the majority of scientific observers to be the major driver behind changing world climate. Credible scientific analysis demonstrates that the increasing concentration of greenhouse gases, in particular carbon dioxide, is causing macro geophysical changes in the environment with demonstrated impacts
on humanity and the natural world.
It is precisely these disruptive economic and environmentalforces that have driven the evolution of the biofuels industry. The industry vernacular employs the term biofuels to primarily refer to liquid fuels produced from biomass and used to power transportation. The current state of invention and technology address two types of fuels: alcohols such as ethanol, methanol, butanol etc, and long-chain hydrocarbons
similar to fuels such as kerosene, gasoline, jet fuel and others derived from petroleum.
2.1.1 Alcohols
The production of alcohols from biomass via fermentation of plant sugars is a well-understood process that has been employed for centuries to produce a variety of food products from wine, beer and spirits to curing meats, leavening bread, producing vinegar etc. For many decades alcohols have been considered for
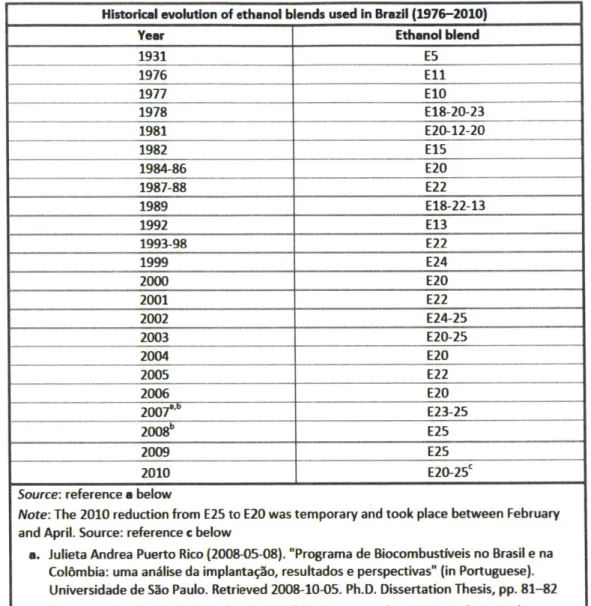
augmenting the liquid fuel supply for ICE-based transportation. Ethanol is blended in various proportions for use in engines modified for target blend ratios. Typically called flex-fuel vehicles, their use of blended gasoline reduces the amount of gasoline required to travel the same number of miles. Brazil is the largest user of flex-fuel vehicles and has a mandated 25% anhydrous ethanol/75% gasoline (also known as E25) blend requirement since 200710.
There are several economic challenges to adopting ethanol as a mass substitute for gasoline. Most vehicle manufacturing plants in the world are not setup to produce flex-fuel engines, and their modification is ostensibly an proposition. Ironically the very first commercially produced vehicle, the Ford Model T, produced in 1908 could run entirely on corn ethanol, gasoline or a combination of the two11. Secondly
ethanol is not fungible with gasoline and therefore requires its own distribution infrastructure, a proposition that has never been economic given historical oil prices and low consumer demand.
2.1.1.1 Sugarcane and Corn Ethanol
The largest producers of ethanol in the world are Brazil and the United States. Brazilian ethanol is made from sugar cane and US ethanol is made from corn. Brazil's ethanol industry started as early as 1919 when "the Governor of
Pernambuco mandated all official vehicles to run on ethanol"12. Subsequently Brazil
10 Ministerio da Agricultura, by way of Wikipedia, "Portaria
N2 143, de 27 deJunho de 2007"(in
Portuguese).
11 Fuel-Testers, "Ethanol Fuel History."
12 William Kovarik, by way of Wikipedia, "Ethanol's first century -Fuel blending and substitution
programs in Europe, Asia, Africa and Latin America."
has continued increasing its ethanol mandates peaking at a 25% ethanol content in blended gasoline.
Historical evolution of ethanol blends used in Brazil (1976-2010)
Year Ethanol blend
1931 E5 1976 El1 1977 E10 1978 E18-20-23 1981 E20-12-20 1982 E15 1984-86 E20 1987-88 E22 1989 E18-22-13 1992 E13 1993-98 E22 1999 E24 2000 E20 2001 E22 2002 E24-25 2003 E20-25 2004 E20 2005 E22 2006 E20 2007'' E23-25 2008' E25 2009 E25 2010 E20-25C
Source: reference a below
Note: The 2010 reduction from E25 to E20 was temporary and took place between February
and April. Source: reference c below
a. Julieta Andrea Puerto Rico (2008-05-08). "Programa de Biocombustiveis no Brasil e na Col6mbia: uma anhlise da implantaso, resultados e perspectivas" (in Portuguese). Universidade de 5o Paulo. Retrieved 2008-10-05. Ph.D. Dissertation Thesis, pp. 81-82
b. "Portaria NO 143, de 27 de Junho de 2007" (in Portuguese). Ministerio da Agricultura, Pecuwria e Abastecimento. Retrieved 2008-10-05. This decree fixed the mandatory blend
at 25% starting July 1st, 2007
c. "Portaria No. 7 de 11 de Janeiro de 2010 do Ministerio de Estado da Agricultura, Pecuhria e Abastecimento e Resolue.o No. 1 do Conselho Interministeriari do Asacar e do Alcool" (in Portuguese). Didrio Oficial da Uniao. 2010-01-12. Retrieved 2010-02-10. pp. 3
Table 2-1: Historical evolution of ethanol blends in Brazil (Source: Wlpedia: Ethanol Fuel n BrazW
Brazil has a number of economic, geographic and political factors that favor its cost-effective production of ethanol from sugar cane. The Brazilian sugar cane industry
has1 a small impact on food prices, very high levels of productivity, low
requirements for input fertilizers and agrochemicals, and is net carbon negative assuming little long-distance transportation4. The industry employs efficient agricultural technology with modern equipment and uses almost all its residual cane-waste in the production of heat and power for processing. It is generally
agreed that the net environmental impact of Brazilian ethanol is positive. In 2008-200915 Brazil produced over 27.5 billion liters of ethanol and exported over 5 billion liters, approximately 19%. The rest is consumed within the country primarily for powering flex-fuel transportation vehicles.
US corn ethanol does not share these characteristics of sugar cane. In the last decade corn ethanol has gone from high levels of popularity to a current lull in
attractiveness. Although the US energy policies encourage the production of ethanol via Renewable Fuel Standards (RFS), over-investment in production assets has led to excess production without matching demand. Corn ethanol has also lost favor due to extensive research that demonstrates a negative sustainability; although the subject of vigorous continuing debate amongst the various stakeholders, such research in combination with a poor fueling and vehicular infrastructure has impacted corn ethanol's appeal as a transportation fuel. A few of years into the 2 1
century the focus in the US shifted to cellulosic ethanol.
13 Weber Amaral, ESALQ-USP, "Environmental sustainability of sugarcane ethanol in Brazil." " Edward Smeets, "The Sustainability Of Brazilian Ethanol -An Assessment Of The Possibilities For Certified Production."
IS UNICA, Sugarcane Industry Association of Brazil, Sugarcane Industry Statistical Data accessed April
19, 2011.
2.1.1.2 Cellulosic Ethanol
The US has applied considerable academic and corporate research as well as public and private investment towards the development of cellulosic ethanol. Cellulosic ethanol is ethanol produced from non-food plant matter e.g. corn stover,
switchgrass, landscaping plant-byproducts, wood, grasses etc. The development of enzyme technologies in the last two decades has spurred much of this excitement. Much venture capital and public funding has been directed towards the
commercialization of cellulosic ethanol. But cellulosic ethanol is emblematic of the typical maturity cycle of energy (discussed in greater detail in subsequent chapters) ventures and has yet to reach competitive costs of production.
2.1.2 Long-chain Hydrocarbons
In the early 2000s, researchers started exploring pathways to create long-chain hydrocarbons fuels with chemical and physical properties very similar to traditional petroleum-derived fuels produced by refining crude oil. Some of these long-chain hydrocarbon products can serve as direct substitutes, or drop-in replacements, for petroleum-derived fuels e.g. renewable diesel can substitute diesel, renewable jetfuel can substitute JP-8 etc. Others, such as biodiesel are significantly different and are used either in blends or further modified into directly usable forms.
2.2 Technology Pathways
The National Renewable Energy Laboratory (NREL) recognizes three major applications of biomass:
- Biopower: burning directly or, after conversion into more efficiently burning
gaseous or liquid fuels, to generate electricity
- Bioproducts: converting biomass into chemicals for various applications including substitution for conventional petroleum derivatives
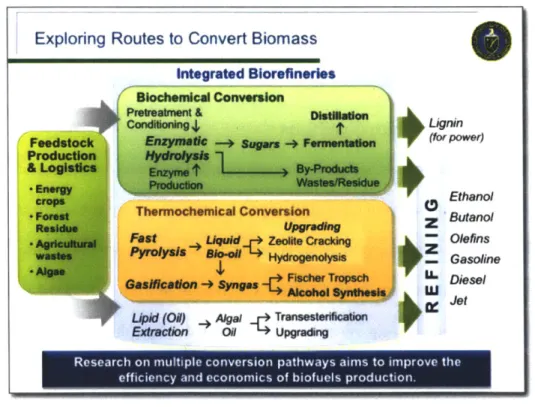
This study concerns itself with biofuels. Figure 2-1 depicts the myriad ways biomass feedstock can be converted into liquid fuels. Note that lignin produced via
biochemical conversion is not used as a liquid transportation fuel but instead as a replacement for fuels used to produce heat and electricity.
Exploring Routes to Convert Biomass
Integrated Biorefineries
* Retealmnit & kmam
Comnioing4 gnin
Enzynwe*- Fmsao (forpower)
cpEthanol
ThoConversion throealcoolno Fastp01ading
Sugr an, oradFet
ug
etha olire prodced n bohemica Hydrogen tcis GasolineT, U-Diesel
ogd
_0 , AkW Transesterseatin
' eExuacdon oif upgradi
Resea Ich on amultiple conversion pathways aimns to inuprove the
efflitC c nyaTId econIoPn CS Of b oft e s prod~lt tor
Figure 2-1: The many pathways to produce liquid fuels from biomass
iSource:
Gorin, U.S. Department of Energy, Biomass Program) There are three major pathways for converting biomass into biofuels:1. Biochemical conversion that produces alcohols such as ethanol and butanol. Sugar cane, corn and cellulosic ethanol are produced using biochemical conversion.
2. Thermochemnical conversion that with the application of heat and other methods, including catalysts, converts biomass to either synthetic gas (also known as
syngas) or an intermediate bio-oil. Both syngas and bio-oil can be processed to produce long-chain hydrocarbon fuels including diesel, and natural gas. One such process, Fischer-Tropsch processing, has garnered much interest specifically due to its applicability to coal and natural gas in combination with carbon
capture to produce liquid fuels. Syngas can also be processed into alcohols. 3. Lipid processing that takes as input plant and/or animal oils, fats and greases and
converts them to bio-diesel or other long-chain hydrocarbon fuels such as gasoline and jet fuel. There are two main sub-pathways in lipid processing:
transesterification and hydroprocessing.
The biochemical conversion pathway traditionally relied on the fermentation of plant sugars by microorganisms to produce alcohols. Researchers are broadening this pathway by using synthetic biology to alter the metabolic pathways of
microorganisms that metabolize sugars. These tailor-made, engineered
microorganisms metabolize sugar and/or other plant material into target molecules. In fact synthetic biology is being applied in many different ways. Some researchers are engineering algae to make it easier to access the oils produced by the algae, which is then used in lipid processing.
2.3 Feedstock and Production Paths
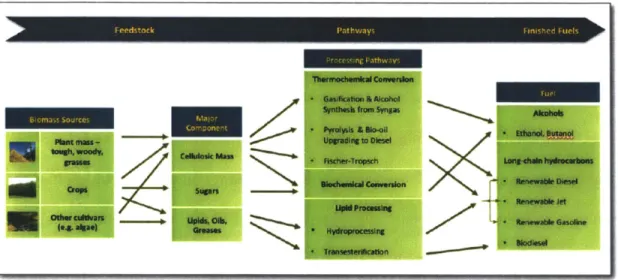
Figure 2-2 shows the intricate yet diverse use of biomass via the pathways to form finished fuels. The sources of plant biomass can be generally categorized into three types:
General plant mass -this is cellulosic and hemi-cellulosic plant mass that is not
part of human diet and is either not cultivated or is a discarded byproduct of cultivation. Examples are switchgrass, other wild grassesforest woody biomass, corn stover, sugar cane bagasse.
- Food crops - crops cultivated for human consumption that are valuable sources of sugars or oils that can be converted into alcohols or long-chain hydrocarbons. Discarded portions of a cultivated plant with little value can be used as general plant mass e.g. corn stover. Examples of sugar producing crops are corn, sorghum and sugar cane; examples of oil producing crops are canola, coconut, palm oil, rapeseed.
- Non-food crops - crops cultivated explicitly for producing oils for conversion to
long-chain hydrocarbons. Examples are algae, camelina and jatropha. Discarded portions of the cultivated plant can be used as general plant mass.
Figure 2-2: Biofuels production paths
The three major sources of plant biomass give rise to three kinds of major components: cellulosic mass, sugars and oils (lipids). Biochemical processes normally produce alcohols. Thermochemical processes can produce both alcohol and long-chain hydrocarbons. Lipid processing is used to produce long-chain hydrocarbons only. So although there are three major pathways for biofuels, the combination feedstock source, components and processing technologies give rise to many paths for producing biofuels.
2.4 Characterizing Commercial Initiatives
All commercial biofuels initiatives are characterized by a combination of feedstock and technology pathway. This arises from the sensitivity of the technology,
environmental impact and cost of production to the choice of feedstock:
- The chemical processes involved in large-scale production typically require expensive re-calibration depending on the feedstock. These can range from simple re-calibration requiring a few days of downtime to major capital modifications.
- The development of biofuels has been strongly influenced by the objective of achieving a net negative well-to-wake environmental footprint This
consideration is influenced strongly by the net environmental impact of
procuring and transporting the feedstock to the biofuels facility. Several biofuels plants choose to situate themselves in close proximity to their sources of
feedstock. In fact some companies are also focusing on creating modular, mobile biofuel plants.
- Finally feedstock cost plays a dominant role7 in the final fuel cost. Although plants have high capital costs, once amortized over their lifespan (typically twenty years), capital costs contribute a small fraction to the cost of the final product.
2.5 The Shift to Drop-in Replacement Biofuels
Ethanol and other alcohols used as fuels are mainly used to create conventional fuel blends and contribute small proportions. Even Brazil's mandate calls for a 25% blend of ethanol with gasoline. There are several reasons that line behind why
1 6
Russell W. Stratton, Life Cycle Greenhouse Gas Emissions from Alternative Jet Fuels -PARTNER Project 28 Report.
17 Matthew Pearlson, "A Techno-Enviro-Economic Assessment of Hydroprocessed Renewable
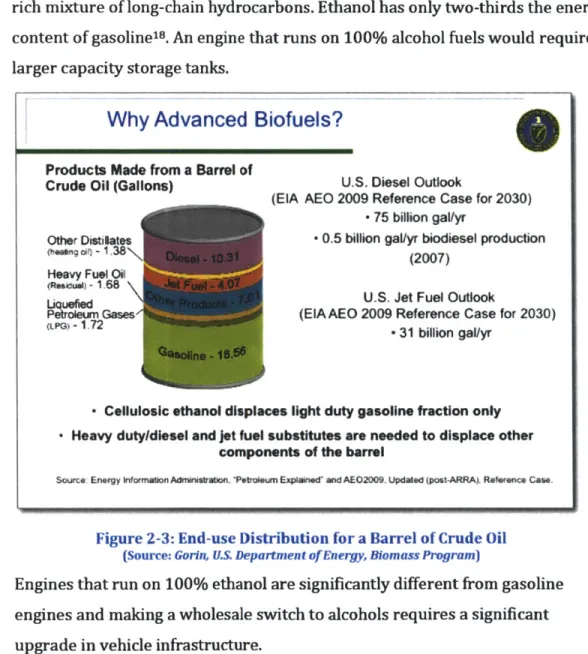
100% alcohol fuels don't power transportation infrastructure anywhere in the world. We discuss a few below specifically in context of corn ethanol in the US. > The energy content of alcohols is lower than conventional gasoline, which is a
rich mixture of long-chain hydrocarbons. Ethanol has only two-thirds the energy content of gasoline18. An engine that runs on 100% alcohol fuels would require larger capacity storage tanks.
Why Advanced Biofuels?
Products Made from a Barrel of
Crude Oil (Gallons) U.S. Deel Outlook
(EIA AEO 2009 Reference Case for 2030)
-75 billion gaVyr
Other Distibates 0.5 billion galyr biodiesel production
(heseng ai -1. 38 (2007)
Heavy Fue Oil
(Reseuen- 1.68
U.S. Jet Fuel Outlook
P=e Gases (EIA AEO 2009 Reference Case for 2030)
(PG) - 1.72 S- 31 billion gaVyr
- Cellulosic ethanol displaces light duty gasoline fraction only Heavy duty/dUesel and jet fuel substitutes are needed to displace other
components of the barrel
Source Energy Infmadon Admitaton. PeoTrieum Explainem and AEO2009. Updated (post-ARRA), Reference Case.
Figure 2-3: End-use Distribution for a Barrel of Crude Oil
(Source: Gorin, US. Department of Energy, Biomass Program)
> Engines that run on 100% ethanol are significantly different from gasoline engines and making a wholesale switch to alcohols requires a significant upgrade in vehicle infrastructure.
> Ethanol has a strong affinity for water and is corrosive. It cannot be distributed using the existing liquid fuels delivery infrastructure, which therefore adds to its cost.
18 David Rotman, "The Price of Biofuels."
There is considerable debate about the externalities related to corn ethanol and its sustainability:
i. The energy-returned-to-energy-invested ratio i.e. does it provide more energy when used than it takes to produce?19 20
ii. The net GHG emissions - does ethanol's GHG LCA reveal a net negative
emission profile
iii. The impacts of the large-scale farming of corn e.g. extended use of fertilizer and agrichemicals
iv. The impacts of allocation of land to the production of corn for fuel on the dynamics of food supply
As the market share of ethanol rises, its also begins impacting the commercial economics of refineries. Furthermore ethanol only displaces up to 1O%21 (in the US, see Figure 2-3) of the 41% or about 4% of a barrel of crude oil. The US pursuit for energy independence needs decoupling the nation's demand from the remaining barrel of crude. The other large proportions - diesel at 23% and jet fuel at 9% -are major targets for replacement to reduce dependence on crude oil. Drop-in
replacement fuels directly address this while also avoiding the investment hurdle of replacing the existing infrastructure of engines and fuel distribution.
Furthermore the substitution of significant portions of crude oil by biomass-derived drop-in replacement fuels fosters a less disruptive geo-political path towards energy independence and security. The biomass feedstock identified for fuels is not
19 David Pimentel, "Corn Ethanol as Energy."
z0 Daniel R. Chavas, "The energy balance of corn ethanol: a standardized, comparative review of four recent studies."
geographically bound to any nation, is available from many more nations, and can be cultivated in many other nations.
Finally drop-in replacement biofuels offer an alternative to traditional fuels in the marketplace. They have the capability (although the near-term possibility is strongly challenged in 22) to favorably impact price dynamics into the market and
this has served as a strong motivator for the immense efforts to boot-strap this industry by commercial aviation and the US DoD, especially the US Navy.
2.6 Renewable Jet Fuel
2.6.1 Technical Requirements
Conventional jet fuel must meet the technical requirements specified in ASTM D1655 (Standard Specification for Aviation Turbine Fuels). A new standard has been developed23 D7566 (Standard Specification for Aviation Turbine Fuel
Containing Synthesized Hydrocarbons) for biofuels derived from alternate sources (other than petroleum). Biofuels produced to this standard and blended up to a maximum 50% ratio with conventional jet fuel produce an end fuel considered to be functionally equivalent to conventional jet fuel. The new standard has been
approved for biofuels produced using Fischer-Tropsch processing, and is currently undergoing the approval process for those derived from hydroprocessing. These biofuels are considered drop-in replacements, as they require no changes to the engine and distribution infrastructure. Both the US Navy and the US Air Force have successfully tested aircraft for hydroprocessed fuels derived from algae and
22
Emma Nygren, "Aviation fuel and future oil production scenarios."
23
Michel BaIjet, Operations,IATA, "Aviation BiofueL"
camelina respectively24.The US Air Force also successfully tested aircraft on Fischer-Tropsch derived fuels25.
2.6.2 Pathways
The main pathways currently (2009 - 2001) being considered for producing renewable jet fuel are Fischer-Tropsch processing and hydroprocessing of lipids. Transesterification, the other lipid processing method, uses methanol to treat lipids to produce Fatty Acid Methyl Esters (FAME), better known as biodiesel. Biodiesel requires additional processing for conversion to drop-in replacement
transportation fuels that is not cost competitive.
2.6.2.1 Fischer-Tropsch Processing
Developed in 1923 to produce liquid fuels from coal, the Fischer-Tropsch process has been further developed to use cellulosic biomass and natural gas as inputs. The term Coal-to-Liquids (or CTL), Gas-to-Liquids (GTL) and Biomass-to-Liquids (BTL) refer to the production of liquid fuels using coal, natural gas and cellulosic biomass as input to a Fischer-Tropsch process. The process consists of four main steps:
1. Creation of synthesis gas: syngas, a mixture of hydrogen and carbon monoxide is created using biomass, coal or natural gas as feedstock. Biomass and/or coal feedstock is reacted with steam at elevated temperatures and moderate
pressure to produce syngas. Natural gas is converted to syngas using one of two well-established commercial methods: partial oxidation or steam reforming. 2. Purification of syngas stream: accomplished by removing CO2 and small amounts
of gaseous compounds derived from impurities e.g. sulfur in the feedstock.
24 Stephen Trimble, "US Air Force moves closer to greening its fleet."
2
Gasification of coal and/or biomass results in large concentrations of C02. In comparison creating syngas from natural gas generates insignificant amounts of
C0
2.
3. Fischer-Tropsch synthesis: in this the syngas is passed over a catalyst under specific process conditions to yield a "broad mixture of hydrocarbons ranging from gases (such as ethane) to waxes (longer hydrocarbons)" 26; the composition
of this mixture can be can be controlled by altering reaction conditions. 4. Refining: the resultant hydrocarbon mixture is then "upgraded to liquid fuels
using well-established methods in common use in petroleum refineries"26.
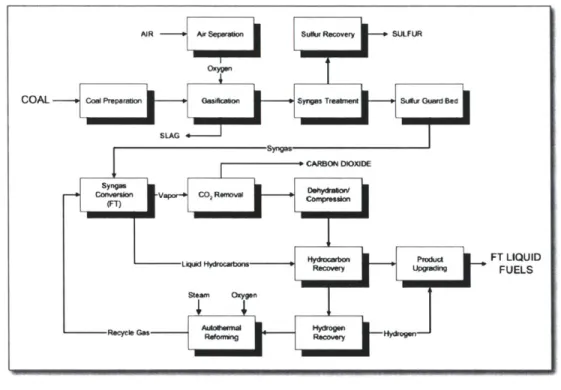
Figure 2-4: Coal-to-Liquids Fischer-Tropsch Processing
(Source: Marano, Life-Cycle Greenhouse-Gas Emissions Inventory For Fischer-Tropsch Fuels 27)
Figure 2-4 illustrates at a high-level the four general steps for producing liquid fuels using Fischer-Tropsch processing. This particular example uses coal as input
feedstock.
26
James I. Hileman, MIT, Near-Term Feasibility ofAlternative Jet Fuels. 27
John J. Marano, Life-Cycle Greenhouse-Gas Emissions Inventory For Fischer-Tropsch Fuels.
Chapter 2
COAL
FT LIQUID FUELS
2.6.2.2 Hydroprocessing
26 describes the process to create HRJ as one that "first uses hydrotreatment to
deoxygenate the oil and then uses hydroisomerization to create normal and
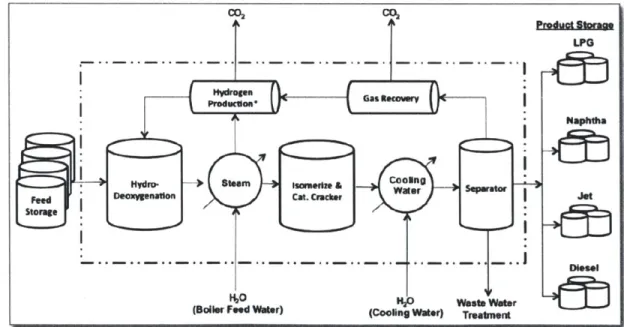
isoparaffinic hydrocarbons that fill the distillation range of Jet A". Hydroprocessing is a well-understood process that has long been employed by the oil and gas, and chemicals industry. Figure 2-5 depicts a simplified hydroprocessing system design. The process mainly requires as input water, hydrogen and a catalyst that needs replenishing on an annual basis. Much of the water can be recycled with some loss. Hydrogen can be either produced on-site using steam reformation or purchased as an input material.
"a'-'P West WOWe ....L...j
(Boiler Fed Water) (Cooing Waer) Treamert
Figure 2-5: A simplified hydroprocessing system design
(Source: Pearlson, A Techno-Enviro-Economic Assessment of Hydroprocessed Renewable Distillate
Fuels 25)
28 Matthew Pearlson, "A Techno-Enviro-Economic Assessment of Hydroprocessed Renewable Distillate Fuels."
2.6.3 Technologies
This section examines the technological areas of focus in implementing the two major pathways discussed in the preceding section.
2.6.3.1 Fischer-Tropsch
The focus of decision-making for Fischer-Tropsch processing is driven by the choice of feedstock. Plants and processes are designed and optimized for specific input feedstock. The technology issues deal with improving efficiencies and reducing input costs.
Fischer-Tropsch has been an attractive proposition for countries lacking oil reserves of their own while being rich in coal or natural gas. Sasol, a South African energy and chemicals company operates a synthetic fuels facility in Secunda, South Africa where it "converts more than 40-million metric tons of coal a year into liquid fuels,
industrial pipeline gas and a range of chemical feedstock, including the building blocks for industrial solvents and polymers" 29. More recently the facility is also
using biomass as feedstock. The company also operates its Oryx GTL plant (34,000 bpd of diesel and naptha capacity) in Ras Laffan, Qatar and is currently building GTL plant in Nigeria30. Royal Dutch Shell, a Dutch oil and gas company, has built a GTL plant, also in Ras Laffan, Qatar, and started commercial production in March 201131.
The use of biomass is not widespread because biomass (e.g. forest residue, waste wood, switchgrass) is fundamentally not very energy dense and plant capital costs
9 Sasol, company website, unlocking the potential wealth of coal -introducing Sasal's unique coal-to-liquids technology.
30 Reuters, "Sasol's Nigeria GTL plant delayed till 2013"
31James
Herron, Dow Jones Newswires, "First Gas Into Shell's Qatar Pearl Gas-To-Liquids."
are high. So the fundamental concern with Fischer-Tropsch processing to produce liquid fuels is the continued use of fossil fuels and the resulting GHG emissions. Proponents cite CCS as a remedy. However, as discussed in §2.6.4, CCS is an unproven and expensive proposition.
2.6.3.2 Hydroprocessing
Hydroprocessing is a well-understood process and the technological focus in this area is on the efficient production of feedstock.
2.6.3.2.1 Crops
One source of feedstock for hydroprocessing is plant oils. Plant oils can be obtained from several crops; some examples are soybean, rapeseed, palm, canola, jatropha and camelina. The cost of oil produced is a function of the yield from the farmed land. From a sustainability point of view, additional factors such as the most effective utilization of land, water consumption, use of fertilizers, pesticides and other agrichemicals are also factors that must be considered for an appropriate assessment An important economic dynamic arises if the cultivar is a food crop. In this case two different markets determine the crop's value: the food industry and the fuel industry. Hence the relative attractiveness of a crop in one market may lead to a scarcity in the other. This dynamic was has been felt strongly in Brazil in 2010 when the high value of cane sugar in the global market led to a scarcity of sugarcane
for the ethanol industry.
The production of plant oils has two cost components: farming and oil extraction. These issues are explored in the context of camelina in the following paragraphs.
In the past few years camelina (Camelina Sativa) has gained recognition as a
promising source of plant oil without many of the issues associated with traditional crops. Camelina is farmed commercially in Europe for vegetable oil and animal feed. It is gaining popularity in North America as well, with efforts to certify it for both humans (GRAS or "Generally regarded as safe" approval from FDA) and animals (AFFCO feed certification) 32,33. Camelina's agronomic potential is becoming better
understood because of its increasing attractiveness ("better drought tolerance and greater spring freezing tolerance than canola"34) and ongoing research3s,36.
Although camelina enjoys the benefits of being able to grow on marginal land with little water and nitrogen, and does not currently compete with food crops, its
emerging popularity37,38 for human consumption, cosmetics, animal feed, renewable diesel and other applications, coupled with its superior agronomics from low
seeding rates, weed control and adaptability39 will drive its farming at
commercial-scale. Targeted Growth Inc., a crop biotechnology company focused on improving crop yields estimates fixed costs of camelina production in the $45-$68 per acre range, one-third to one-fourth lower than other oilseeds40.Table 2-2 extracted from
32
KA McVay, Camelina Production in Montana.
33 TheCattleSite News Desk, "Approval for Camelina Meal in Livestock Feeds."
34 KA McVay, Camelina Production in Montana.
35
Alice L Pilgeram, "Camelina sativa, A Montana Omega-3 and Fuel Crop."
3 Xue Pan, "A Two Year Agronomic Evaluation of Camelina Sativa and Brassica Carinata in NS, PEI
and SK."
37 Amy Stratton, "Camelina sativa." 3
Kathleen Grady, Camelina Production.
3
Don Wysocki, Camelina, a Potential Oilseed Crop for Semiarid Oregon. 40 AG Professional, "Growing crops for biofuels."
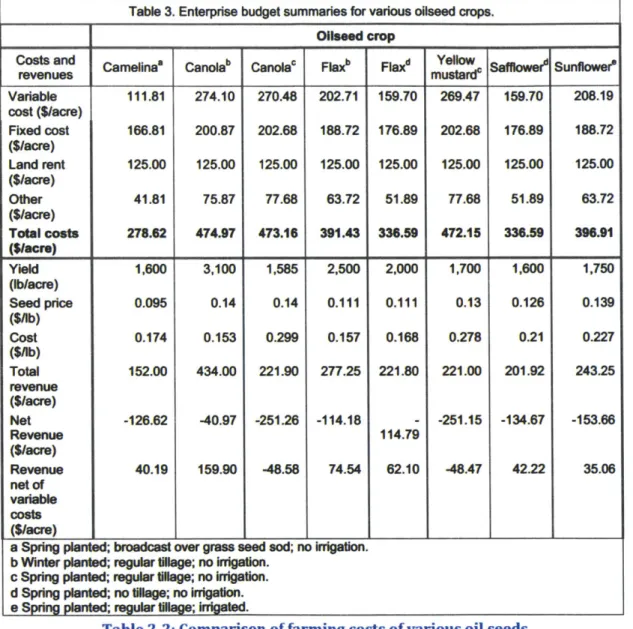
an Oregon State University study41 shows that the commercial farming costs of camelina are extremely competitive with respect to other oil seeds.
Table 3. Enterprise budget summaries for various oilseed crops.
Oilseed crop
Costs and Camelinas Canolab Canolac Flaxb Flaxd mu Safflower" Sunflower"
revenues mustard Variable 111.81 274.10 270.48 202.71 159.70 269.47 159.70 208.19 cost ($/acre) Fixed cost 166.81 200.87 202.68 188.72 176.89 202.68 176.89 188.72 ($/acre) Land rent 125.00 125.00 125.00 125.00 125.00 125.00 125.00 125.00 ($/acre) Other 41.81 75.87 77.68 63.72 51.89 77.68 51.89 63.72 ($/acre) Total costs 278.62 474.97 473.16 391.43 336.59 472.15 336.59 396.91 ($/acre) Yield 1,600 3,100 1,585 2,500 2,000 1,700 1,600 1,750 (Ib/acre) Seed price 0.095 0.14 0.14 0.111 0.111 0.13 0.126 0.139 ($/lb) Cost 0.174 0.153 0.299 0.157 0.168 0.278 0.21 0.227 ($/b) Total 152.00 434.00 221.90 277.25 221.80 221.00 201.92 243.25 revenue ($/acre) Net -126.62 -40.97 -251.26 -114.18 - -251.15 -134.67 -153.66 Revenue 114.79 ($/acre) Revenue 40.19 159.90 -48.58 74.54 62.10 -48.47 42.22 35.06 net of variable costs ($/acre)
a Spring planted; broadcast over grass seed sod; no Irrigation. b Winter planted; regular tillage; no Irrigation.
c Spring planted; regular tillage; no irrigation.
d Spring pianted; no tillage; no Irrigation.
e Spring pianted; regular tillage; irrigated.
Table 2-2: Comparison of farming costs of various oil seeds
(Source: Jaeger, Economics of Offseed Cops etc.")
Standard commercial farming costs include: seeding, water, electricity, fuel,
fertilizer, labor, machinery, maintenance, rent and others. Every one of these factors is exposed to the same risk factors as commercial-scale food farming.
* William K jaeger, Economics of Oilseed Crops and Their Biodiesel Potential in Oregon's Willamette Valley.
Once harvested, oil is extracted from the seeds with the remaining byproduct, called camelina meal, potentially sold for animal feed or use in other man-made products. Oil is extracted from oilseeds using one of two methods42: mechanical extraction or solvent-based extrusion. Large-scale production capacities of more than 75 tons per day normally employ solvent-based extrusion.
2.6.3.2.2 Algae Advantages
Algae have been recognized as a promising source of plant oils for conversion to liquid fuels due to a number of reasons. The following reasons are reproduced from the National Algal Biofuels Technology Roadmap43:
1. Algal productivity can offer high biomassyields per acre of cultivation. 2. Algae cultivation strategies can minimize or avoid competition with arable
land and nutrients used for conventional agriculture.
3. Algae cultivation can utilize wastewater, produced water, and saline water,
thereby reducing competition for limited
freshwater
supplies.4. Algae can recycle carbon from CO2-rich flue emissions
from
stationary sources,including power plants and other industrial emitters.
5. Algal biomass is compatible with the integrated biorefinery vision of producing a variety of fuels and valuable co-products.
Oil yield estimates range from 48 gallons/acre/year for soybean, 102 for sunflower, 635 for oil palm to a range of 1000-6500 gallons/acre/yeare3. Algal co-products from a biorefinery include oils, protein, and carbohydrates and others.
42loel Schumacher, Large Scale Commercial Oilseed Processing.
4 U.S. Department of Energy, Biomass Program, National Algal Biofuels Technology Roadmap.
Algal Oils as Biofuels Feedstock
Three major groups of algae are considered for biofuels feedstock: microalgae, cyanobacteria (formerly called "blue-green algae") and macroalgae (seaweed). Microalgae are tiny organisms that grow in water and tint it green. These are by far the best-researched algal type for producing biofuels. The remainder of this
document concerns itself primarily with biofuels from microalgae.
Cultivation
Microalgae create their valuable oil or lipids in different ways. Phototrophic algae photosynthesize and hence require light, water, nutrients and C02 to grow.
Figure 2-6: Three types of cultivation systems (Source: National Algal Biofuels Technology Roadmap")
Heterotrophic algae grow without light and are fed a carbon source, typically sugar.
Heterotrophic algae are usually cultivated in fermentation tanks. Phototrophic algae are grown in open ponds (a popular design choice is raceway ponds) or closed
photobioreactors. A lot of the effort of algae ventures is focused on designing
cultivation systems to lower capital costs and improve efficiencies. The Algal Biofuels Technology Roadmap states: Designing an optimum cultivation system involves leveraging the biology of the algal strain used and integrating it with the
best-suited downstream processing options. Choices made for the cultivation system
are key to the affordability, scalability, and sustainability of algae to biofuel systems.
Carbon Flocculent Dioxide = ,,4-I I
-i
I Nutrients spe Algae Water Recycle Make-up WaterFigure 2-7: An example process design for algal oil production and processing
(Source: Pienkos, "Algal Biofuels: Ponds and Promises."4 5)
Harvesting and Oil Extraction
Obtaining algal oil involves harvesting and de-watering the algae from the cultivation systems followed by extraction of oil from the algae. Again, from the Algal Biofuels Technology Roadmap: Most challenges in extraction are associated with the industrial scale up of integrated extraction systems. While many analytical
techniques exist, optimizing extraction systems that consume less energy than
contained in the algal products is a challenge due to the high energy needs associated
with both handling and drying algal biomass as well as separating out desirable
4s Philip T. Pienkos, National Bioenergy Center, "Algal Biofuels: Ponds and Promises."
Chapter 2
I I
Algae Gtowth HdrVesting L IpId Iff f: ff .1 # , ,
products. Some algal biomass production processes are investigating options to bypass
extraction, though these are also subject to a number of unique scale-up challenges.
Focus of Science and Engineering Efforts
There are several areas of being pursued for producing biofuels from algae. The Algal Biofuels Technology Roadmap presents a number of research areas for algae biofuels. The two focus areas, as described in the roadmap, that is receiving much commercial research attention are described in Figure 2-8.
Suple si= fm a Vw styof einmesfrmdmum iverity
aipnsdatbsdconuctimonAalisdf saki wim dualldchemasiatinm
Imenigeln gentics and biochmbicpEtrwasfrdcion offusm peoeurs
snsnf idkdAdbygn mnua i pinubrding
imestigsterL# natpl asece~.oe~dhbrd, and Y coastelof-Orw ssie potabophi, helMObpic.
Admerbustad stabe otasat acmuie sam
Optuimsyem foralgal seu1iyO r ueprecUUIers~eg.lpids)
sutinmBendasOt-elfactIiymunIge 0m El4.r.UAdMAImW
Figure 2-8: Feedstock and Conversion are key areas of commercial algal fuel research (Source: Pienkos, "Agal Biofuels: Ponds and Promises."4 6)
The major focus areas for feedstock production are increasing yield, reducing water, land and nutrients usage, cultivation systems optimization, reducing capital costs and minimizing process energy intensity. Although algal cultivation is often cited as a good consumer for the carbon dioxide contained in power plant emissions,
research continues on the advantages of transporting flue gas or a pure carbon dioxide stream from purified flue gas. The major focus areas for conversion to fuel are improving process yield, recycling to minimize waste and reduction of process energy intensity.
2.6.3.2.3 Halophytes
Halophytes are plants that grow and thrive in salt or brackish water on marginal lands. They offer several benefits such as not needing arable land, soil
decontamination and carbon sequestration, and cleansing the environment. Salicornia (Salicornia bigelovii) has been recently identified as a promising oilseed halophyte and a number of research programs, especially in the Middle East, are examining its potential for biofuels.
2.6.3.2.4 Synthetic Biology
Synthetic biology refers to a recent area of biological research that combines science and engineering with the objective of modifying existing or creating new biological functions or systems for specific purposes. For example Synthetic Genomics is attempting to apply bioengineering principles to algae to select biological
Chapter 2 " Ibid.