HAL Id: hal-02935808
https://hal.sorbonne-universite.fr/hal-02935808
Submitted on 10 Sep 2020
HAL is a multi-disciplinary open access
archive for the deposit and dissemination of
sci-entific research documents, whether they are
pub-lished or not. The documents may come from
teaching and research institutions in France or
abroad, or from public or private research centers.
L’archive ouverte pluridisciplinaire HAL, est
destinée au dépôt et à la diffusion de documents
scientifiques de niveau recherche, publiés ou non,
émanant des établissements d’enseignement et de
recherche français ou étrangers, des laboratoires
publics ou privés.
Distributed under a Creative Commons Attribution - NonCommercial - NoDerivatives| 4.0
International License
Impact of lockdown measures to combat Covid-19 on air
quality over western Europe
Laurent Menut, Bertrand Bessagnet, Guillaume Siour, Sylvain Mailler,
Romain Pennel, Arineh Cholakian
To cite this version:
Laurent Menut, Bertrand Bessagnet, Guillaume Siour, Sylvain Mailler, Romain Pennel, et al.. Impact
of lockdown measures to combat Covid-19 on air quality over western Europe. Science of the Total
Environment, Elsevier, 2020, 741, pp.140426. �10.1016/j.scitotenv.2020.140426�. �hal-02935808�
Impact of lockdown measures to combat Covid-19 on air quality over
western Europe
Laurent Menut
a,⁎
, Bertrand Bessagnet
a,b, Guillaume Siour
c, Sylvain Mailler
a,
Romain Pennel
a, Arineh Cholakian
aa
Laboratoire de Météorologie Dynamique (LMD), Ecole Polytechnique, IPSL Research University, Ecole Normale Supérieure, Université Paris-Saclay, Sorbonne Universités, UPMC Univ Paris 06, CNRS, Route de Saclay, 91128 Palaiseau, France
b
Now at Citepa, Technical Reference Center for Air Pollution and Climate Change, 42, rue de Paradis, 75010 Paris, France
c
Laboratoire Interuniversitaire des Systèmes Atmosphériques (LISA), UMR CNRS 7583, Université Paris Est Créteil et Université de Paris, Institut Pierre Simon Laplace, Créteil, France
H I G H L I G H T S
• Air pollution modelling • COVID19 epidemy • Regional modelling
• Anthropogenic emissions scenario • Impact of emissions reduction
G R A P H I C A L A B S T R A C T
a b s t r a c t
a r t i c l e i n f o
Article history: Received 10 May 2020
Received in revised form 19 June 2020 Accepted 20 June 2020
Available online 23 June 2020 Keywords: COVID-19 Lockdown Chemistry-transport modelling Emissions scenario CHIMERE
Recent studies based on observations have shown the impact of lockdown measures taken in various European countries to contain the Covid-19 pandemic on air quality. However, these studies are often limited to compare situations without and with lockdown measures, which correspond to different time periods and then under dif-ferent meteorological conditions. We propose a modelling study with the WRF-CHIMERE modelling suite for March 2020, an approach allowing to compare atmospheric composition with and without lockdown measures without the biases of meteorological conditions. This study shows that the lockdown effect on atmospheric com-position, in particular through massive traffic reductions, has been important for several short-lived atmospheric trace species, with a large reduction in NO2concentrations, a lower reduction in Particulate Matter (PM)
concen-trations and a mitigated effect on ozone concenconcen-trations due to non-linear chemical effects.
© 2020 The Authors. Published by Elsevier B.V. This is an open access article under the CC BY-NC-ND license (http:// creativecommons.org/licenses/by-nc-nd/4.0/).
1. Introduction
The Covid-19 pandemic outbreak has largely impacted the whole world with impressive sanitary and economic consequences, (Muhammad et al., 2020). One of the consequences is the establishment
of unprecedented lockdown and restrictions measures in a large num-ber of countries. Travel restrictions and the obligation to remain in our residence homes to limit the spread of the virus are expected to largely modify anthropogenic emissions of pollutants, both in terms of emitted mass and time variations. The change of these emissions is expected to modify surface pollutants concentrations observed in Europe. This has been observed since the beginning of the lockdown in particular through the analysis of measurements from air quality monitoring
⁎ Corresponding author.
E-mail address:[email protected](L. Menut).
https://doi.org/10.1016/j.scitotenv.2020.140426
0048-9697/© 2020 The Authors. Published by Elsevier B.V. This is an open access article under the CC BY-NC-ND license (http://creativecommons.org/licenses/by-nc-nd/4.0/).
Contents lists available atScienceDirect
Science of the Total Environment
j o u r n a l h o m e p a g e :w w w . e l s e v i e r . c o m / l o c a t e / s c i t o t e n vnetworks and satellites. In january 2020, and in China, where the pan-demic starts,Shi and Brasseur (2020)analyzed surface measurements data and show that the lockdown (and the probable variability of mete-orology) reduced by 35% and 60% the surface concentrations of PM2.5
and NO2, respectively. For ozone, we found an increase by a factor 1.5.
Using surface measurements, on the Barcelona region (Spain), (Tobias et al., 2020) noted a decrease of−45 to −51% for BC (Black Carbon) and NO2,−28 to −31% for PM10. They also noted an increase for
ozone, +33% to +57% for the daily maxima. Focusing on Spain,
Petetin et al. (2020)are using surface observations and machine learn-ing to retrieve the usual NO2if lockdown conditions would have not
been present. They found on average that the lockdown measures are responsible of 50% of the observed NO2decrease. Similar results with
sometimes an increase of Ozone concentrations are observed in Milan as reported byCollivignarelli et al. (2020). The impact of the virus was also evaluated by using satellite data such as NO2retrievals using the
TROPOMI and OMI observations inBauwens et al. (2020). They showed a significant decrease of −20% to −38% in western Europe of NO2
tropo-spheric column concentrations.
However, these observed changes correspond to a budget and inte-grate several possible factors: (i) a different meteorology from previous comparison period or years, (ii) a year to year decrease in anthropo-genic emissions in Western Europe and (iii) the current lockdown mea-sures to combat the Covid-19 virus. In order to calculate the relative part due to lockdown measures only, a modelling system must be used to as-sess a change of anthropogenic emissions. For this purpose, a scenario of anthropogenic emissions have been developed and tested taking into account emission reductions calculated by country and activity sectors. Studies of this type are beginning to be published. For example, (Sharma et al., 2020) in India showed a decrease in PM2.5and PM10
concentra-tions up to respectiveley 43 and 31% and an increase of 17% ozone con-centrations from 16 March to 14 April 2020 confirming the analysis based on observed datasets.
For this study, the WRF-CHIMERE modelling system was used on a spatial domain covering Western Europe. An emission scenario was set up using Apple public data (https://www.apple.com/covid19/ mobility). Two simulations were carried out for the month of March 2020, (i) a reference simulation with‘business as usual’ emissions and (ii) the scenario reflecting the ‘reality’ of emission changes due to lock-down measures. The difference between both simulations makes it pos-sible to quantify the impact of the consequences of lockdown measures. The modelling system used is presented inSection 2.1and the emis-sions scenario inSection 2.2. The results are presented and discussed inSection 3. Conclusions are presented inSection 4.
2. Method
2.1. The modelling system
The WRF 3.7.1, (Skamarock et al., 2007), and CHIMERE models v2017r4 (Mailler et al., 2017) are used to simulate the hourly concentra-tions of numerous pollutants over Western Europe. This modelling sys-tem was recently used for example in (Menut et al., 2019), (Bessagnet et al., 2020).
The WRF model is forced by the NCEP/GFS (Kalnay et al. (1996)) globalfields using spectral nudging, (Von Storch et al., 2000). This al-lows WRF to create its own structures within the boundary layer but being sure it follows the large scale meteorologicalfields. CHIMERE has been developed since 1997 and used for forecast and analysis since then,Vautard et al. (2000),Honoré et al. (2008),Rouïl et al. (2009),Menut and Bessagnet (2010),Menut et al. (2015b),Marécal et al. (2015). The model has been compared frequently to various kind of measurements (surface stations, soundings, airborne, satellite), in-cluding meteorology and chemistry,Menut et al. (2000),Menut et al. (2005a),Pirovano et al. (2007),Menut et al. (2015a),Bessagnet et al. (2016),Vivanco et al. (2017). The chemical mechanims for gaseous
species and aerosols are updated following the current knowledge in thefield,Bessagnet et al. (2010),Mailler et al. (2016),Couvidat et al. (2018),Cholakian et al. (2018). Regularly, a new version is proposed to the users and detailed in publication, such as inMenut et al. (2013)
andMailler et al. (2017)for the two last versions. If ozone and nitrogen oxides are model species representing exactly the real species, particu-late matter (PM) are model species composed of several aerosols. In this study, PM2.5and PM10represent the concentration of aerosols with
mean mass median diameter lower than 2.5 and 10μm respectively. They are composed of sulphate, nitrate, ammonium, primary organic matter (POM) and elemental carbon (EC), secondary organic aerosols (SOA), sea salt and mineral dust. These aerosols are represented by a di-ameter size distribution ranging from 10 nm to 40μm, with 10 bins. Even though the study is focused on anthropogenic emissions, CHIMERE also includes natural emissions to calculate realistic concen-trations of all considered gaseous and aerosols species. Biogenic emis-sions are calculated with the online MEGAN model,Guenther et al. (2006), mineral dust emissions are calculated using the scheme of
Alfaro and Gomes (2001)modified afterMenut et al. (2005b), sea-salt emissions with theMonahan (1986)scheme.
The simulation period covers the whole month of March 2020, with a spin-up 10-days period in February, from 20 to 29 February. Two hor-izontal domains are defined: MED60 and EUR20 with respectively Δx= 60 km andΔx=20 km as horizontal resolution. TheFig. 1represents the urban fraction of each cell on these domains. The MED60 domain is de-fined to take into account all anthropogenic and natural emissions around the Western Europe. A large part of North Africa up to the Mid-dle East is also covered to account for possible long range transport of gaseous species and particles. EUR20 is designed for the present analysis and used the simulation of MED60 as hourly boundary conditions. Only the simulation over EUR20 will be analyzed in this study.
For domain EUR20 domain, two simulations are performed, (i) a ref-erence simulation (REF) without lockdown measures using classical emissions and (ii) a simulation (CVD) taking into account an estimate of lockdown measures on pollutant emissions. Results are presented
Fig. 1. The two simulation domains used in this study. Colors indicate the percentage of ‘urban’ landuse in the grid cell.
for the month of March 2020. They represent the impact of anthropo-genic emission reductions due to containment measures and their suc-cessive implementation in most European countries. In this study, the MED60 simulation is performed one time with classical emissions with no lockdown impacts and used to drive the two simulations over the EUR20 domain: REF and CVD. The consequence of this choice is two-fold: (i) there is no impact of very long range transport of lockdown measures coming from areas outside the EUR20 domain, and (ii) possi-ble recirculation at the border of the EUR20 are not taken into account. Even if all results are not perfect, with biases, uncertainties, we can be confident with two important points for this study: (i) the model has the right orders of magnitude and space-time variability for all chemical species. This means that the transport is correct between sources and measurements, and also that the chemistry and deposition are correct throughout the transport of the species. (ii) as the model was validated in many different circumstances, it is known to react logically to an increase or decrease in emissions. One can therefore be confident in the results of the emissions scenarios in terms of the sign and magni-tude of the calculated differences.
2.2. The anthropogenic emissions scenario
The anthropogenic emissions for the MED60 domain are from the CAMS database (available at https://eccad3.sedoo.fr/#CAMS-GLOB-ANT,Granier et al. (2019)) for the available year 2019. For the EUR20 domain emissions are from the EMEP (European Monitoring and Evalu-ation Programme, (Mareckova et al., 2019)) database released in 2019 and available for year 2017. This dataset correponds to the most state-of-the-art and up-to-date dataset for anthropogenic emissions in Europe. For the reference simulation, REF, this dataset was used with the EMISURF pre-processing program, developed by the same group as the CHIMERE model. This program is able to read many differents for-mat of raw anthropogenic emissions to preparefiles with data projected on the CHIMERE grid, with onefields per week day for a given month and for the chemical species used for the simulation. Many details about this preparation program are presented inMenut et al. (2012)
andMailler et al. (2017).
Estimating emissions during the lockdown period, the CVD simula-tion, is the most challenging part of this study. Only anthropogenic emissions for EUR20 are changed to account for lockdown measures. The Apple company has provided a dataset as an estimate of“driving”, “transit” and “cycling” daily activities from 13 January 2020 for tens of countries in the world. This dataset is a compilation of anonymized and aggregated data retrieve from mobile Apple devices when users search map information.
Most of European countries are covered by this dataset. We use the “driving” dataset to estimate the reduction or increase of traffic activity base on a reference state. Because emission data in CHIMERE already ac-count for a weekly factor to distinguish emissions from Monday to Sun-day we have normalized for each available country the Apple dataset by dividing by the activity dataset of a“normal” day of week before the lockdown measures. We have selected the 7 days from Monday 13 to 20 January 2020 as the reference period for this weekdays adjustment process. The change of road traffic emissions in March 2020 is then cal-culated based on a change of“driving” activity from Apple data and is applied to the road traffic sector (SNAP 7) for all pollutants. During the lockdown period reduction from−50 to −80% are observed for many European countries, seeFig. 2. This daily reduction factor for the road traffic is called f7, a positive value stands for a reduction. Outside
the lockdown period this factor can be slightly positive or negative as it reflects the reality of day to day traffic variations but during the lock-down it remains largely negative. For instance in Spain are supposed to be 10 to 20% in the beginning of March compared to‘business-as-usual’ emissions, this characteristics is difficult to explain and could be due to unusual emissions due to pre-lockdown activities (e.g. change of resi-dence homes). It is noteworthy that in our study we do not distinguish
regional difference of lockdown measures in countries; for instance in Italy, the north part of the country adopted restriction measures earlier compared to the rest of the country.
For the other SNAP sectors (Selected Nomenclature for Air Pollu-tion), we use the factor f7to scale the emission change for the other
sec-tors applied to all pollutants. For the industrial secsec-tors (SNAP 3, 4, 5 and 6) a factor f7/2 is applied. We decided to not apply any reduction factors
for the Energy sector (SNAP 1) since any relevant data were not avail-able at the beginning of this study. The agricultural sector (SNAP 10) and the waste sector (SNAP 9) are supposed to be not affected by the lockdown measures. For the off-road sector (SNAP 8) a reduction of f7/
2 is applied mainly to account for a reduction of the aviation activity even if this sector at the national level is not dominant (e.g. less than 2% of NO2emissions during the Landing-Take-Off aircraft operations
of total NO2emissions in France).
Conversely, as people are asked to stay at home, an increase of the use of heating systems during this period has been observed. Some first estimates in France showed that an increase of 20% of emissions could be observed. Then, for each country a factor–f7/4 is applied for
the residential sector (SNAP 2), so that the more traffic emissions are re-duced the more residential emission increase. This formula caps the res-idential increase to +25%.
This method provides daily multiplication factors for each country and activity sectors. Application of these factors to the‘business as usual’ emissions that are used for the REF emission dataset allows to produce emissions for the CVD simulation that include the effect of lock-down measures.
2.3. Observations
This study focuses on air quality, then on the surface concentrations of pollutants. For the comparison of the modelling results to observa-tions, we thus prefer comparisons to in-situ measurements and as mea-sured for air quality calculations to have real concentrations values. The European Environment Agency (EEA,https://www.eea.europa.eu) pro-vides a full set of hourly data for several pollutants such as particulate matter PM2.5and PM10, ozone (O3) and nitrogen dioxide (NO2) for a
large number of stations in Western Europe. For the results presented in this study, we used only the background urban, rural and suburban stations, considering that the industrial and traffic has a spatial repre-sentativity too different to be compared to the model with its spatial resolution ofΔx = 20 km. The number of available stations is different for each pollutants and for the period of March 2020 we used the data from 1456 stations for NO2, 1443 for O3, 799 for PM10and 399 for PM2.5.
Fig. 2. Traffic reduction for several countries in Western Europe. This factor is normalized to reference days in January 2020.
3. Results
Results are presented as comparisons of simulations to surface mea-surements. The two simulations are REF (reference case) and CVD (with the lockdown scenario on emissions) and the pollutants are PM2.5,
PM10, O3and NO2. Results are presented under three different formats:
daily average time-series compared to measurement stations, daily av-erage percentage of changes in concentrations aggregated per countries and maps of differences.
3.1. Impact for selected sites
The following Figures show time-series of surface concentrations for three pollutants, NO2, O3and PM10. The stations were chosen because
they were spread all over Western Europe, they are characteristic of ‘background and rural’ environment (in line with a 20 km model reso-lution) and have, as much as possible, data for all three pollutants. The list of stations is presented inTable 1. This table lists the stations with their name, country, longitude (°), latitude (°) and altitude above sea level (m ASL).
For NO2,Fig. 3, it can be seen that all stations show surface
concen-trations values with higher measured concenconcen-trations than modelled. For this chemical species, this bias is normal and is due to the 20 km res-olution of the model. Even if the stations are of background and rural type, NO2remains a pollutant whose representativeness is spatially
lim-ited. Close to emission sources, this pollutant is mainly primary and rep-resents well the emission reductions related to lockdown. The differences between REF and CVD simulation show the start dates of the emission reductions as they have been put in the scenario. In Italy and the Netherlands, differences in concentrations can be seen from the beginning of March. In France, Spain and Portugal, the impact is vis-ible in mid March. For all stations, the impact varies from day to day and does not become constant at the end of the month. The most important differences can reach 10μg m−3as a daily average.
For ozone,Fig. 4, a secondary pollutant with a longer lifetime than NO2and greater long-range transport capacity, the impact is lower in
concentrations. Time series are presented for the same stations as NO2
to ease the comparisons. The model bias is lower in comparison with observations. The REF and CVD simulations also show fewer differences, with maximum values of the order of 5 to 10μg m−3. For several sites,
such as Vercelli, Chamforgueil and Fernando, higher ozone values are measured and modelled at the end of the month, between 20 and 25 March. At these sites, no particular increase or decrease in ozone con-centrations due to the lockdown is noted.
OnFig. 5, the differences between the REF and CVD simulations for PM10are, as for ozone, are quite small. Comparisons between
measure-ments and simulations are good and no particular bias is noted. As for ozone, there is a peak concentration between 24 and 29 March. This seems to correspond to a particulate episode over a large part of Europe since the stations of Spreewald, Kosetice, Illmitz, Vredepeel are
impacted. But the Fernando station in Portugal does not show this in-crease. For this station, we see on the contrary a significant peak of PM10on 18 March which is measured and well modelled, with
concen-trations of 60μg m−3. However, for this peak, there is no difference in
the scenarios, so it is probably a peak of natural origin. For all stations, the difference between the scenarios remains small and is of the order of a fewμg m−3.
3.2. Impact per countries
The time series inFig. 6represent the daily average percentages of reduction in pollutant concentrations (NO2, ozone and PM2.5) for
differ-ent European countries defined by the concentration ratio. Concentra-tions are represented separately for urban and rural areas in each country, using the landuse fractions (Fig. 1).
For NO2, a local pollutant, Germany and the Netherlands reach
con-centration reductions of−15 to −30%, while the other countries show concentration reductions in the range of−35 to −45% on average. This is in line with less strict or different lockdown measures in the northern countries somehow less strict. In all cases, the impacts are clearly visible in relation to the different starting dates lockdown by country, with Italy adopting measures as early as 1 March, France as early as 14 March, etc. For ozone, a pollutant that is more regional than local, the impact of lockdown on concentrations is much smaller, with a very slight de-crease observed in rural areas, whereas concentrations can significantly increase in urban areas due to the effect of chemical titration, which is cancelled out by the strong reductions in nitrogen oxide emissions. Ozone is in fact a so-called secondary air pollutant which is part of a chemical cycle of formation and destruction involving nitrogen oxides and volatile organic compounds.
For PM2.5, reductions in concentrations are weak, between−5 and
−10%. Emissions of primary particles from residential heating, which was still in use and certainly increasing in the second half of March, were able to partly offset the reductions of the formation of secondary particles usually resulting from the start of agricultural activity (fertil-izer spreading) at the end of winter. Emissions from the agricultural sec-tor were not reduced in these simulations. Ammonia emitted by the agricultural sector and nitrogen oxides emitted by the remaining sources (agriculture, industry, maritime traffic, other remaining trafic emissions, etc.) contribute to the formation of secondaryfine particulate matter.
Another way to express the results is presented inTable 2. In this case, the daily delta of concentrations (CVD-REF) is calculated for each country: over the whole month of March 2020, the maximum, in abso-lute values, is presented. Results are presented for NO2, PM2.5and O3.
Ozone is one of the most complicated chemical species in the atmo-sphere. It is a regionally sensitive secondary pollutant, so it is better mixed in the atmosphere compared to other locally sensitive species such as NOx. Its concentration can depend on several factors
simulta-neously: NOxavailability, rural/urban configuration of the area, VOC
availability and meteorological conditions ((Sillman et al., 2003), (Seinfeld and Pandis, 2006)). The ratio of VOC/NOxconcentration
de-cides the chemical regime affecting ozone production: High NOx
emis-sions mean a VOC-limited chemical regime, while large VOC emisemis-sions (depending on HOxavailability as well) mean the contrary ((Kwok
et al., 2015)). This means, simply put and in most cases, in urban areas where NOxemissions are dominant in normal meteorological
condi-tions a VOC-limited regime is seen, while in rural areas a NOx-limited
re-gime is observed. Therefore, when encountering a situation where NOx
emissions are decreasing significantly (like in CVD simulations in our study) an increase in ozone concentrations is expected in urban areas when we're in a VOC-limited chemical regime and a decrease is ex-pected in rural areas in a NOx-limited regime.Table 2shows the
maxi-mum changes for ozone on the national level differentiated for each country on the rural and urban, where the aforementioned behavior is partially seen, the inconsistencies can be explained by the fact that
Table 1
Names and locations of the EEA (European Environment Agency) stations used for model comparisons to surface concentrations. The stations are listed in alphabetical order. Longi-tude (°), latiLongi-tude (°) and altiLongi-tude above sea level (m ASL) is indicated for each station.
Site Country Longitude (°) Latitude (°) Altitude (m ASL) Champforgeuil France 4.83 46.82 185 ElsTorms Spain 0.73 41.39 470 Enzenkirchen Austria 13.67 48.39 525 Fernando Portugal −8.69 38.63 57 Illmitz Austria 16.76 47.77 117 Kosetice Czech Rep. 15.08 49.57 535 Spreewald Germany 14.05 51.89 52 Vercelli Italy 8.40 45.31 131 Vredepeel Netherlands 5.85 51.54 28
Fig. 3. Time-series of daily average surface concentrations of NO2(μg m−3). Stations are representative of several locations in Western Europe and are all classified by EEA as ‘background’
and‘rural’.
Fig. 4. Time-series of daily average surface concentrations of O3(μg m−3). Stations are representative of several locations in Western Europe and are all classified by EEA as ‘background’
and‘rural’.
Fig. 5. Time-series of daily average surface concentrations of PM10. Stations are representative of several locations in Western Europe and are all classified by EEA as ‘background’ and
ozone is usually regionally well-mixed therefore it does not show local signals that often (especially in lower horizontal resolutions). The con-centration of ozone in different chemical regimes has been explored in detail in models in many publications (e.g. (Beekmann and Vautard, 2010) and (Wilson et al., 2012) in case of the CHIMERE model).
For NO2, the daily delta is negative for all countries, ranging from
−13.0% (urban) and −9.7% (rural) for the lowest delta in Sweden to
−57.8% (urban) and −53.6% in Portugal. For PM2.5, the daily delta is
lower and may be negative of positive depending on the country. The largest negative change is−23.5% (urban) and −13.0% (rural) in Portugal when the largest positive change is +4.0 (urban) but−4.6% in Poland. This positive change is the only one in Europe. For ozone, the daily delta oscillates between negative and positive values, but changes are not important. The variability is from−2.7% (urban) and −2.34% (rural) in Ireland to +17.6% (urban) and +6.6% (rural) in Belgium. It is noteworthy that the neighbouring country, The Netherlands, also has one of the highest increase in urban areas for ozone. For all countries and for ozone, the daily delta maxima are often between ±0 to 5%. Changes are the most important for NO2
with percentages between−10% to −40% in urban areas, where the major part of emissions are reduced in the CVD emissions inventory. 3.3. The specific episode of 28 March 2020
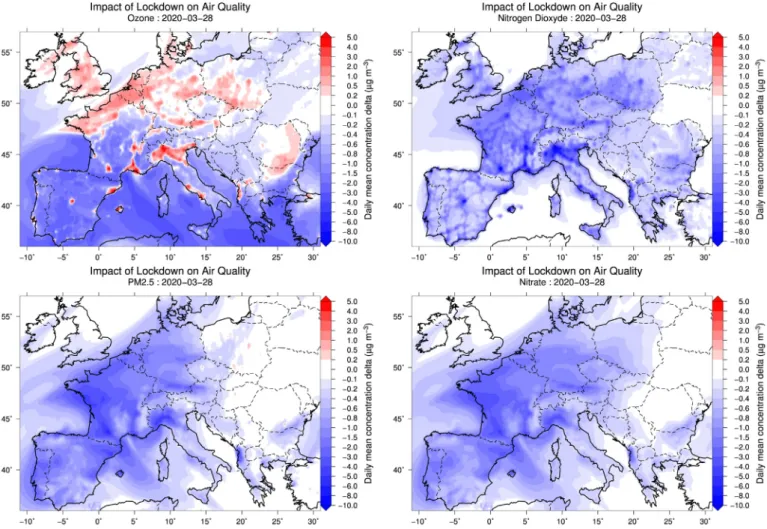
From 23 to 28 March 2020, a pollution episode with large concentra-tions of particular matter has been observed in several countries includ-ing France (Fig. 5). For France, reports from operational forecasters have indicated that this pollution peak was essentially due to two factors: strong emissions from residential heating, with an important contribu-tion of wood burning, and inputs of fertilizers on the crops.Fig. 7shows the effect of lockdown measures on the main pollutants for 28 March 2020. As expected due to the massive reduction in traffic emissions, ni-trogen dioxide concentrations were largely impacted by containment measures with average decreases of 5 to 10μg m−3in urban areas.
Ozone is positively affected by lockdown measures urban areas but neg-atively in rural areas, as we have also observed at national level (Fig. 6). Regarding particular matter, which were the cause of poor air quality during these days, the decrease due to lockdown is only modest, and ex-plained essentially by a negative impact of lockdown on nitrate concen-trations. No particular impact of lockdown on agricultural activities has been reported and fertilizer input onto the cultivatedfields has been performed as usual by the farmers. As nitrates being a product of NO2
oxidation, this reduced contribution of nitrate to the PM peak in the days preceding can be explained as a consequence of reduce emissions of nitrogen dioxide from traffic. This brief episode was also marked by
Fig. 6. Time-series of daily percentage of reduction (CVD-REF) calculated for each country (urban and rural areas) and three pollutants: PM2.5, NO2and O3. Results are presented for the
whole month of March 2020 and for Great Britain, Netherlands, Germany, Spain, France and Italy.
Table 2
Maximum daily delta (CVD-REF) of concentrations (%) reached in March 2020 for the main European countries within the domain. A negative value is for a reduction of concen-tration, a positive value is for an increase of concentration. Note that“BosniaHzgv” stands for“Bosnia and Herzegovina”, “UnitedKgd” for “United Kingdom”.
Country NO2 PM2.5 O3
Urban Rural Urban Rural Urban Rural Austria −37.1 −37.8 −10.3 −11.2 +6.4 +0.64 Belgium −34.8 −33.6 −13.4 −15.7 +17.6 +6.60 Bosnia Hzgv −43.2 −16.2 −5.8 −4.1 −1.5 −2.17 Bulgaria −38.5 −33.4 −5.3 −4.8 −2.1 −2.45 Croatia −37.5 −23.1 −11.6 −6.6 −1.5 −1.65 Czech Rep. −18.1 −21.6 −5.7 −8.5 +1.2 +0.63 Denmark −19.8 −13.6 −6.3 −6.7 +1.5 +0.27 France −43.2 −43.8 −18.0 −17.0 +6.7 +0.72 Germany −29.5 −25.4 −11.7 −12.7 +4.5 +0.73 Greece −44.6 −27.2 −11.0 −4.6 +5.2 −2.37 Hungary −22.6 −24.8 −4.7 −7.1 −0.7 −1.60 Italy −44.0 −44.4 −20.5 −17.8 +5.8 −0.08 Ireland −37.3 −29.5 −11.1 −11.7 −2.7 −2.34 Lithuania −26.5 −24.5 −4.9 −4.9 +0.8 +0.04 Netherlands −22.6 −16.3 −10.4 −10.3 +8.2 +5.41 Norway −24.0 −20.4 −6.7 −6.5 +1.3 +0.07 Poland −27.0 −25.6 +4.0 −4.6 +3.7 +0.65 Portugal −57.8 −53.6 −23.5 −13.0 +8.1 −2.39 Romania −28.6 −29.4 −4.8 −4.8 −1.6 −1.82 Russia −25.4 −17.6 −10.0 −2.5 +1.6 +0.04 Serbia −26.7 −19.3 −5.9 −2.4 −1.7 −2.37 Slovakia −23.8 −23.8 −8.3 −7.6 −0.9 −1.38 Slovenia −40.7 −29.1 −18.4 −16.3 +2.1 −1.52 Spain −48.8 −46.8 −13.8 −14.5 +4.4 −2.04 Sweden −13.0 −9.7 −5.4 −5.5 +0.7 +0.01 Switzerland −31.4 −33.0 −18.0 −22.0 +1.8 +0.50 United Kgd −38.1 −29.8 −15.0 −14.0 +5.1 +1.06
the appearance of larger terrigenous mineral particles captured by the model (not shown here), the origin of which is still to be clarified. How-ever, a possible outbreak of mineral dust from Ukraine or the south of Russia or even Kazaghstan could be the reason as it has already ob-served in 2007 in such strong easterly air massfluxes (Bessagnet et al., 2008).
3.4. Statistical scores over Europe
In order to summarize all results, statistical scores are calculated using all stations over the modelled domain. Results are presented in
Table 3.
The NO2scores show that the closer to reality scenario simulation,
CVD, does not improve the RMSE and the bias: the bias goes from −14.43 to −17.63 μg m−3for‘all’ stations. On the other hand, there is
a improvement of time correlation, from 0.36 to 0.43 for‘all’. This is due to the reduction of emissions for some activity sectors only and therefore a change in the monthly profile of emissions. We therefore have a correlation closer to reality. The biggest improvement is logically in urban areas, from 0.37 to 0.44, where these emissions are the most important and where the scenario has the largest effect.
For ozone, the bias is reduced for all areas: rural, suburban and urban. But the correlation is less good (from 0.29 to 0.26 for all stations). The RMSE is higher but the difference is not significant: from 15.52 to 15.59μg m−3for‘all’. However, the bias decreases, from 2.59 to
2.21 μg m−3 for all stations and, more particularly, from 0.31 to
−0.07 μg m−3in rural areas.
For PM, the behavior of the model is similar for PM2.5and PM10. The
correlation is good for both simulations and the different environments.
Fig. 7. Maps of differences (CVD-REF) of daily average surface concentrations (μg m−3) for the 28 March 2020 and for ozone, nitrogen oxide, PM
2.5and PM10.
Table 3
Statistical scores calculated by comparison between surface observations for several sta-tions in Europe and the corresponding model daily mean value, for the simulasta-tions REF and CVD. RMSE and bias are inμg m−3and Pearson's temporal correlation between−1
and 1. Statistical scores are presented for NO2, O3, PM2.5and PM10.
REF CVD
RMSE Bias Rt RMSE Bias Rt
NO2 All 20.77 −14.43 0.37 22.35 −17.63 0.43 Rural 8.16 −3.68 0.35 8.74 −5.10 0.37 Suburban 20.86 −14.06 0.37 22.10 −17.20 0.44 Urban 25.96 −20.53 0.38 27.92 −23.42 0.46 O3 All 15.53 2.59 0.29 15.59 2.21 0.26 Rural 14.96 0.31 0.25 15.16 −0.07 0.23 Suburban 15.52 2.65 0.28 15.67 2.31 0.25 Urban 15.89 4.01 0.31 16.07 3.66 0.28 PM25 All 6.31 −0.24 0.70 6.34 −0.77 0.70 Rural 5.97 1.27 0.70 5.74 0.80 0.70 Suburban 7.66 0.65 0.68 7.18 0.02 0.66 Urban 6.21 −1.36 0.70 6.41 −2.08 0.71 PM10 All 9.50 −5.47 0.69 9.89 −6.07 0.69 Rural 8.37 −3.46 0.67 8.39 −4.20 0.67 Suburban 10.08 −5.19 0.67 10.48 −5.88 0.68 Urban 9.68 −6.28 0.71 10.27 −7.02 0.71
There is no significant change between REF and CVD. For PM2.5, we note
a degradation of the bias for all stations, from−0.24 μg m−3to−0.77 μg
m−3, and this is particularly true in urbanized environment with an in-crease of the bias from−1.36 to −2.08 μg m−3.
4. Conclusions
Thisfirst modelling work in Europe provides a rigorous framework for studying the effects of containment on air quality by avoiding mete-orological biases (comparison here over identical periods) and biases intrinsic to the model (when focussing on the analysis of differences). Our results given at a resolution of 20 km show decreases in NO2
con-centrations ranging from−30% to −50% in all western Europe coun-tries. Ozone concentrations have been differently affected in urban areas throughout Western Europe by lockdown measures with increase of concentrations. The effect onfine particle concentrations has been less pronounced than on NO2(−5 to −15%). This can be explained by
the fact that traffic is not the sole source of fine particles. Particularly during this season, residential heating emissions, which are a very sub-stantial contributor to PM concentrations in western Europe is sup-posed to increase by lockdown measures since European citizens have been instructed to stay at home as much as possible. Also, agricultural emissions due to fertilizer spreading is known to be a strong source of ammonium nitrate in western European countries in late winter and early springtime, they have not been affected by lockdown measures. These preliminary results are encouraging and in agreement with stud-ies based on comparisons with satellite and station measurements. Fur-ther analyses will have to be carried out to better understand the weight of sectors in these modelled differences. A refinement of assumptions on emissions adjustment due to the lockdown measures will be neces-sary to improve results robustness.
CRediT authorship contribution statement
Laurent Menut: Conceptualization, Methodology, Writing - original draft, Formal analysis. Bertrand Bessagnet: Conceptualization, Method-ology, Writing - original draft, Formal analysis. Guillaume Siour: Con-ceptualization, Methodology, Writing - original draft, Formal analysis. Sylvain Mailler: Conceptualization, Methodology, Writing - original draft, Formal analysis. Romain Pennel: Conceptualization, Methodol-ogy, Writing - original draft, Formal analysis. Arineh Cholakian: Con-ceptualization, Methodology, Writing - original draft, Formal analysis.
Declaration of competing interest
The authors declare that they have no known competingfinancial interests or personal relationships that could have appeared to in flu-ence the work reported in this paper.
Acknowledgements
This work was performed using resources from GENCI-TGCC (Grant A0070110274). Meteorological simulations were performed by forcing WRF with NCEP modelfields, (NCAR/UCAR, 2000). The authors are grateful to the EEA (European Environmental Agency) for maintaining and providing the surface concentrations of criteria pollutants over Europe.
References
Alfaro, S.C., Gomes, L., 2001.Modeling mineral aerosol production by wind erosion: emis-sion intensities and aerosol size distribution in source areas. J. Geophys. Res. 106 (18) (075–18, 084).
Bauwens, M., Compernolle, S., Stavrakou, T., Muller, J.F., van Gent, J., Eskes, H., Levelt, P.F., Van Der, A.R., Veefkind, J.P., Vlietinck, J., Yu, H., Zehner, C., 2020. Impact of coronavirus
outbreak on no2 pollution assessed using tropomi and omi observations. Geophys. Res. Lett. 47, e2020GL087978.https://doi.org/10.1029/2020GL087978.
Beekmann, M., Vautard, R., 2010. A modelling study of photochemical regimes over Europe: robustness and variability. Atmos. Chem. Phys. 10, 10067–10084.https:// doi.org/10.5194/acp-10-10067-2010.
Bessagnet, B., Menut, L., Aymoz, G., Chepfer, H., Vautard, R., 2008. Modelling dust emis-sions and transport within Europe: the Ukraine March 2007 event. J. Geophys. Res. 113, D15202.https://doi.org/10.1029/2007JD009541.
Bessagnet, B., Seigneur, C., Menut, L., 2010. Impact of dry deposition of semi-volatile or-ganic compounds on secondary oror-ganic aerosols. Atmos. Environ. 44, 1781–1787.
https://doi.org/10.1016/j.atmosenv.2010.01.027.
Bessagnet, B., Pirovano, G., Mircea, M., Cuvelier, C., Aulinger, A., Calori, G., Ciarelli, G., Manders, A., Stern, R., Tsyro, S., García Vivanco, M., Thunis, P., Pay, M.T., Colette, A., Couvidat, F., Meleux, F., Rouïl, L., Ung, A., Aksoyoglu, S., Baldasano, J.M., Bieser, J., Briganti, G., Cappelletti, A., D’Isidoro, M., Finardi, S., Kranenburg, R., Silibello, C., Carnevale, C., Aas, W., Dupont, J.C., Fagerli, H., Gonzalez, L., Menut, L., Prévôt, A., Roberts, P., White, L., 2016. Presentation of the EURODELTA III intercomparison exer-cise - evaluation of the chemistry transport models’ performance on criteria pollut-ants and joint analysis with meteorology. Atmos. Chem. Phys. 16, 12667–12701.
https://doi.org/10.5194/acp-16-12667-2016.
Bessagnet, B., Menut, L., Lapere, R., Couvidat, F., Jaffrezo, J.L., Mailler, S., Favez, O., Pennel, R., Siour, G., 2020. High resolution chemistry transport modeling with the on-line CHIMERE-WRF model over the French Alps-analysis of a feedback of surface particu-late matter concentrations on mountainous meteorology. Atmosphere 11.https://doi. org/10.3390/atmos11060565.
Cholakian, A., Beekmann, M., Colette, A., Coll, I., Siour, G., Sciare, J., Marchand, N., Couvidat, F., Pey, J., Gros, V., Sauvage, S., Michoud, V., Sellegri, K., Colomb, A., Sartelet, K., Langley DeWitt, H., Elser, M., Prévot, A.S.H., Szidat, S., Dulac, F., 2018.Simulation offine or-ganic aerosols in the western Mediterranean area during the ChArMEx 2013 summer campaign. Atmos. Chem. Phys. 18, 7287–7312.
Collivignarelli, M.C., Abba, A., Bertanza, G., Pedrazzani, R., Ricciardi, P., Miino, M.C., 2020. Lockdown for CoViD-2019 in Milan: what are the effects on air quality? Sci. Total En-viron., 139280https://doi.org/10.1016/j.scitotenv.2020.139280.
Couvidat, F., Bessagnet, B., Garcia-Vivanco, M., Real, E., Menut, L., Colette, A., 2018. Devel-opment of an inorganic and organic aerosol model (CHIMERE 2017β v1.0): seasonal and spatial evaluation over Europe. Geosci. Model Dev. 11, 165–194.https://doi.org/ 10.5194/gmd-11-165-2018.
Granier, C., Darras, S., van der Gon, H.D., Doubalova, J., Elguindi, N., Galle, B., Gauss, M., Guevara, M., Jalkanen, J.P., Kuenen, J., Liousse, C., Quack, B., Simpson, D., Sindelarova, K., 2019. The Copernicus atmosphere monitoring service global and re-gional emissions (April 2019 version). Copernicus https://doi.org/10.24380/d0bn-kx16.
Guenther, A., Karl, T., Harley, P., Wiedinmyer, C., Palmer, P., Geron, C., 2006.Estimates of global terrestrial isoprene emissions using MEGAN (model of emissions of gases and aerosols from nature). Atmos. Chem. Phys. 6, 3181–3210.
Honoré, C., Rouïl, L., Vautard, R., Beekmann, M., Bessagnet, B., Dufour, A., Elichegaray, C., Flaud, J., Malherbe, L., Meleux, F., Menut, L., Martin, D., Peuch, A., Peuch, V., Poisson, N., 2008. Predictability of European air quality: the assessment of three years of oper-ational forecasts and analyses by the PREV’AIR system. J. Geophys. Res. 113, D04301.
https://doi.org/10.1029/2007JD008761.
Kalnay, E., Kanamitsu, M., Kistler, R., Collins, W., Deaven, D., Gandin, L., Iredell, M., Saha, S., White, G., Woollen, J., Zhu, Y., Chelliah, M., Ebisuzaki, W., Higgins, W., Janowiak, J., Mo, K., Ropelewski, C., Wang, J., Leetmaa, A., Reynolds, R., Jenne, R., Joseph, D., 1996. The NCEP/NCAR 40-year reanalysis project. Bull. Am. Meteorol. Soc., 437–471https:// doi.org/10.1175/1520-0477(1996)077.
Kwok, R.H.F., Baker, K.R., Napelenok, S.L., Tonnesen, G.S., 2015. Photochemical grid model implementation and application of VOC, NOx, and O3source apportionment. Geosci.
Model Dev. 8, 99–114.https://doi.org/10.5194/gmd-8-99-2015.
Mailler, S., Menut, L., di Sarra, A.G., Becagli, S., Di Iorio, T., Bessagnet, B., Briant, R., Formenti, P., Doussin, J.F., Gómez-Amo, J.L., Mallet, M., Rea, G., Siour, G., Sferlazzo, D.M., Traversi, R., Udisti, R., Turquety, S., 2016. On the radiative impact of aerosols on photolysis rates: comparison of simulations and observations in the lampedusa is-land during the charmex/adrimed campaign. Atmos. Chem. Phys. 16, 1219–1244.
https://doi.org/10.5194/acp-16-1219-2016.
Mailler, S., Menut, L., Khvorostyanov, D., Valari, M., Couvidat, F., Siour, G., Turquety, S., Briant, R., Tuccella, P., Bessagnet, B., Colette, A., Létinois, L., Markakis, K., Meleux, F., 2017. CHIMERE-2017: from urban to hemispheric chemistry-transport modeling. Geosci. Model Dev. 10, 2397–2423.https://doi.org/10.5194/gmd-10-2397-2017. Marécal, V., Peuch, V.H., Andersson, C., Andersson, S., Arteta, J., Beekmann, M.,
Benedictow, A., Bergström, R., Bessagnet, B., Cansado, A., Chéroux, F., Colette, A., Coman, A., Curier, R.L., Denier van der Gon, H.A.C., Drouin, A., Elbern, H., Emili, E., Engelen, R.J., Eskes, H.J., Foret, G., Friese, E., Gauss, M., Giannaros, C., Guth, J., Joly, M., Jaumouillé, E., Josse, B., Kadygrov, N., Kaiser, J.W., Krajsek, K., Kuenen, J., Kumar, U., Liora, N., Lopez, E., Malherbe, L., Martinez, I., Melas, D., Meleux, F., Menut, L., Moinat, P., Morales, T., Parmentier, J., Piacentini, A., Plu, M., Poupkou, A., Queguiner, S., Robertson, L., Rouïl, L., Schaap, M., Segers, A., Sofiev, M., Tarasson, L., Thomas, M., Timmermans, R., Valdebenito, A., van Velthoven, P., van Versendaal, R., Vira, J., Ung, A., 2015. A regional air quality forecasting system over Europe: the MACC-II daily en-semble production. Geosci. Model Dev. 8, 2777–2813. doi:https://doi.org/10.5194/ gmd-8-2777-2015.
Mareckova, K., Pinterits, M., Ullrich, B., Wankmueller, R., Gaisbauer, S., 2019.EMEP Inven-tory Review 2019 Review of Emission Data Reported under the LRTAP Convention and NEC Directive. European Environment Agency and CEIP, p. 54.
Menut, L., Bessagnet, B., 2010.Atmospheric composition forecasting in Europe. Ann. Geophys. 28, 61–74.
Menut, L., Vautard, R., Flamant, C., Abonnel, C., Beekmann, M., Chazette, P., Flamant, P., Gombert, D., Guédalia, D., Lefebvre, M., Lossec .D.,.M., B., Mégie, G., Perros, P., Sicard, M., Toupance, G., 2000.Measurements and modelling of atmospheric pollution over the Paris area: an overview of the ESQUIF project. Ann. Geophys. 18, 1467–1481.
Menut, L., Coll, I., Cautenet, S., 2005a.Impact of meteorological data resolution on the forecasted ozone concentrations during the ESCOMPTE IOP 2a and 2b. Atmos. Res. 74, 139–159.
Menut, L., Schmechtig, C., Marticorena, B., 2005b.Sensitivity of the sandblastingfluxes calculations to the soil size distribution accuracy. J. Atmos. Ocean. Technol. 22, 1875–1884.
Menut, L., Goussebaile, A., Bessagnet, B., Khvorostiyanov, D., Ung, A., 2012. Impact of real-istic hourly emissions profiles on modelled air pollutants concentrations. Atmos. En-viron. 49, 233–244.https://doi.org/10.1016/j.atmosenv.2011.11.057.
Menut, L., Bessagnet, B., Khvorostyanov, D., Beekmann, M., Blond, N., Colette, A., Coll, I., Curci, G., Foret, F., Hodzic, A., Mailler, S., Meleux, F., Monge, J., Pison, I., Siour, G., Turquety, S., Valari, M., Vautard, R., Vivanco, M., 2013. CHIMERE 2013: a model for re-gional atmospheric composition modelling. Geosci. Model Dev. 6, 981–1028.https:// doi.org/10.5194/gmd-6-981-2013.
Menut, L., Mailler, S., Siour, G., Bessagnet, B., Turquety, S., Rea, G., Briant, R., Mallet, M., Sciare, J., Formenti, P., Meleux, F., 2015a. Ozone and aerosol tropospheric concentra-tions variability analyzed using the ADRIMED measurements and the WRF and CHIMERE models. Atmos. Chem. Phys. 15, 6159–6182. https://doi.org/10.5194/acp-15-6159-2015.
Menut, L., Rea, G., Mailler, S., Khvorostyanov, D., Turquety, S., 2015b. Aerosol forecast over the Mediterranean area during July 2013 (ADRIMED/CHARMEX). Atmos. Chem. Phys. 15, 7897–7911.https://doi.org/10.5194/acp-15-7897-2015.
Menut, L., Tuccella, P., Flamant, C., Deroubaix, A., Gaetani, M., 2019. The role of aerosol– radiation–cloud interactions in linking anthropogenic pollution over southern West Africa and dust emission over the Sahara. Atmos. Chem. Phys. 19, 14657–14676.
https://doi.org/10.5194/acp-19-14657-2019.
Monahan, E.C., 1986.In the Role of Air-Sea Exchange in Geochemical Cycling. Kluwer Ac-ademic Publishers, Dordrecht, Holland, pp. 129–163 chapter The ocean as a source of atmospheric particles.
Muhammad, S., Long, X., Salman, M., 2020. COVID-19 pandemic and environmental pol-lution: a blessing in disguise? Sci. Total Environ. 728, 138820.https://doi.org/ 10.1016/j.scitotenv.2020.138820.
NCAR/UCAR, 2000. NCEP FNL Operational Model Global Tropospheric Analyses, Continu-ing from July 1999, Research Data Archive at the National Center for Atmospheric Re-search. Computational and Information Systems Laboratoryhttps://doi.org/10.5065/ D6M043C6.
Petetin, H., Bowdalo, D., Soret, A., Guevara, M., Jorba, O., Serradell, K., Pérez García-Pando, C., 2020. Meteorology-normalized impact of COVID-19 lockdown upon NO2pollution
in Spain. Atmospheric Chemistry and Physics Discussions 2020, 1–29.https://doi.org/ 10.5194/acp-2020-446.
Pirovano, G., Coll, I., Bedogni, M., Alessandrini, S., Costa, M., Gabusi, V., Lasry, F., Menut, L., Vautard, R., 2007.On the influence of meteorological input on photochemical model-ling of a severe episode over a coastal area. Atmos. Environ. 41, 6445–6464.
Rouïl, L., Honoré, C., Vautard, R., Beekmann, M., Bessagnet, B., Malherbe, L., Meleux, F., Dufour, A., Elichegaray, C., Flaud, J., Menut, L., Martin, D., Peuch, A., Peuch, V., Poisson, N., 2009. PREV’AIR: an operational forecasting and mapping system for air quality in Europe. BAMS 90, 73–83.https://doi.org/10.1175/2008BAMS2390.1. Seinfeld, J., Pandis, S., 2006.Atmospheric Chemistry and Physics: From Air Pollution to
Cli-mate Change. 2nd edition. Wiley-Interscience, Hoboken.
Sharma, S., Zhang, M., Anshika, Gao, J., Zhang, H., Kota, S.H., 2020. Effect of restricted emis-sions during COVID-19 on air quality in India. Sci. Total Environ. 728, 138878.https:// doi.org/10.1016/j.scitotenv.2020.138878.
Shi, X., Brasseur, G.P., 2020. The response in air quality to the reduction of chinese eco-nomic activities during the covid-19 outbreak. Geophys. Res. Lett. 47, e2020GL088070.https://doi.org/10.1029/2020GL088070.
Sillman, S., Vautard, R., Menut, L., Kley, D., 2003.O3-NOx-VOC sensitivity indicators in Paris: results from models and ESQUIF measurements. J. Geophys. Res. 108.
Skamarock, W., Klemp, J., Dudhia, J., Gill, D., Barker, D., Wang, W., Powers, J., 2007.A de-scription of the advanced research wrf version 2. NCAR Technical Note, Boulder, Col-orado, USA, NCAR/TN–468+STR.
Tobias, A., Carnerero, C., Reche, C., Massagué, J., Via, M., Minguillon, M.C., Alastuey, A., Querol, X., 2020. Changes in air quality during the lockdown in Barcelona (Spain) one month into the SARS-CoV-2 epidemic. Sci. Total Environ. 726, 138540.https:// doi.org/10.1016/j.scitotenv.2020.138540.
Vautard, R., Beekmann, M., Menut, L., 2000.Applications of adjoint modelling in atmo-spheric chemistry: sensitivity and inverse modelling. Environ. Model. Softw. 15, 703–709.
Vivanco, M., Bessagnet, B., Cuvelier, C., Theobald, M., Tsyro, S., Pirovano, G., Aulinger, A., Bieser, J., Calori, G., Ciarelli, G., Manders, A., Mircea, M., Aksoyoglu, S., Briganti, G., Cappelletti, A., Colette, A., Couvidat, F., D’Isidoro, M., Kranenburg, R., Meleux, F., Menut, L., Pay, M., Rouil, L., Silibello, C., Thunis, P., Ung, A., 2017. Joint analysis of de-positionfluxes and atmospheric concentrations of inorganic nitrogen and sulphur compounds predicted by six chemistry transport models in the frame of the EURODELTAIII project. Atmos. Environ. 151, 152–175.https://doi.org/10.1016/j. atmosenv.2016.11.042.
Von Storch, H., Langenberg, H., Feser, F., 2000.A spectral nudging technique for dynamical downscaling purposes. Mon. Weather Rev. 128, 3664–3673.
Wilson, R.C., Fleming, Z.L., Monks, P.S., Clain, G., Henne, S., Konovalov, I.B., Szopa, S., Menut, L., 2012.Have primary emission reduction measures reduced ozone across Europe? An analysis of European rural background ozone trends 1996-2005. Atmos. Chem. Phys. 12, 437–454.