THE EFFECT OF PROTOZOAN GRAZERS ON THE CYCLING OF POLYCHLORINATED BIPHENYLS (PCBs) IN MARINE SYSTEMS
By
Elizabeth Belle Kujawinski
S.B., Massachusetts Institute of Technology, 1994
Submitted in partial fulfillment of the requirements for the degree of DOCTOR OF PHILOSOPHY
at the
MASSACHUSETTS INSTITUTE OF TECHNOLOGY and the
WOODS HOLE OCEANOGRAPHIC INSTITUTION February 2000
© 2000 Elizabeth B. Kujawinski All rights reserved.
The author hereby grants to MIT and WHOI permission to reproduce paper and electronic copies of this thesis in whole or in part and to distribute them publicly.
Signature of Author c.
'7t11 I Joint Program in Oceanography Massachusetts Institute of Technology and Woods Hole Oceanographic Institution
___<_7 February 2000 Certified by
John
W ringto
-Co-thesis supervi - K James W. Moffett Co-thesis supervisor Accepted byI
I--Chair, Joint MASSACHUSETTS INST OF TECHNOLOGY OCT 2 2 2004 Margaret Tivey Committee for Chemical Oceanography Massachusetts Institute of Technology/ Woods Hole Oceanographic Institutionrr0'rE
ARCHIVES
i~~~~~~~~~~
Thesis Abstract
Processes affecting organic carbon distribution and composition can control the speciation of organic contaminants such as polychlorinated biphenyls (PCBs) and
ultimately determine their residence time in a particular environment. In marine systems, the microbial loop influences organic carbon dynamics by recycling a significant fraction of dissolved and particulate organic matter. The goal of this thesis was to understand how these recycling processes affect chlorobiphenyl (CB) cycling in marine systems by monitoring CB dynamics among organic carbon pools represented by dissolved organic matter, bacterial prey and phagotrophic protozoan grazers.
Initially, I studied the extent to which a protozoan grazer (Uronema sp. - 0lpm ciliate) equilibrated with aqueous PCBs within 2-3 hours. Initial calculations predicted rapid equilibration via passive diffusion. Experimentally, no difference in equilibration time was noted between grazing and non-grazing protozoa, indicating that diffusion was the primary uptake pathway for these organisms. The results were extended to determine the transition size of an organism where the rates of diffusive and ingested uptake are
equivalent (100-500gpm). Disassociation rate constants were estimated for complexes of CB congeners and dissolved organic carbon (DOC). CB-DOC complexes enhanced the diffusive uptake rate constant for Tenax resin and, by inference, protozoan grazers.
In the second phase of this work, concentrations of surfactants, organic carbon and cells were monitored over time in protozoan cultures. The effects of bacterial growth substrate
and protozoan species were examined. Surfactants increased during protozoan
exponential growth while total DOC concentrations decreased. Production of surface-active material in ciliate cultures was significantly higher than in flagellate cultures, and all protozoan cultures were higher than the bacterial control.
Common headspace vessels were then used to compare and contrast the affinity of
protozoan and bacterial culture filtrates (<0.2ptm) for PCBs relative to a seawater control. Affinities were normalized to bulk DOC and surfactant concentrations to determine underlying relationships among these parameters. Values of equilibrium partition coefficients (Koc) ranged from 104.6 in Vineyard Sound seawater to 1054 and 105'5 in protist cultures, indicating that "grazer-enhanced" DOM was a better sorbent for PCBs than DOM in bacterial controls and Vineyard Sound seawater.
ACKNOWLEDGMENTS
Many thanks are due to the numerous individuals who have helped make the Joint Program an educational and challenging experience.
First and foremost, I'd like to thank both my advisors, Jim Moffett and John Farrington, for their support and generosity. Thanks to Jim for taking on a project so outside his expansive realm of expertise and having the patience to help me find the way to the end. Thanks to John who became a mentor and wonderful role model through great
discussions, moments of inspiration and supportive professional advice. Second, I'd like to thank my committee, Bruce Brownawell, Dave Caron and Phil Gschwend, whose advice and support is evident throughout this work. Thanks are especially due to Phil who introduced me to chemical oceanography at WHOI, cajoled me into applying to the Joint Program, and critically debated all my scientific and professional ideas throughout my tenure here. I would also like to thank Kathleen Ruttenberg for agreeing to be the chair of my defense. I could not have asked for a better advocate in these last few months.
This work would not have been possible without the generous support of many people here at WHOI and beyond. I feel I must thank the entire building of Redfield since I spent so much time there and have accosted nearly every member at one time or another with questions, concerns and requests. Many, many thanks are due to Dave Caron and his lab for all their help: Dave Caron, who taught me so much about protozoa and offered me access to his lab facilities and equipment, Mark Dennett, who answered so many last-minute questions with aplomb and kindness and Dawn Moran, who gave me many protozoan inocula with unending patience. The radioactive work presented here would not have been possible without the generosity of John Waterbury and Alan Fleer. All the DOC samples were run in the lab of Bob Chen at UMass-Boston with the help of Penny Vlahos. The Education Office (especially Stella, Julia, and Marsha) has provided invaluable assistance in navigating the worlds of MIT and WHOI.
Thanks so much to the group here in Fye. "Dr. Bob" Nelson answered innumerable analytical questions, tied countless knots, and offered pearls of wisdom at bleak hours (while calling me a variety of creative names, I have to add). Chris "Dr. Love" Reddy debated all sorts of wacky ideas, gave good analytical advice and made me laugh.
Lorraine Eglinton was constantly helping me hone my mechanic's skills during times of instrument "down-time". Nelson Frew was incredibly generous with his time and equipment while I was working on the surfactant segment of this thesis. To everyone else (especially Sean, Dan, and Jean) thanks for fostering the work environment that allowed me to develop ideas and work independently.
Thanks to the Falmouth Inter-faith Choir and the Women's Committee for showing me that there was a life outside of the Joint Program. Thanks are especially due to Lauren
Mullineaux who has exemplified my ideal female scientist and reminded me so many times that I had the potential to get there.
On the personal side, I have been truly blessed with friends and colleagues that I respect and cherish. Mak and Kathy B shared my lab and my office. Their scientific acumen, good nature and ability to laugh at themselves (and me) are most appreciated. Lihini, Ann, and Anna (and Maia) have in their own ways donated part of themselves and taught me a great deal about life and its priorities. Larry, Nicole, Derek, Sheri, Judith,
Domenique, and the pets (Fred, Ginger, Jezebel, Sara Dawg, Bronski, Luna) shared my house and helped me have a haven I could call home. The many members of WHOI94 (especially Sheri (and Meghan), Sean (and Jess), Joe, Omak, Lou, and Sooze) have shared countless joyous experiences. Mike B and Maria Hood are also thanked for friendship and smiles.
In particular, I must thank my bevy of "guardian angels". To the members of the Thesis Support Group (Kirsten, Eli, Brenda, Sheri and Nicole), your kindness and support on Fridays over the last year have made the weeks shorter and the weekends brighter. I will never forget the laughs at "our" table and the supportive Kidd experience. To my non-JP friends, Kathy, Jackie, Vicki and Scott, thanks for reminding me who I was before grad school and giving me an escape when it got to be too much. To Tom, thanks for
believing this was possible and providing wonderful distractions along the way. To Steve, I could not have asked for a better housemate or a truer friend. To Brenda, thanks for your unwavering support and seemingly endless strength - so much of this is due to you.
And finally, and most importantly, I'd like to thank my family. To Aunt Julia and Uncle Jim, thanks for the lovely get-away from the craziness of New England complete with great needlework advice and stimulating sports conversation. To Pete, my bigger-younger brother, thanks for the numerous reality checks and wonderful visits. To Dan, my younger-younger brother, thanks for sharing my sense of humor and supporting my assertion that Chicago is, indeed, the best. To my dearest parents, you are my staunchest supporters, closest friends, and greatest inspirations. Words cannot express the depth of my gratitude for your love.
This thesis is dedicated to my grandmother who taught me to roller-skate uphill.
The work described herein was supported by National Science Foundation Contract No. OCE-9253910 and Office of Naval Research AASERT Grant No. N00014-96-1-0718.
TABLE OF CONTENTS
THESIS ABSTRACT ... 3
ACKNOW LEDGM ENTS ... 4...4
TABLE OF CONTENTS ... 7
TABLE OF FIGURES ... 10
TABLE OF TABLES ... 12
1. INTRODUCTION ... 13
1.1 GENERAL JUSTIFICATION FOR THESIS ... 13
1.2 POLYCHLORINATED BIPHENYLS (PCBS) ... ... 14
1.2.1 Current models of speciation ... 15
1.2.2 Effect of structure and chemical composition on CB sorption to organic matter ... 18
1.3 PROTOZOA ... ... 19
1.3.1 Microbial loop ... 19
1.3.2 Roles ofprotozoa in the microbial loop ... 19
1.4 PROTOZOA AND CONTAMINANTS ... 22
1.4.1 Presence ofprotists at contaminated sites... 22
1.4.2 Field studies suggesting importance of microbial loop ... 23
1.5 THESIS BACKGROUND, DEVELOPMENT, AND SUMMARY ... 24
1.5.1 Model system ... 24
1.5.2 Equilibration within organic phases of model system ... 24
1.5.3 Production of material by protists and its affinity for PCBs ... ... 25
2. THE IMPORTANCE OF PASSIVE DIFFUSION IN THE UPTAKE OF PCBS BY PHAGOTROPHIC PROTOZOA ... 31
2.1. ABSTRACT ... 31
2.2. INTRODUCTION ... 31
2.2.1. Polychlorinated biphenyls ... 31
2.2.2. Introduction into organisms ... 32
2.2.3. Initial calculation... 34
2.3. METHODS ... 38
2.3.1. Growth of organisms ... 38
2.3.2. Experimental protocol. ... 40
2.3.3. CB Analyses ... 42
2.3.4. Organic carbon analyses... 44
2.3.5. Population numbers ... 45
2.3.6. Radioactive experiments ... 45
2.4. RESULTS . ... 46
2. 4.1. Bioaccumulation experiments ... 46
2.4.2. Comparison of CB aqueous concentrations to CB aqueous solubilities ... 48
2. 4. 3. Bioconcentration factors... 50
2.4.4. Coplanar vs. non-coplanar congeners ... 51
2.4.5. Radioactive diffusion experiments ... 52
2. 4.6. Calculation of bacterial loss rate constant... 53
2.4. 7. Comparison ofprotozoan uptake rate and bacterial depuration rate ...54
2.5. DISCUSSION ... 56
3. EVIDENCE FOR DOC-ENHANCED MOLECULAR DIFFUSION IN A BACTERIAL CULTURE ... 69 3.1. INTRODUCTION... ... 69 3.2. METHODS ... 71 3.2.1. Growth of organisms ... 71 3.2.2. Polychlorinated biphenyls ... 72 3.2.3. Experimentalprotocol. ... 73
3.2.4. Ancillary measurements - bacterial concentrations and DOC ... 74
3.2.5. Sample work-up ... 74
3.2.6. GC analysis and data generation ... 76
3.3. RESULTS ... 77
3.3.1. Calculation of expected and measured extraction rate constants. ... 77
3.3.2. Estimate of CB-DOC disassociation rate constant, k, ... 80
3.3.3. Extension of results to other congeners ... 83
3.4. DISCUSSION ... 85
3.4.1. Implications for protozoan uptake of PCBs and microbial food web ... 85
3.4.2. Implicationsfor the concept of "bioavailability ... 86
3.5. CONCLUSIONS ... 88
4. DISSOLVED ORGANIC MATTER CYCLING IN PROTOZOAN GRAZING CULTURES: TEM PORAL AND COM POSITIONAL DYNAMICS ... 95
4.1. INTRODUCTION ... 95
4.1.1. Surfactants ... 96
4.1.2. Microbial loop ... 97
4.1.3. Goals of the study. ... 100
4.2. METHODS ... 101
4.2.1. Organisms studied ... 101
4.2.2. Protozoan cultures... 102
4.2.3. Parameter analyses... 103
4.3. RESULTS ... 107
4.3.1. Comparison of methods usedfor collection of 'dissolved samples ... 107
4.3.2. Storage experiments... 109
4.3. 3. Initial studies with Uronema and H. halodurans... 110
4. 3.4. Interspecies comparison ... 111
4.3.3. Ingestion and surfactant production rates ... 113
4. 3. 4. Lipid data - bulk and compositional inJbrmation ... 115
4.4. DISCUSSION ... 117
4. 4.1. Relative dynamics of organic carbon, surfactants and lipids. ... 117
4.4.2. Surfactants ... 117
4.4.3. Lipopolysaccharides and lipids ... 122
4.5. CONCLUSIONS ... 123
5. EFFECT OF DOC COMPONENTS ON CB SPECIATION IN PROTOZOAN CULTURE FILTRATES ... 139
5.1. INTRODUCTION ... 139
5.1.1. CB speciation in natural waters - "bioavailable "fraction... 139
5.1.2. Potential role of microbial loop (and protozoa) in CB speciation ... 141
5.1.3. Goal ... 143
5.2. METHODS ... 144
5.2.1. Aliquot collection... 144
5.2.2. Headspace vessels... 145
5.2.3. Time points and analysis... 146
5.2.4. Brief overview ofparameter analyses... 149
5.3. RESULTS ... 149
5.3.1. Partition coefficients (KDoc) in culture filtrates ... ... 149
5.3.2. Comparison of binding potential with bulk DOC and surfactants ... 152
5.3.2. Calculation ofpotential lipid contribution ... 152
5.3.3. Size-fraction study ... 154
5.4. D ISCUSSION ... ... 154
5.4.2. Comparison of grazingfiltrates to bacterial and VSW controls ... 154
5.4.3. Implicationfor PCBs in natural systems ... 157
5.5. CONCLUSIONS ... 158
6. CONCLUSIONS ... 167
6.1. INTRODUCTION ... ... 167
6.2. SUMMARY OF THESIS CONCLUSIONS ... 167
6.2.1. Chapter 2 ... 167
6.2.2. C hapter 3 ... ... 168
6.2.3. Chapter 4 ... 169
6.2. 4. Chapter 5 ... 170
6.3. THESIS IM PLICATIONS... 171
6.3.1. Equilibrium dynamics in the microbial loop ... 171
6.3.2. Production of heterogenous C/DOM ... 172
6.3.3. Applicability to natural systems... 173
6.4. FUTURE W ORK ... 175
APPENDIX A - EFFECT OF BOUNDARY LAYER ON DIFFUSIVE UPTAKE OF PCBS BY PROTOZOAN CELL ... 179
APPENDIX B - DATA TABLES FOR CHAPTER 2 BIOACCUMULATION EXPERIMENT ... 183
APPENDIX C - CORRECTION TO EQUATION IN CORNELISSEN ET AL. (1997) ... 203
TABLE OF FIGURES
Chapter 1
Figure 1-1. Conceptual model of CB speciation in aquatic systems ... 27
Figure 1-2. Carbon and nutrient cycles in model system containing protozoa and bacterial prey ... 27
Figure 1-3. Schematic of protozoan digestive system ... ... 28
Figure 1-4. Protozoan and bacterial dynamics at a jet-fuel contaminated site . ... 29
Figure 1-5. Ratio of depositional fluxes to sedimentation rates for selected CB congeners and polyaromatic hydrocarbons (PAHs) ... 30
Chapter 2 Figure 2-1. Total recovery for IUPAC #187 versus volatilization model ... 60
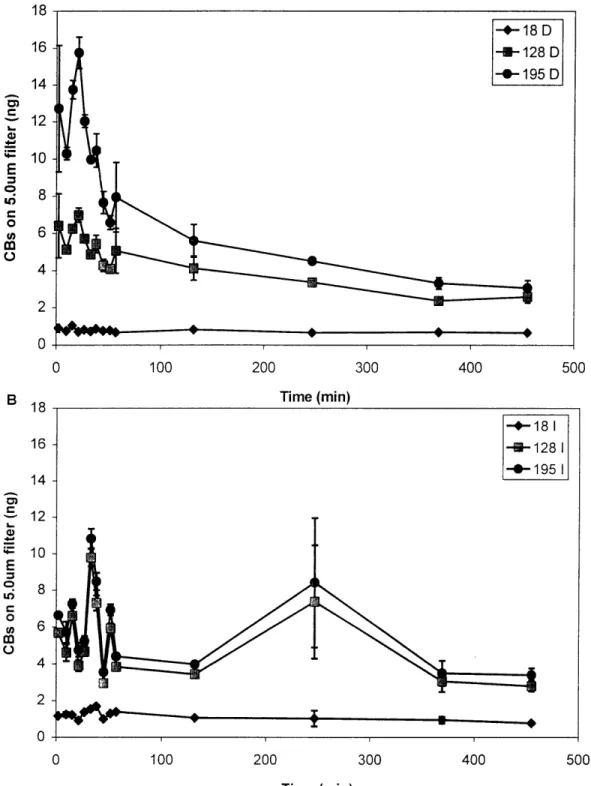
Figure 2-2. Masses of selected congeners retained on 5.0pm Ag filter as a function of time ... 61
Figure 2-3. Total PCBs extracted per sample ... 62
Figure 2-4. Fraction of three selected congeners (18, 128, 195) retained on 5.Ogm filter vs. time ... 63
Figure 2-5. Bioconcentration factors for each congener in the experimental flasks ... 64
Figure 2-6. Ratio of coplanar to non-coplanar PCBs in bioaccumulation experiment ... 65
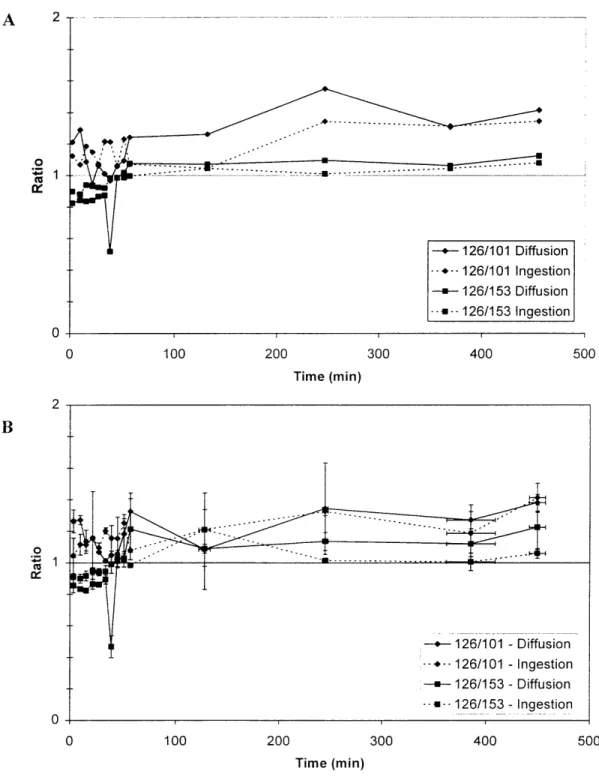
Figure 2-7. Radioactive bioaccumulation experiment ... 66
Figure 2-8. Non-linear regression fits for data from radioactive experiment ... 67
Figure 2-9. Model runs using parameters from radioactive experiments ... 68
Chapter 3 Figure 3-1. Schematic detailing enhanced diffusion due to CB/DOC interactions . ... 90
Figure 3-2. Expected and measured extraction rate constants versus log Ko for both incubations ... 91
Figure 3-3. Expected and measured rate constants (predicted) for 3 CB congeners as a function of DOC. 93 Chapter 4 Figure 4-1. Organic carbon cycle in surface ocean as result of food web cycling ... 124
Figure 4-2. M icrobial loop ... 124
Figure 4-3. Example of results obtained by surfactant method ... 125
Figure 4-4. Collection method study for dissolved parameters - surfactants, LPS, and DOC ... 127
Figure 4-5. Collection study for Uronema culture - syringe filtration vs. centrifugation ... 127
Figure 4-6. Storage experiment for H.halodurans and Uroneina surfactant samples ... 128
Figure 4-7. Lipopolysaccharide storage experiment for H.halodurans culture ... 129
Figure 4-8. Surfactant concentrations and Uronema # versus time in two early experiments ... 130
Figure 4-9. Surfactant concentrations in a Uronemna culture with glucose-grown prey ... 131
Figure 4-10. Surfactant concentrations in a Uronema and a Cafeteria culture with pyruvate-grown prey. ... 131
Figure 4-11. Data for interspecies comparison - Hhalodurans - population, DOC, LPS, and surfactants. ... .132
Figure 4-12. Data for interspecies comparison - Uronema - populations, DOC, LPS, and surfactants. .. 133
Figure 4-13. Data for interspecies comparison - Cafeteria - population, DOC, LPS, and surfactants ... 134
Figure 4-14. Data for interspecies comparison - P. Imperforata - population, DOC, LPS, and surfactants. ... .135
Figure 4-15. Surfactant data for all cultures in interspecies comparison ... 136
Figure 4-16. DOC data for all cultures in interspecies comparison ... 136
Figure 4-17. LPS data for all cultures in interspecies comparison ... 137
Figure 4-18. Comparison of surfactant production rates and ingestion rates in 3 protozoan species ... 138
Chapter 5 Figure 5-1. Schematic of headspace vessel ... 160
Figure 5-2. Representative figures of different headspace experiments ... 162
Figure 5-4. Binding data versus surfactant activity... 164 Figure 5-5. Binding data versus bulk DOC concentrations. ... 164 Figure 5-6. Size-fraction study ... 165
TABLE OF TABLES Chapter 2
Table 2-1. Parameters used in estimates of uptake rates via diffusion and ingestion ... 36
Table 2-2. CB congeners used in experiments - IUPAC #, structure and log Kow ... 41
Table 2-3. Population and organic carbon data for all experiments ... 47
Table 2-4. Aqueous solubilities, concentrations and comparisons for all CB congeners used ... 49
Chapter 3 Table 3-1. Congeners used in this study - structures and log Kw ... 72
Table 3-2. Parameters and extraction rate constants for incubation I (2h) ... 84
Table 3-3. Parameters and extraction rate constants for incubation 2 (5h) ... 84
Chapter 4 Table 4-1. Summary of the characteristics of "grazer-enhanced" C/DOM in cited investigations ... 100
Table 4-2. Bacterial growth media... 102
Table 4-3. List of experiments examined in this chapter ... ... 103
Table 4-4. Maximum ingestion rates and activities for protists studied. ... 114
Table 4-5. Bulk and compositional lipid data for protozoan and bacterial samples ... 116
Table 4-6. Measured surfactant activities in seawater, cultures and this study ... 118
Chapter 5 Table 5-1. Data from all headspace experiments ... 150
Table 5-2. Data from all headspace experiments - Uronema and H. halodurans ... 151
Table 5-3. Comparison of this study's values for KDOC of seawater DOC with literature values ... 154
Table 5-4. Lipid concentrations in seawater from different regimes compared to those in our study ... 156
1. Introduction
1.1 General justification for thesis
Anthropogenic activities have introduced xenobiotic hydrophobic organic compounds into the natural environment. Many of these contaminants have a myriad of toxic and mutagenic effects and present a hazard to human and ecological health. One class of these pollutants is the polychlorinated biphenyls (PCBs). The structural
foundation of all chlorobiphenyls (CBs) is the biphenyl ring system. Different congeners (isomers and homologues) are formed by attaching chlorine atoms to various positions on this ring system. Theoretically, there are 209 possible congeners, representing a range of one to ten substituted chlorine atoms. These compounds were synthesized primarily for use in the electrical industry as insulation for electrical transformers and capacitors (NRC, 1979). Before 1971, there was limited usage of these compounds as lubricants and de-dusting agents in other industries. In 1971, however, the production of PCBs was banned in the United States and their use was allowed only in closed systems, such as electrical transformers. Consequently, old CB-containing electrical equipment is the only source of PCBs still remaining in the United States and its disposal is strictly regulated. Aquatic (lacustrine, riverine and marine) sediments are the ultimate depository for PCBs in the United States. PCBs can be removed from the environment by anaerobic and aerobic microbial degradation as well as photolysis in the atmosphere. These processes occur on very long time scales and are subject to significant congener differences. PCBs are assumed, then, to be relatively inert to chemical or biological degradation on short time scales. As the industrial use of PCBs declines steadily, recycling processes at the sediment-water interface in lacustrine and marine environments will constitute the major source of PCBs to marine and fresh water systems (NRC, 1979). The controlling factors for recycling processes and their effect on CB speciation in contaminated sediments must be characterized to assess the extent to which PCBs are remobilized to the overlying water column.
The work presented in this thesis sought to characterize the impact of the microbial loop and specifically, protozoan grazers on the cycling of PCBs in marine
systems. CB dynamics were examined in two-phase laboratory systems consisting of protozoa and bacteria. Chapters 2 and 3 evaluate the extent to which these experimental systems are in equilibrium within the relevant time scale for grazing processes (2-5 days). Chapter 4 examines the production and composition of"grazer-enhanced" dissolved organic material (DOM) in cultures of three protozoan species. Chapter 5 measures the affinity of this material for PCBs relative to bacterially-derived material and Vineyard Sound seawater DOM.
1.2 Polychlorinated biphenyls (PCBs)
Polychlorinated biphenyls are ubiquitous and persistent in the global environment. The residence time and distribution of specific chlorobiphenyl (CB) congeners are
difficult to predict in aquatic systems due to the range of chemical properties within this class of compounds. For example, aqueous solubilities span five orders of magnitude (10-3 to 10-8 g/L - Mackay et al., 1980). Due to the dependence of many chemical properties on chemical structure, variations in aqueous solubility within the PCB class
exist not only as a function of molecular weight but also as a function of the position of chlorine substitution. As a result of high hydrophobicity (i.e., low aqueous solubility), PCBs preferentially associate with organic-rich phases and consequently accumulate in the tissues of organisms. While they travel up the food chain, these compounds are biomagnified at each trophic level (Evans et al., 1991). At the higher trophic levels, the toxic effects of PCBs are subtle, resulting in reproductive disorders as well as behavioral
development problems rather than acute sickness or death (NRC, 1979). Biodegradation of PCBs by bacteria is slow but present in aerobic environments (review - Furukawa,
1986). Field investigations have also observed degradation via reductive de-halogenation under anoxic conditions (Abramowicz, 1990; Bedard and May, 1996). Dehalogenation under anaerobic conditions removes chlorines from the meta and para positions preferentially. Degradation in the presence of oxygen occurs via the destruction of the biphenyl ring system and preferentially affects low-chlorinated congeners due to steric effects.
1.2.1 Current models of speciation
Studies have shown that PCBs adsorbed onto abiotic particles or complexed by dissolved organic matter (DOM) are relatively unavailable to bacteria and phytoplankton in comparison to PCBs truly dissolved in the aqueous phase (reviews - Farrington, 1991; Mihelcic et al., 1993; Suffet et al., 1994). These studies have led to the hypothesis that the primary mechanism by which PCBs enter the aquatic food chain is via dissolved uptake by bacteria and phytoplankton. In natural aquatic systems, many factors can affect the relative fraction of dissolved PCBs, including DOM concentrations, particle flux to the sediment-water interface, percent organic carbon in particles and congener hydrophobicity.
The simplest model used to predict the dissolved concentration of PCBs and other hydrophobic organic compounds assumes that they exist in equilibrium between the aqueous and abiotic particulate phases (Karickhoff et al., 1979). This equilibrium partitioning can be represented mathematically by the following equation:
CP
(1) K,,P
where Cp is the concentration in the particulate phase, Cw is the concentration in the aqueous phase and Kp is the non-dimensional proportionality constant, or the equilibrium partition coefficient. Organic carbon content and compound hydrophobicity appear to be the primary factors controlling the value of Kp. Therefore, Kp is often normalized to the
fraction of organic carbon (foc) to produce a relatively constant partition coefficient, Koc, that is applicable to sediments with f > 0.001 (Schwarzenbach and Westall, 1981).
Increasing log Koc is linearly related to increasing log Ko, the n-octanol-water partition coefficient (Karickhoff et al., 1979; Schwarzenbach and Westall, 1981; Schwarzenbach
et al., 1993). Since Kow is a measure of a compound's hydrophobicity, a linear
relationship between log Kow and log Koc implies that hydrophobic organic contaminants with high Kow values will preferentially partition into the organic-rich phases of the aquatic system. Other variables may also be important for controlling particle
associations (for example - temperature and total suspended solids - Bergen et al., 1993; salinity - Means, 1995) but Kow seems to be the most dominant factor (Schwarzenbach et
al., 1993).
In this two-phase model, the hydrophobic, or particle-reactive, compound is assumed to be associated with natural organic matter on the surface of abiotic (i.e., non-living) particles. However, further studies have shown that the measured dissolved concentrations of very hydrophobic contaminants, e.g., highly chlorinated PCBs (log Kow of 7.5-8 - Hawker and Connell, 1988), exceed their aqueous solubilities.
Consequently, it is clear that the two-phase equilibrium model does not fully explain the partitioning behavior of hydrophobic organic contaminants observed in aquatic systems
(Wijayaratne and Means, 1984; Gschwend and Wu, 1985; Baker et al., 1986; Brownawell and Farrington, 1986). The reason for this lies in the difficulty of determining analytically the true aqueous concentration, C, due to interferences by macromolecular or colloidal material within the aqueous phase.
Separation methods using filters with nominal pore sizes of 0.2-0.7pm or centrifugation cannot fully separate this macromolecular or colloidal material from the aqueous phase. In the absence of phase separation methods that completely remove these high molecular weight materials, a three phase model must be used to describe
equilibrium speciation. In this model, the phases are defined as particulate material, colloidal material and the aqueous phase (Gschwend and Wu, 1985; Brownawell and Farrington, 1986):
CP (2) KP
where Cc is the colloidal concentration. Studies by Gschwend and Wu (1985), Brownawell and Farrington (1986) and others show that the three phase model more accurately explains experimental data. The dependence of Kp on organic carbon content and compound hydrophobicity in this model is assumed to be similar to that of Kp in the two-phase model described above. However, it is possible that colloidal material has a different composition than the larger particulate material (e.g., Taylor et al., 1985). As a
result, two different Kp's should be used to explain fully the partitioning behavior of PCBs (Gschwend and Wu, 1985). Nonetheless, as a first approximation, the three phase model fits experimental data quite well (Brownawell and Farrington, 1986).
The above two models assume equilibrium partitioning of PCBs between abiotic (non-living) particles and the surrounding aqueous phase. In a laboratory study testing this hypothesis, Wu and Gschwend (1986) found that equilibrium between aqueous PCBs and sediment grains was attained within two hours. This and other sorption kinetics studies (Tye et al., 1996) test only the equilibrium partitioning predicted by the physical-chemical model above; they do not examine the kinetics-limited uptake processes that can occur in unicellular organisms. Stange and Swackhamer (1994) and Swackhamer and Stange (1993) have studied the kinetics of uptake of PCBs in phytoplankton. Their results indicated that CB concentrations in an organism and the surrounding aqueous phase did not reach equilibrium values until 10 days after PCBs were added to the
system. Instead of the instantaneous partitioning assumed by the equilibrium model, they observed a two-stage process consisting of rapid uptake for 1-2 hours and slow
equilibration with cellular carbon for the remainder of the experiment. These
investigators proposed that the initial uptake was equilibration of the cellular surface with the aqueous CB concentration. Subsequent transport (active and/or passive) across the cellular membrane into the cell interior was a possible explanation for the second stage of CB uptake (Stange and Swackhamer, 1994). The kinetics of this two-stage process were dependent on the surface area-to-volume ratios and growth rate of the phytoplankton (Skoglund et al., 1996). These studies have only been performed with phytoplankton (size 10-102Cpm). Whether these results can be extended to larger or smaller unicellular organisms was not ascertained. However, given these studies, it is possible that the kinetics of uptake of PCBs by organisms will not be as rapid as the diffusive equilibration proposed by the abiotic models described above. These models of PCB speciation can be integrated into a conceptual model shown in Figure 1-1.
1.2.2 Effect of structure and chemical composition on CB sorption to organic matter
PCBs will readily partition into organic matrices occurring in aquatic systems because of low aqueous solubilities and concomitant high hydrophobicities. The sorption of PCBs to inorganic particulate material such as oxides and to colloidal or dissolved organic matter is sensitive to the influences of structure and chemical composition. While surface-adsorption of PCBs onto inorganic particulate oxides will occur, incorporation into the matrix of the particle and association with organic matter is a function of the diffusion of PCBs into the inner oxide and the affinity of the associated organic matter for PCBs (Wu and Gschwend, 1988).
As discussed above, colloidal/dissolved organic matter has been shown to
influence the residence time of PCBs by "sequestering" PCBs within the suspended pool. The extent of this influence will vary depending on the size, conformation, and chemical composition of the material acting as substrate. First, a microenvironment conducive to PCB dissolution must be present either within the structure of the material (Gustafsson and Gschwend, 1997) or in a pocket along the surface (partial desolvation from H20). Therefore, the material must be large enough to be able to fold and aggregate such that an inner hydrophobic environment can form. Many biomolecules are large enough to
achieve such a conformation (Benner et al., 1992; Aluwihare et al., 1997). In addition, the material must have some affinity for PCBs. Some studies have shown decreasing sorption with increasing organic phase polarity (increasing C/O ratios - Chiou et al., 1986; Gauthier et al., 1987). For example, compounds such as cellulose are poorer sorbents for PCBs than lipid-rich molecules (Garbarini and Lion, 1986). The relative partition coefficients of carbohydrates and lipids are so divergent that large
concentrations of carbohydrates are necessary to "sequester" as many PCBs as very small concentrations of lipids. Therefore, small increases in lipid-rich colloidal material will have a large impact on the speciation of PCBs within a particular system, whereas the effect of small increases in carbohydrate material would not be detected.
1.3 Protozoa 1.3.1 Microbial loop
The concept of a microbial loop was first introduced by Pomeroy (1974) and further formalized by Azam et al. (1983). The microbial loop is a complex food web consisting of bacteria, phytoplankton and micrograzers such as nanoflagellates and ciliates. The ability of protozoan grazers to recycle and remineralize both organic matter and inorganic nutrients has been the subject of numerous laboratory and field-based studies (e.g., Sherr et al., 1982; Caron et al., 1985; Goldman et al., 1985; Andersen et al.,
1986; Goldman et al., 1987; Caron et al., 1988; Sherr and Sherr, 1988; Caron et al., 1991; Sherr and Sherr, 1994; Barbeau et al., 1996; Barbeau et al., submitted). A
particularly exhaustive study (Caron et al., 1985; Goldman et al., 1985; Andersen et al., 1986; Goldman et al., 1987) showed that protozoan grazers excrete inorganic nutrients such as nitrate and phosphate as well as dissolved organic carbon (model in Figure 1-2). The concept of this dynamic recycling process has implications for the study of organic carbon remineralization in all regimes, including oligotrophic waters such as the Sargasso Sea, coastal areas such as estuaries, and the sediment-water interface in both lacustrine and marine systems. Now that the presence of this loop and cognizance of its importance has been firmly established, studies are focusing on the time scales of the grazing
processes (Sherr et al., 1987; Sherr et al., 1989; Caron et al., 1991), and the nature of the excretion products (Nagata and Kirchman, 1992b; Tranvik et al., 1993; Tranvik, 1994).
1.3.2 Roles ofprotozoa in the microbial loop
1.3.2.1 Particle size spectrum
Phagotrophic flagellate and ciliate protists are able to remineralize a significant fraction of ingested bacterial and algal biomass (>50% - Fenchel, 1987). To a first approximation, nano-protists discriminate between particles primarily on the basis of size, consuming particles in the 0.1- .Ojm range. The degree of prey selectivity is a function of the feeding mechanism of the protist. Filter feeders exhibit little selectivity and ingest particles within a particular size range. Raptorial feeders can be expected to
exhibit greater food selectivity because they ingest particles one-by-one. Prey particles can include unicellular organisms like bacteria and algae as well as small detrital particles or particles associated with larger particles.
After engulfing their prey, protists digest their food with a dynamic chemical process inside the digestive vacuole (Figure 1-3). Initially, particles are subjected to a drop in pH to levels of 1.4-3 as well as intense enzymatic activity. The low pH values and digestive enzymes cause prey cell lysis. The pH increases during the second stage of digestion as the vacuole fuses with the lysosomal membrane and the waste is excreted (Fok et al., 1982). This digestive process lasts approximately 20 to 60 min (Fok et al., 1982; Fenchel, 1987). Waste products can range from large aggregates of excreted material (5.0[Lm) to colloidal particles (<0.2.tm - operational definition for the purposes of this thesis) to dissolved materials. Heterotrophic nanoflagellates can clear the prey from a volume of water 105 times their cell volume within an hour. Given the breadth of the size range represented by the waste particles in comparison to the ingested particles as well as the magnitude of the clearance rate, it is clear that protozoans have an impact on the distribution of the particle size spectrum.
Carbon dynamics in laboratory cultures showed two extremes of particle size spectrum effects (Barbeau, 1998). In an experiment with a nanoflagellate, Cafeteria sp., dissolved organic carbon (DOC) concentrations increased in the flagellate culture relative to the control during protozoan exponential growth, presumably as a result of
remineralization of bacterial biomass. In an experiment with another flagellate,
Paraphysomonas imperforata, bacterial organic carbon was repackaged into larger sized
particles (>5.0tpm) instead of entering the dissolved pool. These two experiments represent the extremes of effects that grazing activity can have on particle size
distributions. Cafeteria sp. generated large quantities of dissolved material whereas P.
imperforata repackaged bacterial material into larger particles that sank out of the culture
medium quickly.
These results were extended to particulate (colloidal) metal oxides in recent laboratory (Barbeau et al., 1996) and field studies (Barbeau and Moffett, submitted). In
these studies, iron hydroxides, impregnated with a chemically inert tracer, were fed to protozoa in laboratory culture and to natural assemblages collected from Vineyard Sound, MA. The accumulation of the inert tracer in the dissolved fraction (<3500 molecular weight cutoff) was linearly related to the amount of dissolution of the hydroxides and served as a measure of protozoan grazing. These results showed that protozoan grazers in laboratory culture and in the 2-20ptm size fraction of Vineyard Sound seawater were capable of dissolving colloidal iron hydroxides. The redox state of the excreted Fe was hypothesized to be Fe+2. Experiments with iron-limited diatom cultures showed
increased diatom growth in the presence of grazers and colloidal iron-hydroxide coated bacteria (Barbeau et al., 1996).
1.3.2.2 Chemical composition of particulate and dissolved organic matter
Recent work by Nagata and Kirchman (1992b) and Tranvik (1994), has shown that protozoan grazers may represent one source of colloidal material. In laboratory culture, Nagata and Kirclhman (1992b) found that protozoan grazers excreted significant amounts of macromolecular material (5 to 57% of labeled DOM) as defined by a cold trichloroacetic acid (TCA) precipitation. They proposed that this high molecular weight, or colloidal, material was coated with a layer of phospholipids derived from bacterial prey. Tranvik also noted an enhancement of colloidal material (0.02ptm - 0.2ptm) in
grazing cultures. Radiolabeled prey studies showed that this material was most likely derived from internal cellular components rather than cell wall material. Differences in organic carbon composition may affect affinity of DOM for particle-reactive compounds and elements such as PCBs and Th. Experiments with 23 4Th-labeled prey showed an
increase in Th-to-C ratios in the particulate organic size fractions (0.2-1.Opm, 1.0-5.0ptm, and >5.0tm), suggesting either increased particle surface area or higher affinity for 234Th over DOM in bacterial controls (Barbeau et al., submitted).
In marine environments, the composition of particles along the size spectrum can vary tremendously. The relative abundance of inorganic and organic components is a function of depth in the water column due to preferential degradation of organic-rich
particles. In addition, there are spatial variations in the composition of the particle size spectrum due to nutrient variability (i.e., changes in primary production) as well as atmospheric deposition patterns (i.e., changes in inorganic mineral composition). As an example, Sackett (1978) showed that particles in the upper 10 m in the Gulf of Mexico were composed primarily of organic constituents (85%). This composition was altered dramatically by biological degradation within the water column, resulting in the
deposition of primarily inorganic particles (66%) at the sediment-water interface. Coastal studies have shown that organic carbon composition is often 1-5% in fine-grained near-shore sediments, consistent with the data of Sackett (1978). Since organic-rich particles constitute such a small fraction of total material at the sediment-water interface, any additional source of organic material in this system could affect speciation of compounds governed by organic carbon composition.
1.4 Protozoa and contaminants
1.4.1 Presence ofprotists at contaminated sites
The presence of protists has been noted at a number of contaminated sites (Pratt and Cairns, 1985; Shen et al., 1986; Madsen et al., 1991; Sinclair et al., 1993; Harvey et
al., 1995). High concentrations of nutrients and organic matter in contaminated areas and
sewage disposal sites support dense bacterial populations and thus active protozoan assemblages. The interactions between bacterial and protozoan populations can have a positive impact on the extent of bio-degradation occurring at these sites. For example,
Sinclair et al. (1993) investigated a groundwater site contaminated with jet fuel. High biodegradation rates (by bacteria) occurred in areas of high jet fuel concentrations. However, bacterial populations at the contaminated site were comparable in density to those at an uncontaminated control site, implying that elevated biodegradation rates could not be explained simply by higher bacterial concentrations. In contrast, protozoan
populations were significantly elevated at the jet fuel site (Figure 1-4). Sinclair et al. (1993) concluded that protozoa were actively grazing the bacteria, keeping them growing at exponential rates which in turn raised biodegradation rates.
1.4.2 Field studies suggesting importance of microbial loop
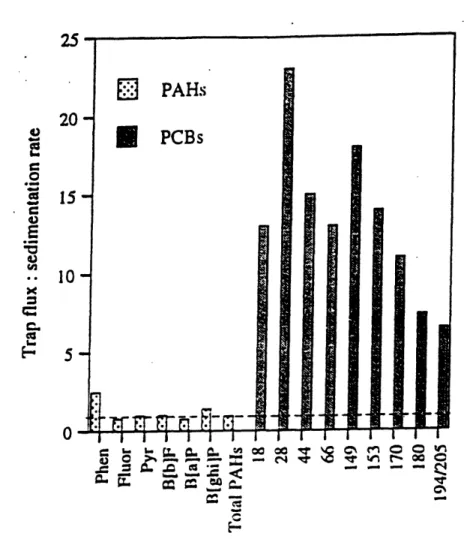
Recent field studies (Lake Superior Baker et al., 1991; Mediterranean Sea -Lipiatou et al., 1993; Esthwaite Water - Sanders et al., 1996) highlight the need for the integration of both the biological (Skoglund et al., 1996) and physico-chemical (Wu and Gschwend, 1986) models of CB speciation. The equilibrium partitioning models predict that PCBs will absorb into abiotic particles during settling. However, it has been noted that downward CB fluxes to the sediment, when calculated using sediment traps, are greater (100X) than those calculated using accumulation rates measured in sediment cores (Figure 1-5). The data suggested that 85-90% of the PCBs deposited onto the sediment-water interface were recycled and returned to the water column (Baker et al.,
1991). These studies are based on material collected in sediment traps suspended within the lake water column. Concerns have been raised regarding the collection efficiencies and sample integrity of the collected materials by many authors (e.g., Lee et al., 1992). In the Baker et al. study (1991), the traps were poisoned with chloroform. This poison could preferentially extract hydrophobic compounds, including contaminants such as PCBs, from the water (Gundersen and Wassmann, 1990). The second study, performed by Sanders et al. (1996), used an inorganic poison (HgI2- mercuric red) in the sediment
traps. The results from these studies should be viewed critically given the above concerns. Even so, the results point to efficient recycling processes occurring at the sediment-water interface. If true, contaminated sediments can be the largest source of CBs to the water column (Sanders et al., 1996).
Review of these data suggested that these recycling processes could be mediated by micro-organisms inhabiting the sediment-water interface. The particles ingested by protozoa (0.1-1.Opm) constitute a major pool of surface area in aquatic systems and thus a potentially significant reservoir of surface-active contaminants (based on particle size class distributions and surface area:volume ratios). The ability of protists to alter both the size spectrum and chemical composition of particles at the sediment-water interface
suggests that grazing processes can affect CB speciation in this milieu and subsequently influence the residence time of PCBs within an aqueous system.
1.5 Thesis background, development, and summary 1.5.1 Model system
This thesis is based on a series of laboratory experiments designed to elucidate various aspects of the microbial loop and its influence on CB speciation in regimes with an active microbial loop. To this end, a two-phase system was employed in all
experiments. This system consisted of predator and prey suspended in sterile Vineyard Sound seawater. Three different protozoan species were used as predators - a ciliate,
Uronema sp. (clone: BBCil), and two flagellates, Cafeteria sp. (clone: Cflag) and Paraphysomonas imperforata (clone VS 1). The same bacterium, Halomonas
halodurans, was used as prey in all experiments. All organisms were obtained from the
collection of D. Caron, University of Southern California, CA. Chloro-biphenyls (CBs) were added to all experiments and their dynamics monitored. These experiments
contained three pools of organic matter within the aqueous phase - colloidal/dissolved organic matter (C/DOM - also referred to as dissolved organic carbon or DOC), bacterial cells, and protist cells. The PCBs added to the system interacted and associated with each of these three pools according to physico-chemical properties of the organic matter. This thesis was concerned with the equilibrium CB concentrations and residence times within each of the organic pools mentioned as well as with changes within the C/DOM pool and the consequences for CB speciation. The end goal of the thesis was to
understand (and potentially predict) the effect of protozoan grazers on the cycling of PCBs. By extension, these results can be used to estimate the release of PCBs from sediments at contaminated sites.
1.5.2 Equilibration within organic phases of model system
The first section of the thesis was concerned with the timing of CB uptake into protozoa. The production of organic matter by grazing protists occurs on the time scale
of hours to days (Caron et al., 1985; Barbeau, 1998). CB equilibration with unicellular protists needs to occur much faster than these processes in order to determine accurately the fluxes of PCBs among the different organic pools present. Since ingestion of prey is intimately tied to the production of organic matter, uptake of PCBs by ingestion of contaminated prey is expected to occur on time scales of hours. A theoretical calculation predicted that the alternate method of CB uptake, diffusion, should be faster than
ingestion of contaminated prey by a factor of 1000. Experimental verification of this prediction was the goal of Chapter 2.
Once it was established that PCBs could be taken up by protists on minute time scales, the rate constants for loss of CBs from bacteria and disassociation of CB-DOC complexes were examined to ensure that they were fast enough to supply the diffusive uptake by protozoa. A calculation in Chapter 2 suggested that the bacterial loss rate was comparable to protozoan uptake rates. The role of CB-DOC complexes in the diffusive process is the subject of Chapter 3. Increased CB uptake from the ingestion of CB-DOC complexes did not increase CB ingestion rates enough to out-compete diffusion. In fact, diffusion of CB-DOC complexes to the surface of the protozoan may have increased the diffusion uptake rate.
1.5.3 Production of material by protists and its affinity for PCBs
Once it was clear that protozoa, bacteria and DOC equilibrated with the added PCBs within minutes, the effect of protozoan grazing on CB speciation could be examined. DOC dynamics were monitored in protozoan cultures and compared to bacterial controls. Specific components of bulk DOC were examined, such as surface-active material and lipopolysaccharides (Chapter 4). Production rates of these materials and ingestion rates by protozoa were compared and the influence of protozoan species and prey growth substrate was considered. The affinity of this "grazer-enhanced" DOM for a radiolabeled CB congener (['4C]-3,3',4,4'-tetrachlorinated biphenyl or [4C]-TCB) was determined in
inoculated with ['4C]-TCB and the affinity of DOM was compared among protozoan
cultures, bacterial controls and Vineyard Sound seawater.
The results from the four data chapters were summarized in Chapter 6 and used to synthesize a picture of CB dynamics in the microbial loop. The effect of protozoan grazing on the release of PCBs from contaminated sediments was also discussed.
Water Column Mass Transt Adctive or DOsaw Flux 4 Cw. org Met/ane Ingestonor TransoEt xcretion Sorupionaesorpon Cw.aq ,. ZC i I4 '8oundar Laye Mns Tr, Paswon -+iee~o Cs. arg
Figure 1-1. Conceptual model of CB speciation in aquatic systems.
The above figure is taken from Suffet et al. (1994). The subscripts refer to (1) the environmental phase [water (w) or sediment (s)] and (2) the phase within that compartment [aqueous (aq), organism (org), sorbing phase (i)]. The kinetic barriers are not shown here but will retard the uptake of contaminants into the biota (organisms) or the sorbing phase.
Colloids
CO2 (g) Respiration
PO43 NH4 lnorganic nutrients
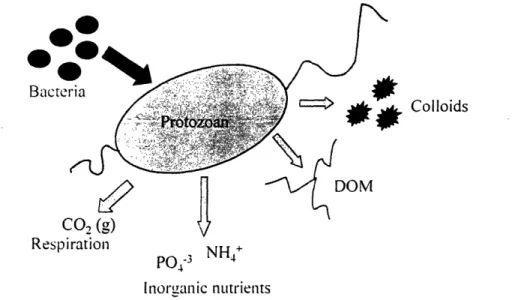
Figure 1-2. Carbon and nutrient cycles in model system containing protozoa and bacterial prey.
Carbon, nitrogen and phosphorus contained in bacterial biomass are ingested by phagotrophic protozoa. Inorganic carbon (CO2(g)) and nutrients (NH4+, P04-3) are respired and remineralized. Organic material
(both dissolved and colloidal) is also excreted after digestion. The composition of the organic material varies as a function of feeding mechanism and digestive assimilation efficiency.
:ytostome :ood vacuole orming at ytopharynx 'xcess water eaves food acuole ysosomes delivering izymes to food 3cuole
ood particles undergoing
igestion in vacuole
esidual vacuole ytopyge
I-?,- .rnm vlclule
Figure 1-3. Schematic of protozoan digestive system.
From Adey & Loveland (1991).
-4.00 *0.0( .00
-f
CS 4.00 6.00 0.00 O.0C 2.CO 4.CO 6.COLog bacenal Concentraon '
-(Colony Forming Units / g dry weight)
5.00 6.00 7.00 8.00 * . :..- ,. .... '... :: .,. .' . ! -' -'9.00 Pristine site
- -
8m frcm
scurce
--- Gascline scurceLog Protozoan Ccncentratcn (Log Nurrter / g dry weight)
2co 4.CO 6.Co
Figure 1-4. Protozoan and bacterial dynamics at a jet-fuel contaminated site.
Data taken from Sinclair ct ct. ( 1993). The 3.5-4.5nm range tor the site 85m from fulel spill has low 0 and high fuel concentrations.
1T I I . -0: rO ._ L I _C I ^ I i C ,c I I i I I _, in ,- 5o( wi C~~c~OO'
Figure 1-5. Ratio of depositional fluxes to sedimentation rates for selected CB congeners and
polyaromatic hydrocarbons (PAHs).
Figure 5 from Sanders et al. ( 1996). Depositional fluxes measured in I 2.5m trap of small rural lake. Dashed line represents ratio of 1:1.
25 2015 - 10-0
a
0 x c I..Ei
PAHsU
PCBsn-
r-7_E-
.Frn_
5-0 4 tr
I
II Ir __. -I I ...- I --- -- -- -oo I2. The importance of passive diffusion in the uptake of PCBs by phagotrophic protozoa
Submitted to Applied and Environmental Microbiology
2.1. Abstract
Phagotrophic protozoan grazers represent an intersection between two methods of introduction of polychlorinated biphenyls (PCBs) into marine organisms - diffusion through surface membranes and ingestion of contaminated prey. This study compares the relative importance of these two processes in the overall uptake of PCBs by unicellular protists. Uptake rates and steady-state concentrations were compared in laboratory cultures of grazing and non-grazing protozoa. These experiments were conducted with a
1Op m marine scuticociliate (Uronema sp.), bacterial prey (Halomonas halodurans), and a suite of 21 chlorobiphenyl (CB) congeners spanning a range of aqueous solubilities. The dominant pathway of CB uptake by both grazing and non-grazing protozoa was diffusion. Bioconcentration factors (BCFs) were equivalent in grazing and non-grazing protozoa for all congeners studied. Rate constants for uptake into and loss from the protozoan cell were independently determined using '4C-3,3',4,4'-tetrachlorobiphenyl (IUPAC #77). The protozoan first-order uptake rate constant and second-order loss rate constant were 0.38 + 0.03 min' and (1.1 + 0.1) X10- 5(g org C)- min'l , respectively. Magnitudes of the uptake and loss processes were calculated and compared using a numerical model. The model result was consistent with data from the bioaccumulation experiment and
supported the hypothesis that diffusive uptake is faster than ingestive uptake in phagotrophic unicellular protozoa.
2.2. Introduction
2.2.1. Polychlorinated biphenyls.
Polychlorinated biphenyls (PCBs) are persistent organic pollutants ubiquitous in the global environment which have been shown to have adverse effects on the health of many aquatic organisms (Burreau et al., 1997; Means and McElroy, 1997; Munns et al.,
1997; Schweitzer et al., 1997; Mayer et al., 1998). They accumulate in the lipid-rich compartments of organisms due to high hydrophobicity. Whereas biotransformation of biphenyls with vicinal hydrogen atoms has been observed in several species of marine organisms (Kannan et al., 1995), the lack of vicinal H-atoms inhibits degradation resulting in efficient transfer of many chlorinated biphenyls between trophic levels (Connolly, 1991; Morrison et al., 1997).
2.2.2. Introduction into organisms.
Polychlorinated biphenyls enter aquatic organisms in two ways: diffusion through outer membranes and ingestion of chlorobiphenyl (CB)-contaminated detritus or prey. Diffusion of PCBs through the cellular membrane is the only uptake pathway available for non-phagocytotic unicellular organisms such as phytoplankton. In this process, PCBs associate with outer membranes and rapidly diffuse into the phospholipid bilayer
surrounding the cytoplasm (Dulfer et al., 1996; Dulfer et al., 1998). For large organisms such as fish and marine mammals, PCBs accumulate through ingestion (Connolly, 1991; Campfens and Mackay, 1997; Kucklick and Baker, 1998). PCBs pass through the walls of the digestive system, enter the bloodstream and are subsequently carried to lipid-rich tissues. Uptake via gill and dermal exposure has been suggested to play a minor role in the overall uptake of PCBs by fish and other (large) marine organisms (Rubinstein et al.,
1984; Connolly, 1991; Morrison et al., 1997).
This study focuses on CB uptake in unicellular phagotrophic protozoa, or
nanozooplankton. These heterotrophic organisms feed primarily on particulate material in the 0.1-1.0pm size range, yet are comparable in size to the phytoplankton studied by other investigators (Swackhamer and Skoglund, 1993) and should accumulate PCBs by diffusion. Thus, these organisms offer a unique opportunity to study the relative rates of diffusive and ingested uptake.
Outside the protozoan cell, CB speciation is determined by the nature and concentration of organic carbon in both the dissolved and particulate pools
particles or associated with dissolved organic material (DOM) are relatively unavailable for biological uptake in comparison to PCBs truly dissolved in the aqueous phase (reviews - Farrington, 1991; Mihelcic et al., 1993). Dissolved PCBs enter the cell by diffusing through the cellular membrane. This process occurs as a series of steps. First, the dissolved PCBs diffuse across the unstirred water boundary layer to associate with phospholipids, extracellular proteins and, to a lesser extent, polysaccharides on the cell surface. Next, the chlorobiphenyl is transported into or through the phospholipid bilayer either via diffusion through the hydrophobic center of the membrane or through channels formed by channel and transmembrane proteins (Alberts et al., 1983).
Because the diffusion coefficient of a compound through any medium depends on its molecular size and structure, uptake via diffusion can potentially discriminate against large or bulky congeners. Ingestion of bacterial prey, alternatively, is less likely to fractionate compounds based on size or structure (provided most of the food is metabolized) because the chemical and temporal dynamics differ greatly inside the microenvironment of the protozoan food vacuole. Once ingested, all PCBs associated with bacteria are considered part of the protozoan cell because the food vacuole cannot be analyzed separately. For these reasons, the incorporation efficiency of PCBs should be close to 100% and no fractionation among congeners should occur. The concentration of PCBs in the bacteria is an important parameter in determining the CB uptake via
ingestion. The size (i.e., surface area-to-volume ratio) and composition of the bacterial cell will play a role in determining this concentration.
Ingestion of prey begins with the invagination of the cellular membrane,
encapsulating a parcel of surrounding water containing both free and complexed PCBs. The cellular membranes of ingested bacteria are disrupted by a dynamic digestive cycle (pH drops to 2-3, the food vacuole fuses with lysozymes, pH rises back to alkaline levels and intense enzymatic activity ensues - Fok et al., 1982). Nutrients are transported across vacuole walls and waste material is released. Waste material can include bacterial cell membrane fragments, potentially in micellar form (Nagata and Kirchman, 1992b). The vacuole membrane is then reincorporated into the outer cellular membrane. Once inside
the cell, the incorporated PCBs partition among the cellular components and the highest concentrations occur in organic-rich lipid storage compartments (Dulfer et al., 1998).
The difference in the two possible uptake pathways is a kinetic one. The steady-state CB concentration of the protozoan cell is the equilibrium value predicted by Kow (the n-octanol/water partition coefficient) of the CB congener and determined by the relative size and composition of the organic carbon pools in the system. The uptake pathway should not affect the final concentration in the protozoan cell, though it does affect the time needed to achieve this equilibrium value (Connell, 1989; Connolly, 1991).
2.2.3. Initial calculation.
An initial calculation for 3,3',4,4'-tetrachlorobiphenyl (IUPAC #77) shows that the diffusion uptake pathway is faster than the ingested uptake pathway. This calculation is normalized to a single protozoan cell and assumes that the rate-limiting step of
diffusive uptake is transfer across the lipid membrane. The other slow step in this process is diffusion across the unstirred water boundary layer surrounding the cell. However, with this set of organisms, the width of the boundary layer is difficult to estimate. The cellular surface is covered with cilia whose motion stirs the surrounding water and enables the ciliate to move through the water. The constant movement of these cilia will lower the thickness of the unstirred water boundary layer.
The calculation for diffusive uptake is based on Fickian diffusion described by:
AC Cou - Ci (1) Flux = D,,, = D,,
z z
where Dm is the molecular diffusion coefficient through a medium, in this case, the cellular membrane, Cout and Cin are the concentrations of the compound (CB congener) at the outer and inner cellular membrane, respectively and Az is the thickness of the lipid
membrane. Two simplifying assumptions were made in this calculation. First, the outer membrane concentration, Cout was assumed to be equivalent to the concentration of the compound adsorbed on the cell surface, or KIw* [CB]d, where Kiw is the lipid-water
partition coefficient and [CB]d is the dissolved CB concentration. Second, the inner membrane concentration was assumed to be zero.
Therefore, the rate of uptake via diffusion is defined as the flux through the phospholipid membrane multiplied by the surface area of the protozoan and expressed by the following equation:
(2) (d[CB]p, ) = Fltux SA* -,',,, = [CB] I
() dt ,,i# fAz
where [CB]prot and [CB]d are the CB concentrations in the protozoan (mol CB/m3) and dissolved phase (mol CB/m3) respectively; SAprot is the surface area of the protist (m2
);
Dm is the diffusion coefficient of a CB through the lipid membrane (m2/s); Kiw is the lipid-water partition coefficient; and Az is the thickness of the lipid membrane (m). Values are contained in Table 2-1 below.
One of the key parameters in this calculation is the diffusion coefficient in the lipid membrane. Literature values of D, could not be found for any chlorobiphenyls so this parameter was estimated in the following manner. The membrane diffusion
coefficient, D,,, was estimated for a model compound, n-hexanol, chosen because it was the most appropriate compound from the data presented in Stein (1986). This coefficient was then used to estimate Dm for the CB congener considered here. The approach and data are all derived from Stein (1986). The diffusion coefficient, D.,, is a function of the basal permeability, P (cm/s), the width of the hydrophobic interior of the phospholipid bilayer in the cellular membrane, k (A) and the membrane water partition coefficient (K) according to:
(3)
D,,,=-K
K is actually the hexadecane-water partition coefficient, argued by Stein (1986) to be the best proxy for the membrane water partition coefficient. For n-hexanol, these values are P = 3.7 X 10⁻³ cm/s (Brahm, 1983), k = 40A (Stein, 1986), and K = 1.3 (Aveyard and Mitchell, 1969). The resultant Dm, is 2.67 X 10⁻¹³m2/s.
Schwarzenbach et al. (1993) present an approximate relationship between the diffusion coefficients and molecular weights of a known and unknown compound:
D,,, (unknown) MW(known)
(4)
D,,, (known) - MW(unknown))The exponent, 0.5, on the molecular weight ratio is very rough and will change in different media, especially if viscosity of the media or diffusant conformation is important (Schwarzenbach et al., 1993). Nonetheless, this relationship can be used to give a rough estimate of Dm for CB congener IUPAC #77. The value calculated using the Schwarzenbach et al. (1993) relationship is 1.58 X 10'13 m2/s. Stein (1986) showed a greater molecular weight dependence of D,, in a membrane than in water (steeper slope in log Dm versus MW plot). The data shown in Stein (1986) can be approximately described by: log D,, = (-0.033)*MW - 4.8 where MW is the molecular weight. This relationship gives Dm for CB #77 to be 10-1 cm2/s or 10'19m2/s. Since I had two estimates for D,,, (10- 3 and 10'1 9m2/s), I used 1016 ' m2/s as a compromise value.
Parameter Units Value Reference
Diffusion coefficient m2/s 10'3 or 10.19 Text (adapted from Stein (1986)
Dm used: 10-'6 and Schwarzenbach et al.
(1993))
c Lipid-water partition coefficient
Kiw Non-dim 106.33 Stange and Swackhamer (1994)
Surface area of protist
SAprot ilm 2 1.2 X 10⁻⁹ From SA=4x7r2and r=0lgm Width of cellular membrane
Az m 5 X 10⁻⁹ Alberts et al. (1983)
Clearance rate
CR mL/s 9.4 X 10-'0 Caron et al. (1985)
Bacterial concentration
= BC cells/mL 107 Experimental condition
,e Bacterial volume
BV m3/cell 5.2 X 10d9 From V=4/3 7r3and r=0.5pgm
Fraction lipid in bacterial cell
Flip Non-dim 0.15 Swackhamer and Skoglund
(1993) Table 2-1. Parameters used in estimates of uptake rates via diffusion and ingestion.
This calculation also does not include any membrane effects due to incorporation of PCBs within the membrane. Work by Sikkeman et al. (1994) has shown that even small concentrations (0.01 ljmol / mg phospholipid) of hydrophobic compounds in the membrane caused an expansion of the membrane. This swelling resulted in increased membrane fluidity and permeability. Hydrophobic compounds accumulated in the hydrophobic interior of the phospholipid bilayer according to a lipid-water partition coefficient which was in turn related (log-linear) to the octanol-water partition
coefficient. Their study did not find increased uptake due to membrane changes; instead contaminant concentrations in the membrane adhered to physico-chemical expectations.
Uptake via ingestion is equal to prey ingestion rate multiplied by the prey CB concentration as expressed by the following equation:
(5)
[d[C],,r = CR * BC * BV * [CBLacwhere [CB]prot and [CB]bact are the CB concentrations in the protozoa and the bacteria (mol CB/m3), respectively; CR is the protozoan clearance rate (mL/s); BC is the bacterial concentration (cells/mL); and BV is the bacterial cell volume (m3/cell). [CB]bact is the
product of the bacterial lipid fraction (Flip), the lipid-water partition coefficient (K), and the dissolved CB concentration ([CB]d). The ratio of diffusive uptake (Dif) to ingested uptake (Ing) shows the relative speed of CB influx via the two methods and is
represented by the following equation:
(6) Diff D, *K,,, *SAp,,, *[CB 3.3X10⁴
Ing Az*CR*BC*BV*Fi * K,, *[CB],
Using the parameters described above, this estimate for the diffusion of a
tetrachlorobiphenyl predicts that diffusion through the membrane delivers PCBs faster to the cell than ingestion of contaminated prey by a factor of 104. This is an end-member estimate because a reasonably low value for diffusive uptake (middle of range of Dm) and the upper limit for ingested uptake (100% assimilation at maximum clearance rate) are used.
As mentioned above, diffusion through the unstirred water boundary layer is not addressed in this calculation because of the complication of the cilia on the surface of the protozoan cell. An estimate of the importance of a diffusive boundary layer can be calculated (presented in full in Appendix A). This "back-of-the-envelope" calculation suggested that a boundary layer of 1 00pm or larger would impede the rate of diffusive uptake such that ingestion could become the dominant uptake pathway (if diffusion rate = 3.3X10⁴*ingestion rate). Since the organisms in this study are approximately 10-15pm in diameter, a diffusive boundary layer of 11 00p.m is most likely unrealistically large. In addition, the organisms are swimming through the water, essentially lowering the boundary layer thickness even more. It is unlikely, then, that the presence of a diffusive boundary layer surrounding the ciliate will inhibit diffusive uptake of PCBs. In addition, this equation does not include ingestion of PCBs associated with DOC. See Chapter 3 for a complete discussion.
In this chapter, I present the results of a study designed to verify experimentally the predicted significance of diffusion and ingestion as CB uptake pathways in
protozoans. I compared CB uptake in prey-limited and prey-replete laboratory cultures of protozoa. Bioconcentration factors were calculated and compared in the two
experimental treatments. These results showed that diffusion was the dominant uptake pathway and that protozoa rapidly equilibrated with dissolved CB concentrations in the surrounding aqueous medium. To quantify the diffusion process in this system,
protozoan uptake and loss rate constants were measured using a radio-labeled congener. These rate constants were compared with an estimated bacterial loss constant using a four-box numerical model. The model results were consistent with the timing of equilibration observed in the original bioaccumulation experiment.
2.3. Methods
2.3.1. Growth of organisms
Vineyard Sound seawater (VSW) was used in all growth media. The seawater was collected using a Masterflex pump in the spring of 1998 during an incoming tide, Woods