Economic Assessment of Candidate Materials for Key Components in a
Grid-Scale Liquid Metal Battery
by
Michael C. Parent
B.S. Chemical Engineering
Louisiana State University, 2009
Submitted to the Department of Materials Science and Engineering in Partial Fulfillment of the
Requirements for the Degree of
Master of Science in Materials Science and Engineering
At the
Massachusetts Institute of Technology
June 2011
@2011
Massachusetts Institute of Technology. All rights reserved.
OF TECHNOLOGY I
DEC 2 1 2011
LIBRARIES
ARCHIVES
-~1
Signature of Author:
rtment
of
Materials Science and Engineering
April 28, 2011
Certified by :
Donald R. Sadoway
John F Elliott Professor of Materials Chemistry
Ax Thesis prisor
Accepted by:
Christopher Schuh
Chair, Departmental Committee on Graduate Students
Economic Assessment of Candidate Materials for Key Components in a
Grid-Scale Liquid Metal Battery
by Michael C. Parent
Submitted to the Department of Materials Science and Engineering on April 28, 2011 in Partial Fulfillment of the Requirements for the Degree of
Master of Science in Materials Science and Engineering
ABSTRACT
In order to satisfy the growing demand for renewable resources as a supply of electricity, much effort is being placed toward the development of battery energy storage systems that can effectively interface these new sources with today's electric grid. To be competitive with the prices dictated by the sources currently in use, namely fossil fuels, these new systems must be able to deliver energy at a cost of about $100/kWh for the active materials. Several battery systems have been developed and that target has been slowly coming into focus. The liquid metal battery attempts to redefine the typical storage system by maintaining components in a molten state and seeks to do so using cheap, widely available materials. One of the biggest problems facing the future of the LMB is that of resource scarcity. There are several candidate materials that can satisfy the operating needs of an LMB, but not all are available in large enough quantities to meet the new LMB demand without significant impact to the supply/demand equilibrium and, ultimately, price. A detailed model was built to investigate the use of various metals in this new technology and measure the impact expected as a result of large-scale LMB adoption. The report explains why antimony is the most likely candidate for the positive electrode due to its large, mature market and the relatively high energy output compared to other candidates. Alkali and alkaline earth materials make excellent candidates for the negative electrode and the vast quantities available will be more than enough to support the LMB market many times over.
The analysis has also revealed a substantial concern that is often overlooked in battery development: electrolyte costs. The current use of ultra-pure, anhydrous salts cannot be sustained if the LMB is to be profitable and competitive. Large savings can be anticipated from purchasing tonnage-quantity salts, but the only way to bring these costs down to reasonable levels is through the use of lower-purity materials. This study shows that a reasonable LMB can be built with an active materials cost of less than $62/kWh and total system cost of around $1,000/kWh for a 1 MW facility. In the most optimistic case, assuming electrolyte costs on par with those of current battery technologies, the total sytem cost can be reduced to under $300/kWh, much cheaper than many of the most recent technologies.
Thesis Supervisor: Donald R. Sadoway
ACKNOWLEDGEMENTS:
I would like to give sincere thanks to Professor Sadoway for accepting me into his group and allowing me to pursue a project closely linked to my personal interests. I thoroughly enjoyed this work and it helped me to explore newfound penchants that I would not have discovered otherwise.
Thank you to Dr. Luis Ortiz for all of his help and encouragement throughout the project and for pointing me to various, invaluable resources through his plethora of connections.
I would also like to thank Rich Roth, Elisa Alonso and Elsa Olivetti who were invaluable in helping me understand the dynamics in the world of commodities and how to use regression analysis to quantify them.
Thanks, also, to the rest of Group Sadoway for their help, directly and indirectly, in gaining a sound understanding of the liquid metal battery technology. Their dedication to the project was a constant source of inspiration.
I must also thank my parents, Larry and Ritza Parent, for their undying support of everything I've ever attempted, my sister, Ashley Holden, for always being so proud of me and for training me to love learning even before I started pre-school and Neelam Phadtare for her constant words of empathy and encouragement when things got difficult.
Table of Contents
Table of Contents...6 index of Figures...8 Index of Tables ... 9 1. Introduction...11 1.1 Current Technologies...13 1.2 Viability M etrics ... 141.3 The Liquid M etal Battery ... 18
1.3.1 Conceptualization ... 18
1.3.2 M anufacturing Targets ... 20
1.4 M ethodolgy... 21
2. LM B Electrodes...23
2.1 Bism uth as a Positive Electrode ... 24
2.1.1 Bism uth Regression Analysis ... 26
2.1.2 Bism uth Qualitative Analysis ... 31
2.1.3 Bism uth Results ... 34
2.2 Antimony as a Positive Electrode... 35
2.2.1 Antim ony Regression Analysis ... 37
2.2.2 Antim ony Qualitative Analysis ... 39
2.2.3 Antim ony Results ... 42
2.3 Negative Electrodes ... 43
2.3.1 Strontium ... 44
2.3.2 Lithium ... 46
2.3.3 Negative Electrode Results... 52
3. M olten Salt Electrolyte ... 53
3.1 Electrolyte Salts... 53
3.2 Low-Purity versus High-Purity ... 55
3.3 In-House Refinem ent ... 60
3.3.1 Cost of Goods Sold...60
3.3.2 Processing Costs ... 61
3.3.3 Processing Costs for LiBr ... ... 64
3.4 Electrolyte Results...66
4. System Costs ... 69
4.1 Storage M edium ... ... 69
4.1.1 Negative Current Collector... 69
4.1.2 Positive Current Collector ... ... ... ... 72
4.2 Cell Enclosure and Construction ... 73
4.2.1 Insulation . ... 74
4.2.2 W iring t... .ti... .74
4.2.3 Insulating Sheath ... 75
4.2.4 Cell Construction s... 76
4.3 Battery Enclosure...76
4.4 Power Conversion System ... ... 377
5. 1M B M anufacturing ... 83
5.1 Battery Com parisons... 83
5.2 [M B Impact... 85
6. Conclusions... 88
W orks Cited ... 90
Appendix A: Battery Cost M odel...94
Appendix B: Im pact Projections...96
Index of Figures
Figure 1.1: Interm ittent nature of solar and wind energy... 12
Figure 1.2: Illustration of the alum inum sm elting process ... 19
Figure 1.3: Illustration of the LM B process... 20
Figure 2.1: Binary phase diagram for calcium and bismuth ... 23
Figure 2.2: Historical price of bism uth... 25
Figure 2.3: Lead production versus GDP of China and U.S. ... 27
Figure 2.4: Response of bismuth price versus selected variables (1st iteration) ... 28
Figure 2.5: Response of bismuth price versus selected variables (2nd iteration)...29
Figure 2.6: Regression results for bismuth production (final iteration)... 30
Figure 2.7: Plot showing relation between bismuth price and production in Bolivia ... 32
Figure 2.8: Bolivian bismuth plot showing little to no production beneath cutoff price ... 33
Figure 2.9: U.S. antim ony consum ption ... 36
Figure 2.10: Regression results for antimony price (1st iteration)... 37
Figure 2.11: Regression results for antimony price (final iteration)... 38
Figure 2.12: Regression results for antimony production (final iteration) ... 39
Figure 2.13: Antimony production in the United States has fallen dramatically...40
Figure 2.14: Relative costs of LM B active com ponents ... 43
Figure 2.15: Graph comparing world production of strontium to U.S. consumption of strontium...45
Figure 2.16: Geographical diversity of strontium production over the past decade ... 46
Figure 2.17: Real price of lithium carbonate in 2009 dollars... 47
Figure 2.18: Roskill graph showing the consumption of lithium by end-use for the past decade ... 48
Figure 2.19: Lithium price and production over time illustrating the effect of real demand on prices...49
Figure 2.20: Lithium price and w orld reserves ... 50
Figure 3.1: Phase diagram for Nal in NaC ... 54
Figure 3.2: Energy costs for low-purity electrolyte salts based on specific battery chemistries...56
Figure 3.3: Energy costs for high-purity electrolyte salts based on specific battery chemistries.. ... 57
Figure 3.4: Commoditized plot for LiBr reflecting the cost of refining ... 58
Figure 3.5: Relative fractions of costs incurred by a lab supplier, which are covered by the sales price .. 61
Figure 3.6: Detailed breakdown of costs covered by the retail price of a generic electrolyte salt ... 64
Figure 3.7: Cost breakdown for high-purity LiBr. Values are per kilogram of salt ... 65
Figure 4.1: Binary phase diagram of iron and lithium is representative of the other alkali metals...70
Figure 4.2: Binary phase diagram of iron and calcium... 71
Figure 4.3: Binary phase diagram for iron and antimony showing the possibility of alloying...72
Figure 4.4: Sim ple illustration of an LM B cell ... 74
Figure 4.5: Economies of scale for power conversion systems using results from. ... 77
Figure 4.6: Power law regression on PCS data from Sandia report ... 80
Figure 4.7: Power law regression performed with new PCS prices from Raytheon ... 81
Index of Tables
Table 1.1: Summary of storage technologies and the storage cost...18
Table 2.1: Trend of antim ony content in SLI batteries ... 41
Table 3.1: Comparison of electrolyte costs across three battery chemistries. ... 59
Table 3.2: Summary of regression results for electrolyte salts ... 62
Table 3.3: Comparison of costs of electrolytes made in-house versus retail ... 66
Table 4.1: Results of corrosion experim ents ... 73
Table 4.2: Sum m ary of PCS costs in the Sandia study ... 79
Table 5.1: Cost com parison for various LM B systems ... 84
Table 5.2: System cost comparison of LMB with current battery technologies...85
Table 5.3: LMB impact as a percent of annual world production for a SrBi cell ... 86
1. Introduction
On August 14, 2003 a massive blackout occurred that spread throughout the Northeast and Midwest of the United States and southeastern Canada. The effects reached 10 million people in Ontario and 45 million people in eight states and it all occurred within a few hours. A similar incident occurred in 1965. Back then, the infrastructure of the grid looked very much like the one we currently utilize, despite the fact that annual consumption of electricity has grown by 80% from about 16,000 TWh in 1965 to 29,000 TWh in 2008 (1). In fact, many wires in the New York City grid are over 50 years old (2). Conditions like this are the reasons why the United States is known as a "superpower with a third-world electricity grid." We are constantly reminded by events like the Northeast Blackout that our country's electricity grid can barely support the demand imposed upon it. And, unless the grid experiences a drastic modernization, we will encounter those events with increasing frequency and severity in the near future.
The most promising method of fixing this problem is bulk energy storage. Currently, the electricity markets operate with an instantaneous dynamic. In other words, "electricity must be produced when it is needed and used once it is produced (3)." Bulk energy storage would fundamentally change this principle and allow producers and, in some cases, consumers to store the energy for later use. This creates numerous benefits for the economy and the environment. Stored energy can be used to satisfy peak demand without putting any extra strain on the generators' resources. In turn, consumers will receive much more reliable electricity and producers will maintain efficiency. In addition, having a backup reserve in storage media will reduce or eliminate the need for facilities such as coal-powered peaker units and, thus, have favorable environmental impacts. Not only will bulk energy storage improve the environment through decreased use of hydrocarbons like coal, but it will also open the way for increased use of renewable energy sources that can reduce our dependence on fossil fuels entirely.
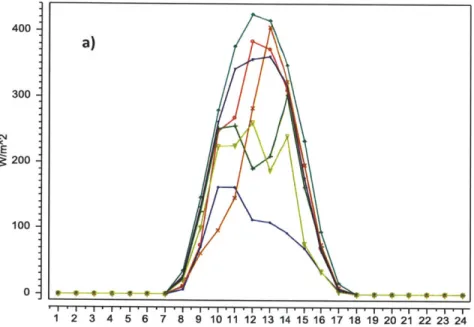
Several technologies currently exist to make use of renewable energy sources like the sun and wind. In fact, the technologies themselves are already pretty reliable but the same cannot be said for the energy sources. Sunlight and wind are notoriously intermittent. Unless you are in a tropical region or at high altitudes, sunlight and wind will come and go with no predictable pattern. Figure 1.1 illustrates the intermittency of solar radiation and wind speed. As the graphs show, the amount of solar radiation that reaches the ground consistently peaks during the day; however, the intensity is not predictable. Since the amount of energy able to be generated from the sun varies directly with intensity, this means that there will not be a reliably consistent source of energy. Similarly for wind generation, speeds vary
dramatically throughout the day and week, which makes another unreliable energy source. Bulk storage can solve this problem by storing the energy as it becomes available and distributing it to consumers as it is needed. This will alleviate the adverse effects that arise from a mismatch between the amount of electricity demanded and the amount supplied.
400 -300 -200 -100 - 0-' I ' I I ' ' "8 ' '"9' 1 I . I .- .1 . i . . . i . - ' 1 2 3 4 5 6 7 8 91011 12 13 14 15 16 17 18 19 20 21 22 23 24 12 - 10- 9- 8- 7-6 5-4 3- 2- 10 -i
i
i 3 T 5 6 7 " 8 " .I
1 m I I 2 15 I 71
9 2 0 2 - . 2 I. 3I
2. - . 1 2 3 4 5 6 7 8 9 10 11 12 13 14 15 16 17 18 19 20 21 22 23 24Figure 1.1: a) Solar radiation reaches a peak during the day time but its intensity varies widely. Each color represents a different day of the week.
b) Wind speed is very erratic during the course of a week. Each color represents a different day.
1.1 Current Technologies
Several forms of bulk energy storage currently exist and more are being developed. Some are in the form of batteries while others are much larger, complex structures. Pumped hydro electric storage (PHES) is the most prevalent technology for large-scale energy storage on power systems today (5). Pumped storage uses the potential energy between two vertically displaced bodies of water to generate electricity. During peak demand, a pumped hydro facility will release water from the top reservoir which will fall and rotate a turbine that generates electricity. Then during off-peak periods (at night for instance) the facility will use the power from the electric grid to pump water from the lower reservoir back to the top. Due to efficiency losses during the pumping of water, a pumped hydro facility is a net user of electricity; however, it generates profit by consuming cheap, off-peak electricity and selling it during peak demand where prices are higher. There have been several advances recently in the areas of turbine and pump design, which have improved efficiencies and response times for these large storage structures. In 2005 there were plants operating in many different countries totaling about 90 GW of available power, where typical plants can generate from 250-2000 MW for discharge times of four or more hours (5).
Another physically large method of storage is the compressed air energy storage system (CAES). Compressed air energy storage actually uses hydrocarbon fuel to generate electricity but the efficiency is greatly increased through the use of compressed air because, rather than recovering the energy directly using an air turbine, the compressed air would be fed into the combustion chamber of a gas turbine. Similar to pumped hydro, CAES uses off-peak electricity to compress the air which it then stores, usually in underground caverns. With CAES, the air is pre-compressed cheaply and then used when electricity is needed. This results in energy consumption on the order of 40% less than
conventional gas turbine peaking units with no loss in output (6). There were only two CAES plants in the world as of 2005, including a 2600 MWh plant in Alabama, but plans have been proposed to construct more (5).
Lead-acid (LA) batteries are well-known for their use in automobiles, usually as starting-lighting-ignition (SLI) battery units. As an SLI unit, these batteries are capable of delivering a high current pulse but for a short period of time, ideal for starting a vehicle. The lead-acid technology, however, is versatile and has
been adapted to grid storage in many different applications such as peak shaving, load leveling and spinning reserve. Since 1980, several installations have been built worldwide from a 400 kWh plant in Germany to a 40 MWh plant in California. Storage systems like the lead-acid battery are very important
because they allow for transmission and distribution facility deferral. In other words, instead of building new transmission lines, distribution lines and transformers power companies can supplement existing networks with easily sited battery components (7).
One of the more recent developments in battery technologies came in the form of high-temperature technologies like the sodium-sulfur (NaS) battery and introduced a markedly different operating
principle from traditional batteries. The NaS battery operates at temperatures where the two electrodes (sodium and sulfur) exist in a liquid state. High temperatures (300*C-3500C) and liquid
electrodes allow for very fast kinetics within the NaS battery and make them ideal for stationary storage applications where large units can be safely operated. The technology was originally developed by Ford
Motor Company in the 1960s for use in electric vehicles but was commercialized for storage purposes by NGK Insulators, Inc in Japan. There are still high costs involved with building the battery for large-scale applications but there are a few large installations around the world (8). The largest NaS battery in the
Unites States is a 32 MWh unit in Texas (9).
With the importance and excitement of the NaS battery a lot of research went into making the
technology even better. One of the results is the sodium-nickel chloride battery, or ZEBRA battery. The ZEBRA battery is very closely related to the NaS battery. In fact, ZEBRA cells use liquid sodium as the negative electrode as well as a beta-alumina solid electrolyte for separation. Where the ZEBRA battery differs is in the positive electrode, which is made of nickel chloride, and also with the existence of a second, liquid electrolyte (sodium chloroaluminate), which gives it the classification of a molten salt battery. These batteries were initially developed with uses in electric vehicles as the main focus but there have been recent investigations into more stationary applications, like uninterrupted power supply services. The extremely long life cycle of these batteries (3,500 cycles at 100% DOD) can potentially offset the much higher costs of production, especially in hot climates that require frequent cycling (10).
1.2 Viability Metrics
We can see that several different technologies exist to satisfy the need for bulk energy storage ranging from the classical use of mechanics to the use of novel molten electrode batteries. Of course, not all methods are interchangeable and so it is important to examine the metrics by which a particular technology is deemed appropriate for a given application. One of the first limitations to consider,
especially with a group of technologies like those listed above is the geographic footprint. Basically, the units should be in relatively close proximity to the consumer(s) they are serving. The transmission of electricity is, quite literally, lightning fast so being directly adjacent to the consumer is not necessary; however, transmission losses are inevitable and become more significant the longer it has to travel. Since many of these storage units/facilities will be used for purposes like power quality and peak
shaving, it is important to minimize as many disruptive variables as possible, distance being one of them. For example, a town in the desert can benefit from energy storage devices to help satisfy demand during the hottest part of the day. It is unlikely that a pumped hydro storage facility will be a valid solution, simply because it cannot be built since there is no water nearby. Similarly, there could be small town near a water source, surrounded by beautiful scenery. Neither a pumped hydro nor CAES facility is likely to be built because they both require a lot of land and a significant amount of environmental development, which is likely to be met with strong opposition. In both of these scenarios, smaller, more portable battery facilities could provide a more acceptable solution.
Another metric to consider when developing storage facilities is the life cycle of the technology being implemented, which can be expressed as number of cycles before replacement or as the number of calendar years before replacement. For a given technology, a longer life span is obviously preferred because it reduces the overall cost of operation. Intuition says that the PHES and CAES facilities would offer the longest lifetime, which is correct. Their usable lives are found to be over 10,000 cycles or more than 25 years for PHES (longer for the actual dam) and over 5,000 cycles or more than 10 years for CAES (11). This is not surprising given the sheer magnitude of the projects and since any significant
maintenance would be both time consuming and costly; they are built to last. Batteries, on the other hand, are much more manageable and require much less capital expenditure as far as construction goes. As a result, shorter life spans are acceptable, but there have been many exciting technologies developed such that some batteries have exceedingly long lives. The lead-acid battery has one of the shortest life spans (~1,000 cycles and 7-15 years) but also requires the least amount of investment costs. Due to their ease of maintenance, often involving little more than venting and refilling with water, LA batteries are still a competitive choice but are expected to lose market share as innovations work to lower the costs of better performing batteries (11). The NaS battery is particularly robust unit due to the raw materials it uses and the operating parameters under which it can perform. Drastic cost reductions have been realized as more work goes into scaling up the technology and their cycle life can range from 2,500-4,500 cycles over a span of 15 years. Although ZEBRA batteries have not yet been implemented into a large-scale storage project, units developed for the auto industry show some promising
characteristics. Sudworth shows that a 32 Ah cell can complete over 3,000 full cycles with only slight losses in capacity (12) and Dustmann has shown stable capacity performance over a span of 11 years with over 3,500 cycles (10). It is obvious from these statistics that when developing a new battery technology, cycle and calendar lives are very important metrics to optimize.
As usual, whenever considering potential markets for any products the costs associated with operating it are of utmost importance. A useful metric to look at when examining energy storage technologies is the cost of energy storage in dollars per kilowatt-hour ($/kWh). In the area of energy storage, $/kWh can
be a much better gauge of costs than the often cited $/kW. Batteries can have a very high power rating but only be able to deliver it for a very short amount of time. Basing the cost off of the rated power introduces a lot of ambiguity when trying to compare different technologies; therefore, normalizing by the total amount of energy capable of being stored makes cost advantages much more transparent.
Energy costs can vary widely across different storage technologies. Due to their very large size, PHES and CAES both have extremely low unit storage costs at $10/kWh and $1/kWh, respectively (13). The vast amounts of generation source for both facilities means they can provide power for a very long time, thus driving down the unit cost. Of course, this would be slightly offset by the enormous costs
associated with building the facilities. Such low costs are likely never to be reached by a battery technology, which puts PHES and CAES in a different category as far as selecting a technology is concerned. For example, when we look at the cost of a lead-acid battery at around $150/kWh (14) it appears to be expensive relative to CAES, but these two will never really be in competition for the same application. Lead-acid batteries are actually among the cheapest battery chemistries. According to the Tokyo Electric Power Company, mass production of NaS batteries should drive the storage costs down to around $250/kWh (15). Although nearly twice the cost of the LA battery, the long lifetime of the NaS battery works to reduce the total cost. It is difficult to get a storage cost for the ZEBRA batteries because none have been deployed for large-scale, grid energy storage. In 1990, the California Air
Resources Board set a goal for batteries in electric vehicles to cost less than $150/kWh and, at the time, first production of the batteries came out around $300/kWh (16). While expensive now, both NaS and ZEBRA batteries are expected to benefit from continued innovation and economies of scale such that their prices can decline toward a $100-$150/kWh target.
Costs can also vary widely among different battery chemistries. In general, the prices cited for batteries are relative to the active materials involved in the generation of electricity. Basing costs off of the active materials makes it easier to compare the chemistries, but can also leave out very important information
with regards to application. Some battery chemistries and operating conditions are very harsh and will require specialized materials to construct the physical housing. These can add significantly to the total cost and can even turn a promising technology into an economically infeasible one. For the purposes of this work, however, the active materials cost will be studied in depth and a look at the secondary costs will be provided later.
One of the biggest drivers that can determine the cost of storage is the availability of the materials being used. If the materials necessary to make the battery chemistry work are difficult to find, the costs will inevitably be higher. Two qualities by which a metal can be judged affordable are its abundance and recyclability. Naturally, an abundant metal will be easily accessible for producers and will ultimately become commoditized as several competitors enter the supply market, which will drive the price down for the battery manufacturers. Recyclability, in this context, refers mostly to the ease with which the metal can be recovered from a spent battery. A metal with high recyclability will have favorable pricing over others that have low rates because recycling creates a whole new source of supply. All of the batteries discussed so far utilize materials that satisfy these conditions. The LA battery uses lead and lead oxide, which constitute one of the largest commodity markets in the world, so there is no shortage of lead. Furthermore, lead can be easily recovered from old batteries, which also means it makes up one of the largest markets for secondary metals. In fact, the lead-acid battery is famous for having over 96% recycling rate, meaning that 96% of the batteries retired each year are recycled (17). According to
USGS, most of the lead recovered from this 96% are used to make new batteries. This illustrates perfectly why the LA battery is one of the cheapest alternatives for battery energy storage.
Useful Life
Cost
Technology
Cycles
(years)
($/kWh)
Footprint
Reference
PHES
10,000
25+
10
Very large
(13)
CAES 5,000 10+ 1 Very large (13)
LA 1,000 5-7 150 Custom (14)
NaS 3,000 15 250 Custom (15)
ZEBRA 3,000+ 10+ 300 Custom (16)
Table 1.1: Summary of storage technologies and the storage cost (of active materials)
Obviously, it is important to be judicious in the choice of materials as any new technology is being developed. The problem becomes even more salient when developing new batteries because not all cheap materials will possess the desired electrochemical properties. If the materials do not produce a reasonable open circuit potential, it will not matter how cheaply they can be obtained. Further
difficulties arise when having to select an appropriate, cheap electrolyte because not everything will conduct the right ions and not everything can withstand the operating conditions being targeted. Many salt electrolytes used in batteries today have voltage limits, beyond which they begin to break down,
rendering the battery useless. The materials selection process is definitely the most complicated optimization problem when designing a new battery.
1.3 The Liquid Metal Battery
1.3.1 Conceptualization
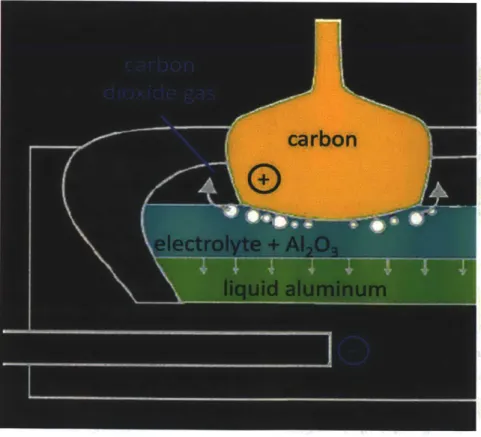
Inspired by an ordinary aluminum smelter, the liquid metal battery (LMB) was conceptualized by reversing the process and turning a smelter from a huge current sink into a current generator. A typical
smelter produces aluminum via the Heroult process and is shown in Figure 1.2 below. A single Hall-Heroult cell consists of a pure carbon anode opposite a metal cathode that is usually carbon coated. In between the electrodes is cryolite (Na3AIF6) which dissolves alumina (A1203) and serves as the electrolyte
for the process. A potential of 3-5 volts is then applied between the plates with a current on the order of 100,000 amperes or more. Operating at a temperature well above 1,000 "F, pure liquid aluminum is deposited at the cathode and can be siphoned off for further refining. This is essentially a unidirectional process and the reason can be seen from the overall reaction:
2Al203 + 3C -) 4Al(s) + 3CO2
This reaction releases carbon dioxide gas which cannot be recovered and, thus, the process cannot be run in reverse. The inspiration for the LMB came from the idea that if the smelter utilizes so much electricity to produce aluminum, would it be possible to run the reaction in reverse to generate large amounts of electricity? Of course the answer is "no" due to the release of carbon dioxide, but there
may be a different chemistry that can prove more effective.
Figure 1.2: Illustration of the aluminum smelting process
The idea was conceived to develop a technology that would eliminate gas as a byproduct by using pure metallic electrodes with a molten salt in between. Staying true to its inspiration, the liquid metal
battery looks very similar to an aluminum smelting pot (see Figure 1.3). The major difference is that the
battery is operated at a high enough temperature so that all materials inside are kept in a liquid state,
including the electrodes. The molten salt electrolyte is chosen such that it has relatively low electronic
conductivity but a very high ionic conductivity of
A".
Upon discharge, ions from the negative electrode
diffuse through the molten salt layer and form a liquid-phase alloy with the positive electrode. The only
thing released would be electrons and reversing the reaction upon charging would bring the battery
almost exactly to its original state. With no solid components, there is minimal concern of dendritic
growths that often plague battery life spans, even with 100% depth of discharge (DOD). With careful
selection of the materials, a battery can be made with a reasonable voltage and very cheap metals. By
taking advantage of differences in densities, the battery would be self-assembling and proper insulation
would make it self-heating.
0
Figure 1.3: Illustration of the LMB process.
1.3.2 Manufacturing Targets
One of the most promising applications for an LMB is in the area of renewable energy and its integration
into our nation's electric grid. As discussed previously, the intermittency of renewable energy makes it
impossible to integrate effectively without some mode of energy storage. Extracting energy from
renewable sources is already an expensive task, so the technology used to store it should be as cheap as
possible to make renewables a competitive option. Therefore, special care must be taken to develop a
cheap LMB. In this case "cheap" means a cost of around $100/kWh for the active materials (electrodes).
Several couples exist that can yield a reasonable battery and many may even meet the $100/kWh target, but for a new technology like the LMB, there are other dynamics to consider. Specifically, it does no good to develop a technology that works perfectly but cannot be scaled up. The eventual storage target for the LMB is 20% of renewable generation. By 2025, solar and wind-generated electricity is estimated to supply over 200 BkWh of America's energy needs (18), which means the LMB will store 40
BkWh. With the average LMB facility size expected to be around 1 MWh, a lot of LMBs will be manufactured and a lot of metal will need to be consumed. When such large quantities of a material are needed there is the possibility of disrupting the supply/demand balance that drives all aspects of our economy. This is especially true for metals that currently have small demand volumes, some of which are LMB candidate materials. As a result, a metal that starts out cheap enough to use in the LMB can
become too costly if the new demand just cannot be supported by current supply.
This analysis attempts to investigate these dynamics as they apply to some of the more promising candidate materials. A detailed model was built to estimate the current costs associated with building different permutations of the LMB as well as predicting the economic impact that a large-scale
operation would have on the metals chosen. Rather than attempting to predict an exact price for a metal under the influence of LMB, 20 years into the future, this study uses a combination of quantitative methods and qualitative interpretations to determine the feasibility of pursuing a candidate material.
1.4 Methodolgy
Time-series regression provides the basis for analyses in this study and is widely used in the field of the economics of commodities. This technique can be used to create a very accurate price model for a
metal that includes several different layers of dynamics, but even the most advanced models cannot be relied upon to accurately predict the future price of a commodity. Because this study is interested in making an estimate of future manufacturing costs for the LMB, a simple regression was performed more to establish a direction of price movement and a general price level than to predict what an LMB
producer will be paying for a metal 20 years into the future.
The first step in performing a regression is to create a list of all possible variables that could be used to explain the movement in the dependent variable (price, in this case). A regression is run with this initial
list and the results are examined to determine which variables are statistically significant. This study adopted a 95% confidence for all regressions, meaning variables are only statistically significant if the
p-value is less than 0.05. The insignificant variables were then removed and a new regression performed. This was repeated until all remaining variables were statistically significant. One interesting aspect of time-series regression is that a correlation can be found between all sorts of variables, even if they are not related. Therefore, it is important to include variables that can actually be used to form some kind of story about the dependent value.
In the end, an attempt was made to establish models using similar variables that could easily be implemented into a detailed cost model. The cost model was built with the goal of creating a program that would allow the user to choose aspects of a battery and obtain a materials cost breakdown as well as view the impact that the battery would have on the electrodes chosen. Having a standardized model is another reason that a simple regression model was sufficient.
2. LMB Electrodes
Two characteristics for ideal electrodes have been discussed already: low cost and dissimilar densities.
A third quality, low melting temperature, is implied since the electrodes must be liquid at reasonable
operating temperatures. Unfortunately, satisfying these three qualities does not make a functioning
battery. This introduces another criterion for the selection of materials, which is the degree of alloying
between the mobile species and the positive electrode. The selection of proper metals is highly
dependent on the phase diagram that exists between two candidate materials. In general, a large
two-phase region indicates a larger, theoretical capacity for that couple and the presence of an intermetallic
marks the limit for the battery's depth of discharge. For a given temperature, once the intermetallic
phase is reached, the electrode will become a solid and no more charge can be stored. Figure 2.1 shows
an example of a phase diagram for two candidate materials bismuth (positive electrode) and calcium
(negative electrode).
100
Ca
Figure 2.1: Binary phase diagram for calcium and bismuth (19)
0
10
20
30
40
50
0
70 80 90At 60% calcium in bismuth there is a prominent intermetallic phase that is stable up to 1,356 *C and if we ignore the actual metals, that large peak could shift anywhere on the graph for some arbitrary couple. As the peak shifts left and right, at a given temperature below the intermetallic, a battery with these metals will lose and gain capacity since the total amount of electrons transferred will change as well. Therefore, when choosing a couple, the LMB manufacturer will not want the large peak to be too close to the positive electrode metal because that will greatly limit the battery's capacity. The calcium-bismuth diagram also exhibits a favorable feature to the left of the peak where there is a rather large liquid regime, even for fairly low temperatures, which would give the LMB more freedom in the
optimization of operating parameters. A look at the binary phase diagram for any potential couple is the first step in designing an LMB cell.
As it turns out, the metals that satisfy these criteria as a positive electrode are the semimetals that occur near the steps of the periodic table between the metals and nonmetals. Based on preliminary findings, bismuth and antimony provide the most promising options. The elements in this region happen to be fairly electronegative, which means selecting an electropositive metal from the other side of the periodic table could result in a decent cell voltage. That means that the alkali and alkaline-earth metals are very good candidates for the negative electrode (mobile species).
2.1 Bismuth as a Positive Electrode
Several characteristics must be considered when selecting a material for the cathode in a liquid metal battery and a balance must ultimately be reached between them. Besides price, of utmost importance is that the metal have a high density relative to the other components and that the metal have a sufficiently lo w melting point. Although higher temperatures can lead to enhanced battery performance due to faster kinetics, limits must be set if the technology is to provide storage with reasonable operating parameters. One metal that easily satisfies these two qualities with a molecular weight of 209 g/mol and melting point just slightly higher than 270 *C is bismuth. In addition, when paired with several different cations, a bismuth cathode can produce an average open circuit voltage of around 0.6-0.7 V (20). Together, these numbers seem to make bismuth an ideal candidate for the liquid metal battery. Ultimately, of course, there is one remaining variable that can make or break a material that is otherwise perfect and that is price. For the month of September (2010), the average price for bismuth according to metalprices.com was about $20/kg. Preliminary analysis of the battery chemistry
has shown that this price level is too high, leading to an energy cost which, at over $280/kWh, is more
than twice our target of $100/kWh for active materials.
Based on the direct cost analysis, it makes sense to examine alternative cathode materials; however, a
more comprehensive study is not without merit. A quick look at the historical price of bismuth reveals
an interesting trend (Figure 2.2). Besides having a couple of periods of drastic price appreciation, after
the most recent crash in the late 1970's the price of bismuth seems to have found a floor at around
$10/kg. In fact, when looking at the price action over the past two decades, it appears that the $20/kg
price is actually on the high side and could soon reach a more attractive level. The fact that this
question may be raised indicates that a more extensive model of bismuth price is warranted.
Specifically, great insight can be gained from examining the effects of supply and demand on the metal.
70* $66.82/k 60- 50- ,40-iz 30 - a- 20- 10-1 $6.63/k-1970 1975 1980 1985 1990 1995 2000 2005 2010 Year
Figure 2.2: Historical price of bismuth (in constant, 2009 dollars) (21)
The liquid metal battery technology, ideally, will have a huge impact on the demand for the metals being
used. A large increase in demand will create a shortage of supply, and economic forces will
consequently drive the price higher. From here, price action will proceed along one of two paths. In the
first path, a new equilibrium between supply and demand will be reached at the higher price and the
technology will need to be reevaluated for profitability. In traditional economics, this opens the door for
newer and cheaper substitutes that can ultimately drive the price back to more appealing levels. A
different material can certainly be evaluated in the case of the LMB, but there is no guarantee that the
optimized operating conditions will be regained. In the mining industry, another dynamic exists that can lead prices down a second path. Once prices rise to a certain level, more competition will enter the market looking to capitalize on the rich premiums. As time goes on, these new competitors may discover more efficient modes of extraction that can then lead to cheaper prices. Although prices may fall beneath their original threshold, the new entrants can actually remain if they were able to
successfully implement the new efficiencies that did not exist upon market entry.
The question of which of these two paths the metal will take is one that a more in-depth analysis aims to answer. In particular, a time-series regression analysis can be conducted to determine certain variables that effectively model the price of bismuth going forward and how it will react to a disruptive
technology, such as the liquid metal battery.
2.1.1 Bismuth Regression Analysis
As mentioned, a list of possible explanatory variables was first constructed. A clear choice is bismuth production which, in this analysis, refers to the amount of primary bismuth concentrate that is removed from the world's mines. Basic economics says that price and supply are tightly correlated. To ensure completeness, it is important to understand a little about the production of bismuth.
According to USGS, bismuth is primarily obtained as a byproduct of lead ore processing, except in China where it is also mined with tungsten. This implies that production numbers for lead and tungsten should also be considered. One might expect the supply of bismuth to increase when the production of lead and tungsten increases. Along the same lines, important information could be gleaned from including variables for lead and tungsten prices. Theoretically, if lead prices were to rise, miners would have incentive to produce more, which would lead to increased production of bismuth. Will bismuth prices rise as well, or will they fall due to a flood of the market?
Furthermore, it is known that bismuth is a reliable, non-toxic substitute for lead in various applications. Since lead is an industrial metal, its primary production is strongly correlated to the GDP of developing countries. For example (Figure 2.3) shows a plot of lead production over time along with the real GDP (2009 U.S. dollars) of the U.S. and China. The graph shows that primary lead production and U.S. GDP are inversely correlated and there is little to no correlation with that of China prior to 1993. However, when China's economy began its rapid expansion in the mid 1990's (double digit growth in 1994), lead production seemed to turn around and mimic the movement in China's GDP. This suggests that
including variables for GDP might be useful. The reason to only include the GDP of the United States
and China is that, together, they account for over 60% of the world's supply of lead. Australia is a major
player as well but it tracks so closely with the United States in terms of production that, for simplicity,
we will just look at the U.S.
4
1.5e+13
US GDP -...3.8-
-1.25e+13
. 3.6- Pb production le+134
7.5e+12
E3.2--5e+123-2.8-
Double digit growh
-2.5e+12
2.6 0
1970 1975 1980 1985 1990 1995 2000 2005 2010
Year
Figure 2.3: Lead production versus GDP of China and U.S. (22)
A few more variables can be included: the prices of tungsten and lead, and the "lag prices" of bismuth,
tungsten and lead. Including lag price is an effective way to determine the magnitude of the effect that
a variable's history has on its current value. The lag prices of tungsten and lead are included because
they are so important to bismuth supply. For simplicity during analysis, the prices will only be lagged by
one period (one year).
We now have a bank consisting of 10 possible independent variables for the regression: lag prices for
the three metals
(PBit-1, PPbt-1, PW-1),prices for lead and tungsten
(Ppb, Pw),production numbers in metric
tons for the three metals (SBi, SeP, Sw) and the real GDP numbers for China and the U.S. (GDPChina, GDPus).Using this list, we can run a regression to get an idea of how effective these variables are in explaining
the fluctuations in the price of Bismuth. Figure 2.4 shows the results of this first regression.
Summary of Fit
RSquare 0.870331
RSquare Adj 0.820459
Root Mean Square Error 2.822536
Mean of Response 8.596626
Observations (or Sum Wgts) 37 Parameter Estimates
Term Estimate Std Error t Ratio Prob>|t|
Intercept 18.975872 13.41889 1.41 0.1692 P Pb (09$) 8.1573912 4.767104 1.71 0.0990 P W (09$) 0.338066 0.211828 1.60 0.1226 P Bit-1 0.5485508 0.116582 4.71 <.0001* P Pbt-1 -4.666925 4.394922 -1.06 0.2981
P
Wt-1 -0.751 0.242761 -3.09 0.0047* S Bi (mt) -0.000577 0.00113 -0.51 0.6140 S Pb (mt) 2.1483e-6 3.629e-6 0.59 0.5590 S W (mt) -0.000106 9.218e-5 -1.15 0.2625China GDP (09$) 6.169e-12 2.25e-12 2.74 0.0109* US GDP (09$) -2.22e-12 7.88e-13 -2.82 0.0091*
Figure 2.4: Response of bismuth price versus selected variables (1st iteration)
With an R-squared value of 0.82, it appears that this set of variables accounts for a significant portion of the variance in bismuth price. However, some of the variables are statistically indistinguishable from zero and will be removed for the next iteration. In Figure 2.5 we see that the removal of six insignificant variables has little effect on the overall correlation (R-squared changes by just .02) and the remaining variables are all statistically significant. Technically, this is where a regression analysis could be stopped. We have several significant variables that account for over 80% of the movement in the price of
bismuth. An equation could be formulated and used to calculate future bismuth prices with relatively high confidence. However, rather than blindly accepting the equation, it is important to evaluate the result and determine how effective its use would be.
Figure 2.5: Response of bismuth price versus selected variables (2nd iteration)
The hypothetical equation is a function of the prices of bismuth and tungsten as well as the GDP of China and the U.S. Being tied to China is no surprise given that the country accounts for over 60% of the world's bismuth production. The United States is a big driving force for much of the materials demand in the world, so a dependency on its GDP is also expected. Even a correlation with tungsten could be predicted considering the fact that China, the biggest producer of bismuth, retrieves the metal from tungsten as well as lead ore (21). It seems as if these proposed variables could all provide a valid explanation for the variance in bismuth price, but there are underlying issues that suggest they may not be so useful. Perhaps the most troubling concern is the strong dependence on lagged bismuth price. This indicates a strong autocorrelation and implies that we can predict the future price from past prices. If the lagged price were a small part of the correlation, there might not be a concern. However, a single-variable regression using only lagged price results in an R-squared value of 0.76, meaning that 76% of the movement in bismuth price in the current year is dictated by its price in the previous year. A model including the lagged price would essentially be unsustainable because we would need to know the future price of bismuth, which is exactly why we made the model in the first place. If we were to remove the lagged price, the new model would have an R-squared value of about 0.60, which is respectable; however, another problem persists. The ultimate goal of this study is to produce a model that can be used to predict the price of bismuth after a large surge in demand from the liquid metal battery. Nowhere in this model is there a variable describing bismuth demand - it was deemed insignificant during the first iteration. Therefore, even if our current model predicted 99% of the price movement in bismuth, it would not be useful for our target analysis. The model would only help if we
Summary of Fit
RSquare 0.827389
RSquare Adj 0.805813
Root Mean Square Error 2.935405
Mean of Response 8.596626
Observations (or Sum Wgts) 37
Parameter Estimates
Term Estimate Std Error t Ratio Prob>t
Intercept 18.651399 6.045031 3.09 0.0042*
P Bit-1 0.6799712 0.104961 6.48 <.0001*
P
Wt-1 -0.408207 0.144199 -2.83 0.0080*China GDP (09$) 5.519e-12 1.77e-12 3.13 0.0038* US GDP (09$) -1.98e-12 6.78e-13 -2.92 0.0063*
believed the introduction of LMB would have a significant and measurable effect on the world's GDP which, while exciting, is not a reasonable expectation.
One way to get around the lack of demand integration is to build a different model that does incorporate it. Consequently, this analysis yielded an outcome that showed the supply variables for nearly all of the metals included in this study have a strong correlation with the three following
variables: US GDP, China GDP, US Consumption. This fact makes it much easier to build a standardized model that can be used to predict the impact that a large-scale LMB operation would have on any metal chosen for the electrodes. The results of such a regression are shown in Figure 2.6 below for bismuth.
Summary of Fit
RSquare 0.776994
RSquare Adj 0.764251
Root Mean Square Error 489.2517
Mean of Response 4079.068
Observations (or Sum Wgts) 38
Parameter Estimates
Term Estimate Std Error t Ratio Prob>|t|
Intercept 4587.995 343.9828 13.34 <.0001* China GDP (09$) 1.5162e-9 1.69e-10 8.98 <.0001* US GDP (09$) -2.36e-10 5.35e-11 -4.42 <.0001*
Figure 2.6: Regression results for bismuth production (final iteration)
Incidentally, bismuth production does not depend greatly on US consumption, which is a result of China's dominance over the metal as well as a very low demand market. Having this model allows an easier analysis of how the LMB demand will impact the metal's market. Due to the models' simplicity, it would do little good to predict LMB demand and add it into the regression, since it would just increase linearly with demand. On the other hand, the model can be used to get an idea of the level of metal production in the future (assuming no major disruptions). This can then be compared with the projection for LMB demand obtained based on the projected storage targets. This kind of comparison will be performed in chapter 5.
2.1.2 Bismuth Qualitative Analysis
Having eliminated the variables that were indistinguishable from zero in the regression and ending up with an uninspiring model, it seems that the analysis will need to take a more qualitative route. This means we can use the data to establish a probable price range for bismuth and then determine where the range of profitability for the LMB lies. We will then make a reasonable estimate for the size of LMB demand based on target projections of the amount of energy stored. Finally, we can compare the demand estimate with a projection of bismuth supply and look at the potential effects on price.
In order to establish a price range for bismuth, we refer back to Figure 2.2, which charts the average, annual price of bismuth (in 2009 USD/kg) since 1971. Although it has experienced some dramatic fluctuations, bismuth price never falls much below $9/kg over the entire range of the chart. A lead refinery is going to produce pure bismuth as it refines the lead but has no practical use for it other than to make whatever money they can from selling it. Consequently, it appears that in the absence of strong demand, refiners are willing to sell bismuth at $9/kg.
We now have a potential floor, below which the bismuth price is not likely to fall, but what about the upper end of the range? This is actually where a very interesting trend appears. It has been mentioned several times throughout that bismuth is produced primarily as a byproduct of lead or tungsten
processing. This is not true in the case of one Bolivian mine. According to the USGS, "[tihe world's only significant potential source where bismuth could be the principal product is the Tasna Mine in Bolivia." Unfortunately, the Tasna mine shut down in 1985 due to a sustained decline in bismuth price. Referring to Figure 2.7 we see that this corresponds to the period of time when the price dropped from an average of about $60/kg to around $20/kg representing a precipitous 67% decline. At these low levels, primary bismuth production was no longer profitable and the mine was forced to close. A fully
operational Tasna mine would undoubtedly be very useful to this analysis, however, there are
conclusions that can be drawn from the historical data available. Figure 2.7 shows a fascinating relation between bismuth price and Bolivian production.
60- 700 Bolivia > 50- Production -600 -500 O 40--400 30- -300 20- C- Bismuth Price -200 10~ -100 0-0 I I I 0 1970 1975 1980 1985 1990 1995 2000 2005 2010
Year
Figure 2.7: Plot showing relation between bismuth price and production in Bolivia (21)
There is no reason to assume that Bolivian bismuth only comes from the Tasna mine, but with a
nationwide capacity of over 500 metric tons before 1985 and much less than 100 metric tons after 1985, it's safe to conclude that Tasna was a significant source of the metal for Bolivia. Therefore, this analysis will use Bolivian production as a proxy for the Tasna capacity in Figure 2.7. This graph shows at what price a dedicated bismuth mine would be able to operate profitably and, consequently, it appears that the cutoff is around $21/kg; below that, bismuth production is essentially zero. The mine was reported to have closed in 1985, which is at the same time as the price spiked to the $21 level, whereas the few years before saw lower prices and production levels barely above zero. Apparently, this price was not good enough for the mine which saw zero production in all years afterward until another price surge above $21/kg around 2006. In several reports, the USGS stated that the Tasna mine was on stand-by "awaiting a sufficient and substantial rise in the metal price" and in the 2010 Mineral Commodity Summary "there were reports that it had reopened" in late 2008. This corresponds to a unit price of between $20 and $25.
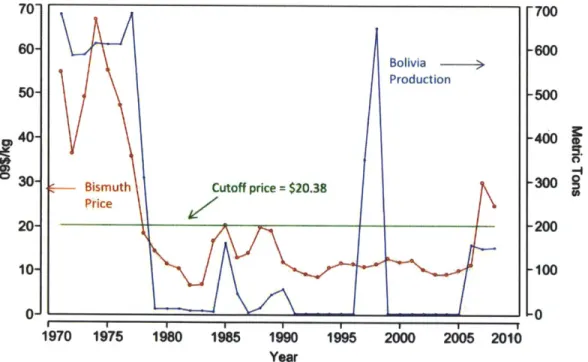
Figure 2.8 is a replot of Figure 2.7 except it shows the cutoff price at $20.38/kg. It indicates several instances where the Tasna mine came back online once the price of bismuth reached a certain
(presumably profitable) threshold. Whenever the price (red line) remains below the cutoff, production 32
(blue line) is minimal. Ultimately, we can use this fact to ascertain the level at which mines specializing
in bismuth production would begin to appear, but how can this information be applied to the current
analysis? Although a study of bismuth production in Bolivia seems rather arcane, its conclusions are
actually quite relevant. If a bismuth-based LMB is built for large-scale energy storage, there will be a
sudden demand for the metal to cover the uses of this new technology, but this demand will meet with
a rather sparse market. In all likelihood, supply will not be able to sustain demand and the price will be
driven upward. This will persist until that magic threshold is crossed whereby mines dedicated to
bismuth production can begin to operate profitably. In an ideal world, that price will be high enough to
encourage sufficient supply to meet LMB needs, but will be low enough that an LMB manufacturer will
be able to use the metal and still make a profit.
70
700
60- -600 Bolivia > Production 50- 500 40 4003-- Bismuth Cutoff price =$20.38k0
20 200 10 100 0 _-_ _-_ _-_-- -_ __ _ -- - _ _ -0 SI I I I I I I 1970 1975 1980 1985 1990 1995 2000 2005 2010 Year
Figure 2.8: Bolivian bismuth plot showing little to no production beneath cutoff price (21)
Because the LMB technology is still very nascent, the profit that can be made is not yet important. Of
more significance is whether the batteries can be produced at a cost that is at least on par with current
technologies in the market. The predicted use of the LMB is storage for intermittent renewable energy
sources, thus the estimated costs of LMB production should not exceed the cost for current, comparable
technologies such as lead-acid batteries, sodium-sulfur batteries and flow batteries. As a first-round
estimate, the aim of the LMB team is to keep production costs limited to $100/kWh for the active
materials, which is in line with current technologies that exhibit energy storage costs of $100-$150/kWh
(23). Active materials, here, refer to the positive and negative electrodes. Often, the mobile species cannot be placed in the battery by itself and, in such cases, an additional host metal will be included in the costs. The beauty of the LMB is that its technology allows for the use of cheap materials that, for the most part, are widely available. In fact, the positive electrode uses the less common metals (i.e. bismuth, antimony), which means that this is where the majority of the cost will result. At the time of this analysis, the price of bismuth is reported to be about $21/kg. Based on a cost model built for the project, this translates into an energy cost of over $140/kWh. Depending on the chemistry, the cost can approach $300/kWh. In reality, the price of bismuth would need to fall to about $7/kg before this particular battery chemistry can be produced economically. This price is essentially the all-time low reached by the metal ($6.63 in real dollars) back in 1982.
2.1.3 Bismuth Results
The ultimate goal of the LMB project is to store at least 20% of solar and wind energy produced in the United States (see Appendix B). Assuming base case operating conditions, an initial rollout capable of storing 1% of renewables and a ramp rate of about 1.25% per year (additional energy stored), the LMB
demand for bismuth averages to about twice the annual production predicted to be supplied through 2025. This should not come as big surprise considering the current market conditions for the metal. With very few applications, one would not expect a lot of production; however, the LMB is a new, disruptive technology that will essentially create a whole new market for bismuth. Regardless of the expected outcome, the fact remains that in order to simply satisfy the LMB demand, annual bismuth
production will need to ramp up 100% above what is predicted based on current consumption. This is great news for bismuth investors and bismuth producers, but probably not for the LMB project. As stated above, the current price for bismuth is $21/kg and it is considered too expensive for the project.
Let us assume the LMB technology is announced and production will begin immediately. How will the price of bismuth react? It would be safe to assume that the only way for bismuth production to meet
LMB needs is for dedicated bismuth mines to come online, including the Tasna mine in Bolivia. We have established that the current trading price for the metal is right at the profitability limit for the Tasna and, presumably, any other bismuth mines. Unfortunately it is also over three times more expensive than needed by the LMB. Most likely, more mines will not be initiated until the price rises even further which, with demand exceeding supply by 100%, is inevitable. Ultimately, the bismuth price will diverge