HAL Id: halshs-01084600
https://halshs.archives-ouvertes.fr/halshs-01084600
Preprint submitted on 19 Nov 2014HAL is a multi-disciplinary open access
archive for the deposit and dissemination of sci-entific research documents, whether they are pub-lished or not. The documents may come from teaching and research institutions in France or abroad, or from public or private research centers.
L’archive ouverte pluridisciplinaire HAL, est destinée au dépôt et à la diffusion de documents scientifiques de niveau recherche, publiés ou non, émanant des établissements d’enseignement et de recherche français ou étrangers, des laboratoires publics ou privés.
An Empirical Analysis for Sub-Saharan Africa
Jean-Louis Combes, Rasmané Ouedraogo
To cite this version:
Jean-Louis Combes, Rasmané Ouedraogo. Does Pro-cyclical Aid Lead to Pro-cyclical Fiscal Policy? An Empirical Analysis for Sub-Saharan Africa. 2014. �halshs-01084600�
C E N T R E D'E T U D E S E T D E R E C H E R C H E S S U R L E D E V E L O P P E M E N T I N T E R N A T I O N A L
SERIE ETUDES ET DOCUMENTS
Does Pro-cyclical Aid Lead to Pro-cyclical Fiscal Policy? An Empirical
Analysis for Sub-Saharan Africa
Jean-Louis Combes
Rasmané Ouedrago
Etudes et Documents n° 24
November 2014
To quote this document:
Combes J.-L., Ouedrago Rasmané (2014) “Does Pro-cyclical Aid Lead to Pro-cyclical Fiscal Policy? An Empirical Analysis for Sub-Saharan Africa”, Etudes et Documents, n° 24, CERDI.
http://cerdi.org/production/show/id/1634/type_production_id/1
CERDI
65 BD. F. MITTERRAND
63000 CLERMONT FERRAND – FRANCE
TEL.+33473177400
FAX +33473177428
The authors Jean-Louis Combes Professor
Clermont Université, Université d'Auvergne, CNRS, UMR 6587, CERDI, F-63009 Clermont Fd Email : J-Louis.COMBES@udamail.fr
Rasmané Ouedrago PhD Student
Clermont Université, Université d'Auvergne, CNRS, UMR 6587, CERDI, F-63009 Clermont Fd Email : rasouedo@yahoo.fr
Corresponding author: Rasmané Ouedrago
Etudes et Documents are available online at: http://www.cerdi.org/ed
Director of Publication: Vianney Dequiedt Editor: Catherine Araujo Bonjean
Publisher: Chantal Brige-Ukpong ISSN: 2114 - 7957
Disclaimer:
Etudes et Documents is a working papers series. Working Papers are not refereed, they
constitute research in progress. Responsibility for the contents and opinions expressed in the working papers rests solely with the authors. Comments and suggestions are welcome and should be addressed to the authors.
Abstract
This paper examines the so-popular anecdote according to which pro-cyclical fiscal policies are due to pro-cyclical behavior of financing. We address the question of whether or not pro-cyclical aid leads to pro-cyclical fiscal policies in SSA recipient countries. We employed panel data techniques covering 39 SSA countries over the period 1985- 2012. We found that results depend on the type of aid: cyclical bilateral aid is negatively associated to cyclical fiscal policy, while cyclical ODA from multilateral agencies leads to more pro-cyclical fiscal policy. This finding is robust to potential error bias, alternative specifications, additional controls and different estimation methods.
Key words: Sub-Saharan Africa, Official Development Assistance, fiscal policy, pro-cyclicality JEL codes: E32, E62, F35, F42, F41, O19
Acknowledgment
We are grateful to Degui Li, Jia Chen, Jiti Gao, Ibrahima Diallo and Ioana Marinescu for
econometric support and great benefits from discussions. We are also grateful for comments and suggestions received from Sampawende Jules Armand Tapsoba and Clément Anne.
1. Introduction
The contribution of ODA to development divides researchers. On the one hand, aid skeptics (Friedman, 1958; Bauer, 1972; Easterly, 2001) argue that it perpetuates bad governments, enriches elites, and creates a disincentive for governments to boost domestic resource mobilization. On the other hand, proponents of aid (Sachs, 2004; Stern 2002; Stiglitz, 2002) are of the view that it complements domestic savings and supports growth and poverty reduction in recipient countries (UNECA, 2009, Radelet, 2006). While aid volatility, predictability and pro-cyclicality are widely investigated in the literature (Bulỉř and Hamann 2001, 2003, 2005; Pallage and Robe 2001; Chauvet and Guillaumont, 2008; Fielding and Movratas, 2005; Gnangnon, 2014 and so on), few studies have been done about the aid effect on fiscal policy behavior. However, some authors have shown that aid is important for fiscal policy in recipient countries (Lensink and Morrissey (2000), Gemmell & McGillivray, 1998; Pallage and Robe (2003)). For instance, Celasun and Walliser (2008) argue that “more predictable aid would improve recipient countries” ability to plan for aid flows and allow them to more effectively execute the activities financed with such aid. Low predictability, by contrast, is costly by requiring adjustments to government consumption and investment plans with potential harmful effects on the objective attached to the spending of aid resources. Only Lledó, Yackovlev, and Gadenne (2009), Thornton (2008); Mpatswe, Tapsoba and York (2012) have empirically studied on aid effect on fiscal policy behavior. While Thornton (2008); Mpatswe, Tapsoba and York (2012) found a positive and strongly significant relationship between net foreign aid and fiscal policy pro-cyclicality, Lledó, Yackovlev, and Gadenne (2009) shown that a larger share of aid in GDP seems to decrease pro-cyclicality, suggesting that access to concessional sources of finance enables countries in SSA to mitigate the tendency for spending growth to follow output growth (p. 24). However, these studies failed to look at about aid cyclicality effect on fiscal policy behavior. Previous literature has
measured aid cyclicality with respect to national income (e.g., Pallage and Robe 2001), fiscal receipts (e.g., Bulỉř and Hamann 2001, 2003, 2005) or exports of goods and services (Chauvet and Guillaumont, 2008). Given the fact that these assessments are not exogenous, we propose here to define aid cyclicality according to donor GDP growth or output gap. Indeed, many studies have shown that aid efforts depend on donor macroeconomic conditions (Bertoli, Cornia and Manaresi, 2008; Beenstock, 1980; Fuchs, Dreher and Nunnenkamp, 2014; Boschini and Olofsgard, 2007; Round and Odedokun, 2003, 2004), and this situation increases aid uncertainty. In the context of the current economic crisis, that is an important challenge for all SSA countries which are mainly aid-dependent countries. This raises the question of whether the international community could better support SSA countries to achieve MDGs and beyond. We contribute to the literature by linking aid cyclicality to fiscal policy behavior and examining the determinants of pro-cyclicality of fiscal policy in SSA. Our central hypothesis is that ODA pro-cyclicality can lead to fiscal policy pro-cyclicality in SSA countries because of their high reliance on aid as source of financing. In previous literature, it was been argued that pro-cyclical access to international capital markets by developing countries may lead to pro-cyclical fiscal policies and, hence, higher aggregate volatility (Calderon and Schmidt-Hebbel, 2008; Gavin, Hausmann, Perotti and Talvi, 1996; Kaminsky, Reinhart and Végh, 2004). Here, we focus on aid pro-cyclicality that depends strongly on donor macroeconomic conditions. To the best of our knowledge, no study has already been done in such approach. Given the fact that African countries are aid-dependent, the behavior of fiscal policy may follow the behavior of ODA allocation. Then, the allocation of aid according to donor macroeconomic conditions is hardly controllable by recipient countries, which can therefore run macroeconomic mismanagement. According to Ouedraogo (2013), the uncertainty of aid inhibits budgetary comprehensiveness of recipient countries, because they cannot plan ahead for the size of external resources which they will have in the
fiscal year. This compromises strongly the ability of recipient countries to plan ahead their expenses and therefore to run counter-cyclical fiscal policies. In this paper, we review previous literature and attempt to further investigate the determinants of the pro-cyclicality of fiscal policy in Africa. Relying on both general and country-specific and stylized facts on ODA and fiscal policy behavior, our contribution is five fold. First, we disentangle between bilateral and multilateral ODA contrary to previous studies that consider total aid, while motivations under each type of aid do not meet. Second, we study the behavior of fiscal policy and ODA in SSA in overall by estimating the non-parametric time-varying coefficients panel data models of Li et al (2011). Third, we generate the annual time-varying cyclicality coefficients for each SSA country, contrary to Aghion and Marinescu (2008) and Mpatswe, Tapsoba and York (2012) that estimated for OECD and CEMAC countries, respectively. Fourth, we take the advantage of using many indicators of fiscal policy (general government consumption, public investment and total expenditures) and also undertake an important number of robustness exercises. Fourth, we attempt to deal with the potential bias by using a two-stage least squares (2SLS) model, which instruments ODA cyclicality coefficients with development agency independence and political proximity. Fifth, we investigate the channels through which ODA pro-cyclicality can cause fiscal policy pro-cyclicality. We employ panel data techniques covering 39 SSA countries over the period from 1985 to 2012. We find that results depend on the type of ODA: bilateral aid is negatively associated to pro-cyclical fiscal policy, while pro-cyclical ODA from multilateral agencies leads to more pro-cyclical fiscal policy. This finding is robust to potential error bias in ODA cyclicality coefficients, alternative specifications, additional controls and different estimation methods. Furthermore, the effects seem to differ between British legal system‘s countries where bilateral aid leads to counter-cyclical fiscal policy and other ones French where ODA from multilateral agencies appears more better for fiscal policy. However, both bilateral and multilateral ODA
pro-cyclicality can lead to more pro-cyclical fiscal policy when the country is opened to international trade, oil or primary products exporter. We also found that the Heavily Indebted Poor Countries initiative and an improvement of the terms of trade stance lead to more pro-cyclical fiscal policy.
However, it is worth noting that we are not the first to study on pro-cyclicality of fiscal policy in SSA. Indeed, by estimating simple time series regressions for 37 low-income African countries during 1960–2004, Thornton (2008) suggests that government consumption is highly pro-cyclical, with consumption responding more than proportionately to fluctuations in output in many cases. Furthermore, he shows that government consumption is more pro-cyclical in those African countries that are more reliant on foreign aid inflows and that are less corrupt, and that it is less pro-cyclical in countries with unequal income distribution and that are more democratic. He defines the cyclicality of fiscal policy in terms of the log of real government consumption and uses two stage estimations as empirical strategy. The first stage is to estimate cyclicality coefficients for government consumption in the individual African economies, while the second stage aims to explain the cross-country variation in the degree of pro-cyclicality of government consumption.
Diallo (2008) focuses on the role of democratization to explain the difference in cross-country fiscal policy stance. By illustrating stylized facts in Botswana and Nigeria, he employs fiscal Taylor rule and system GMM to explore the implications of political changes on the cyclical properties of fiscal policy. He highlights that democratic institutions are associated to countercyclical fiscal policies and restraints on the executive branch are found to be the key factor that explains why democracies can better smooth business cycles than autocracies. His paper spans 47 SSA countries over the period of 1989-2002. Even if he defines fiscal policy with respect to government spending, his output variable is captured by movements in the terms of trade from their trend, which is assumed to be more exogenous than real GDP.
Contrary to Diallo (2009), Lledó, Yackovlev, and Gadenne (2009) investigate the cyclical patterns of government expenditures in sub-Saharan Africa since 1970 and show that changes in political institutions have no impact on pro-cyclicality1. Furthermore, they found that pro-cyclicality of fiscal policy is obvious in SSA countries, but it has declined in recent years. They use annual data in an unbalanced panel covering 39 years (1970–2008) and 174 countries (including 44 SSA countries), and employ dynamic GMM techniques in which they control for endogeneity. Their fiscal policy definition is based on real central government spending and the key explanatory variable is growth in real GDP.
With an aim of studying whether or not fiscal policy has contributed to the stabilization of output growth volatility in African countries, Carmignani (2010) concludes that pro-cyclicality of fiscal policy in SSA countries is indisputable and that situation is a source of output volatility. His sample covers 37 African countries and the period of 1990-2007.
Mpatswe, Tapsoba and York (2012) apply the system and difference GMM techniques on panel data of 44 SSA countries over the period of 1980-2008 and show that fiscal policies in SSA are strongly pro-cyclical. Their findings are consisting to government consumption, public investment and total public expenditures. Furthermore, they highlight that government consumption is less pro-cyclical than public investment, meaning that investment is extremely responsive to economic cycles. They further investigate fiscal policy behavior in CEMAC countries by calculating time-varying cyclical coefficients and also look at determinants of pro-cyclicality in this region2.
The rest of the paper is divided as follows. Section 2 begins by presenting the data, while part 3 sketches how we measure ODA pro-cyclicality. Part 4 presents an overview on fiscal policy and ODA pro-cyclicality in Sub-Saharan Africa. The focus of part 5 is the presentation of the empirical model whose results are analyzed in part 6. Part 7 concludes and describes some economic policy recommendations.
2. Data and fiscal policy measure
An annual panel dataset consisting of 39 SSA countries from 1985 to 2012 is constructed from a variety of sources. Variables of primary interest in the baseline model include the presence of real general government consumption growth, real GDP growth drawn from
United Nations data website, and real ODA growth drawn from OECD-QWIDS datasets. In
selecting all of these variables, we follow closely the work of previous study focusing mainly on fiscal policy. We deflate ODA data by using the deflators for resource flows from DAC donors, with 2012 as the base year. Concerning the measure of fiscal policy, we firstly prefer growth rates of government spending that correspond to policy instruments rather than fiscal outcomes such as primary balance, tax revenue and other fiscal variables that are endogenous. Moreover, in robustness checks, we will generate output gap by using the Hodrick-Prescott filter with a smoothing parameter of 6.25 as suggested by Ravn and Uhlig (2002). The other control variables come from different sources. The real GDP per capita data with 2005 as the base year are drawn from World Development Indicators database-the World Bank. We also extracted the domestic private credit over GDP and inflation rate from this wide database. The public debt over GDP data are drawn from Abbas et al (2010)’s historical public debt database-the IMF, while financial openness indicator is from the Chinn-Ito dataset (Menzie and Ito, 2006). Moreover, we include political institution indicators that are drawn from Polity
4 dataset (degree of democracy-Polity2; constraints on the executive-Xconst; government
openness-Xopen) and Freedom House database where we prefer to use civil liberty indices. Finally, we extracted corruption data from the International Country Risk Guide, while checks and balance data are from the World Bank’s Database of Political Institutions.
3. How do we measure cyclicality of ODA?
ODA cyclicality has already been studied in the literature. However, most of authors assessed ODA cyclicality with respect to national income (e.g., Pallage and Robe 2001) or fiscal receipts (e.g., Bulỉř and Hamann 2001, 2003, 2005) or exports of goods and services (Chauvet and Guillaumont, 2008). According to Chauvet and Guillaumont (2008), these studies conclude that aid is more often pro-cyclical than counter-cyclical; aid, at best, is not correlated with the cycles of national income or fiscal revenues (Bulỉř and Hamann 2001, 2003, 2005; Pallage and Robe 2001). For instance, Bulỉř and Hamann (2001) found that aid is modestly pro-cyclical with correlation coefficients mainly concentrated on the right of zero and with only a small number of countries with counter-cyclical aid (P.3). However, as argued by Chauvet and Guillaumont (2008), these assessments are not exogenous. But their proposal to assess aid cyclicality based on exports of goods and services is not satisfactory and is endogenous. For instance, many studies have found that aid for trade is positively associated with recipient exports (Calì and Te Velde, 2011; Helble et al., 2012; Pettersson and Johansson, 2013; Hühne et al., 2013). Moreover, Munemo et al. (2007: 430) even found that “a large amount of foreign aid adversely affects export performance of developing countries” by giving rise to Dutch disease. Thus, assessing aid cyclicality with respect to exports of goods and services is not exogenous. Although we do not aim to enter in this old debate, we propose here to measure aid cyclicality with respect to donor macroeconomic conditions. Indeed, many studies have shown that aid efforts depend on macroeconomic conditions in donor countries (Bertoli, Cornia and Manaresi, 2008; Beenstock, 1980; Fuchs, Dreher and Nunnenkamp, 2014; Boschini and Olofsgard, 2007; Round and Odedokun, 2003, 2004). Furthermore, many other studies found that ODA decreases (increases) when macroeconomic conditions deteriorate (improve) in donor countries and therefore put forward that aid is pro-cyclical. We report in the following table, the meta-analysis of Fuchs, Dreher and
Nunnenkamp (2014) in this field. As we can see, no study has showed mixed negative or negative relationship between aid efforts and donors’ GDP growth or output gap.
Table 1: Literature review on aid efforts and donor macroeconomic conditions Hypothesis Observed effect on aid budgets in different studies
ODA decreases when macroeconomic conditions deteriorate in donor countries Positive Mixed positive Insignificant Mixed negative Negative Round and Odedokun (2003, 2004) Brech and Potrafke (in press) Lundsgaarde et al. (2007) Frot (2009) Tingley (2010) Bertoli et al. (2008) Faini (2006)
Source: Fuchs, Dreher and Nunnenkamp (2014), P. 175. Note that we merge results for GDP growth and output gap.
In this paper, for each recipient country, we retain the top ten donors defined as the sum of aid provided since 1985. Such method aims to focus on main donors, those whose aid could affect fiscal policy in the recipient country. For instance, the top ten historical donors of Burkina Faso since 1985 are Belgium, Canada, Denmark, France, Germany, Japan, Netherlands, Sweden, Switzerland, and the United States. Their grants represent 92.12 % over the total of bilateral aid to Burkina Faso. As an old French colony, France is the leading donor ($2.263 billion), followed by the Netherlands ($1.108 billion). However, the economic crisis forced the Netherlands’s development agency to leave from Burkina Faso and further reduce their aid to this country3. Such situation can affect fiscal policy in the recipient country. In order to study how aid recipient countries’ fiscal policy behaves according to donor macroeconomic conditions, we generate the averaged real GDP growth by the following formula:
𝑌_𝑑𝑜𝑛𝑜𝑟𝑖,𝑡 = ∑ 𝑎𝑖𝑑_𝑠ℎ𝑎𝑟𝑒𝑖𝑗,𝑡∗ 𝑦𝑗,𝑡
𝑁
𝑗=1
𝑌_𝑑𝑜𝑛𝑜𝑟𝑖,𝑡, is defined as real GDP growth to the average donor weighted by the amount of aid a country receives from that particular donor. Where 𝑎𝑖𝑑_𝑠ℎ𝑎𝑟𝑒𝑖𝑗,𝑡 is the aid share of
donor 𝑗 in recipient country i’s total bilateral aid from members of the Development Assistance Committee (DAC) in period 𝑡; 𝑦𝑗,𝑡 is real GDP growth of the donor country. In section 6, for robustness check, we will replace donor’s real GDP growth by its output gap. As for multilateral aid, 𝑦𝑗,𝑡 represents the mean of OECD countries’ GDP growth.
4. Pro-cyclicality of fiscal policy and ODA in Sub-Saharan Africa: an
overview
In this section, we empirically look at the behavior of fiscal policy and Official Development Aid (ODA) in Africa by estimating the non-parametric time-varying coefficients panel data models developed by Li et al (2011). We would like estimate the time-varying coefficients for overall Sub-Saharan Africa countries. The parametric models allow us estimating a non-linear panel data model irrespective of the density of the coefficient function. In recent years, a lot of econometric literature has been devoted to estimating time varying coefficients in regression models. Since their introduction by Cooley and Prescott (1973, 1976) and Rosenberg (1972), time varying parameter regression models have been used extensively in empirical studies. These models permit the regression coefficients to evolve over time, so they can be applied to time series models with parameter instability. Following Li et al (2011), we use a non-parametric trending time-varying coefficients panel data model of the form:
𝑌𝑖𝑡 = 𝑓𝑡+ ∑𝑑 𝛽𝑡,𝑗𝑋𝑖𝑡,𝑗
𝑗=1 + 𝛼𝑖+ 𝑒𝑖𝑡 (2)
= 𝑓𝑡+ 𝑋𝑖𝑡𝑇𝛽𝑡+ 𝛼𝑖 + 𝑒𝑖𝑡, 𝑖 = 1, … , 𝑁, 𝑡 = 1, … , 𝑇,
Where 𝑋𝑖𝑡 = (𝑋𝑖𝑡,1, … , 𝑋𝑖𝑡,𝑑)𝑇, 𝛽𝑡 = (𝛽𝑡,1, … , 𝛽𝑡,𝑑)𝑇, all 𝛽𝑡 et 𝑓𝑡 are unknown functions, {𝛼𝑖}
reflects unobserved individual effect, and {𝑒𝑖𝑡} is stationary and weakly dependent for each 𝑖 and independent of {𝑋𝑖𝑡} et {𝛼𝑖}, 𝑇 is the time series length and 𝑁 is the cross section size. One assume that : ∑𝑁𝑖=1𝛼𝑖 = 0. In our case, 𝑌𝑖𝑡 represents general government consumption growth or ODA growth and 𝑋𝑖𝑡 is recipients’ GDP growth or donors’ GDP growth.
In their paper, Li et al (2011) develop two methods to estimate the trend function and the coefficient function without taking the first difference to eliminate the fixed effects. The first one eliminates the fixed effects by taking the cross-sectional averages and the uses a non-parametric local linear method to estimate both the trend and coefficient functions. The second proposes a pooled local linear dummy variable approach. It removes the fixed effects by deducting a smoothed version of cross-time average from each individual. The simulation and analysis of UK’s climate real data applied in their paper show that the local linear dummy variable estimate of 𝛽(. ) outperforms the averaged local linear estimate. This finding is also consistent with Gersovitz and Mackinnon (1978) and Hylleberg (1986) that showed that dummy specification provides a good model. Given that we are interested in time-varying coefficients 𝛽𝑡, we then estimate the local linear dummy variable.
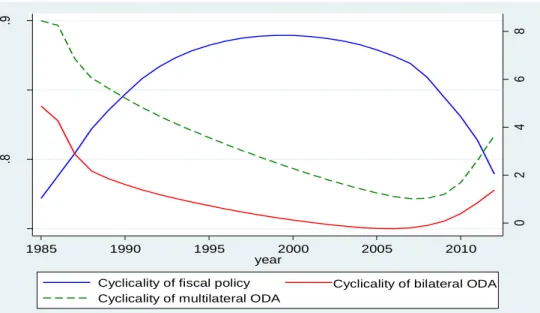
We now use this method to estimate two equations. The first one characterizes the relationship between general government consumption growth and recipients’ GDP growth. This describes the behavior of fiscal policy in Sub-Saharan Africa countries since 1985. The second ties ODA growth to donors’ GDP growth and illustrates the evolution of aid to sub-Saharan Africa pro-cyclicality. The results of these estimations are illustrated in Figure 1.
Figure 1: Cyclicality of fiscal policy and ODA in Sub-Saharan Africa between 1985 and 2012. Note that left axis represents fiscal policy cyclicality coefficient and the right one is ODA cyclicality coefficient.
0 2 4 6 8 .7 5 .8 .8 5 .9 1985 1990 1995 2000 2005 2010 year
Cyclicality of fiscal policy Cyclicality of bilateral ODA Cyclicality of multilateral ODA
We can observe that even if fiscal policy and ODA are globally pro-cyclical, their paths are not the same. Indeed, pro-cyclicality of fiscal policy increased during the period 1985-2000 and decreased since the last decade. Contrary fiscal policy stance, pro-cyclicality of bilateral and multilateral ODA evolved in the same path. It has been subsequently decelerating until 2006 before climbing by a modest rebound. Furthermore, we observe that bilateral ODA was slightly countercyclical between 2002 and 2008.
Econometric evidence on the relative magnitude and evolution of pro-cyclical patterns in fiscal policy for overall SSA countries in particular is sparse (Lledó, Yackovlev, and Gadenne 2009). Some econometricians rely on sub-period analysis to provide evidence on the evolution of fiscal policy cyclicality. For instance Frankel, Vegh and Vuletin (2012) divided the period of 1960-2009 into two sub-samples: 1960-1999 and 2000-2009 in order to analyze fiscal policy behavior since 1960s. Using sample of 94 countries (21 developed and 73 developing countries, including 25 SSA), they show that many countries have continued to behave pro-cyclically over the last decade. Furthermore, using GMM techniques for 44 SSA countries for the sub-samples 1970-79, 1980-89, 1990-99 and 2000-08, Lledó, Yackovlev, and Gadenne (2009) show that fiscal policy was a-cyclical for the 1970s, but in the 1980s and 1990s it was pro-cyclical and increasing. Moreover, during the period of 2000-08, the coefficient of pro-cyclicality falls to the point that it is lower than that for other developing countries. This suggests that fiscal policy in the region has in recent years become less pro-cyclical. That finding is so consistent with what reported in figure 1. This can be explained by the adoption of Poverty Reduction Strategy Papers (PRSP) in most of SSA countries since 1999. Updated every three years with annual progress reports, PRSPs describe the country's macroeconomic, structural and social policies and programs over a three year or longer horizon to promote broad-based growth and reduce poverty, as well as associated financing needs and major sources of financing. Thus, by planning policies and sources of financing,
these programs allow to reduce fluctuations of government expenditures and therefore the pro-cyclicality of fiscal policy.
Moving on aid pro-cyclicality, figure 1 highlights that while ODA from multilateral agencies was pro-cyclical over the whole period, bilateral aid was pro-cyclical during the sub-periods 1985-2001 and 2009-2012. During these years, ODA to SSA countries tends to be disbursed mostly in periods when averaged donors’ output is high and held back when donors’ domestic economic activity is contracting. This reflects fiscal constraints in developed countries when economic activities are slowdown. In contrast, bilateral ODA was countercyclical between 2002 and 2008, meaning that donors’ countries have increased aid even if they experience worse economic performances. However, this finding can be related to aid relief whose many developed countries reported as effective disbursement of aid. Indeed, at the G-8 meeting4 held in Cologne (Germany) in 1999, the members proposed to cancel 100% bilateral debts for various African countries. This initiative is followed by the declaration of the 2005 G-8 Summit in Gleneagles (United Kingdom) which aims to scale down $ 40 billion of
multilateral debts for 18 indebted poor countries, including 14 SSA countries. All of these debt cancellations are reported as ODA by donor countries and therefore aid was less dependent on donors’ economic performance.
5. Empirical analysis: the identification strategy
After discussing overall SSA countries policies, we develop here country-specific conditions and formalize the equations that will be estimated.
As argued in section 1, we are also interesting in fiscal policy behavior for each country and therefore we would like estimating time-varying cyclicality coefficients by country. Remind that we aim to estimate the impact of aid cyclicality on fiscal policy cyclicality. To this end, we have to estimate time-varying cyclicality coefficients for aid and time-varying cyclicality
coefficients for fiscal policy by individual African economies. Then, we will estimate the link between the two estimated coefficients using fixed-effects panel data.
Following previous literature5, the empirical strategy is in two stages. In the first step, we consider the estimation of the following equation for fiscal policy behavior:
∆𝐿𝑜𝑔𝐹𝑖𝑡 = 𝛼 + 𝛽𝑖𝑡∆𝐿𝑜𝑔𝑌𝑖,𝑡+ 𝜑𝑖𝑡 (3)
Where ∆ indicates the annual change in the variable, i= 1, 2, ..., N is the country index; t=1,
2, ...,T is the time index; Log(F) represents the log of real fiscal variable (general government
consumption, public investment or government total expenditures); Log(Y) stands for real GDP, and 𝜑 represent error terms.
In line with Aghion and Marinescu (2008) and Mpatswe, Tapsoba and York (2012), the coefficient βit is then allowed to be country specific and time varying. By applying the first
difference transform to the data, we are in effect using deviations from fixed long-run trends of our variables, ruling out any structural relationship between F and Y which is linear and time invariant. The cyclical characterization of fiscal policy depends on the sign and statistical significance of the coefficient βit: if it is positive, the fiscal policy is pro-cyclical ; if it is negative, then fiscal policy is counter-cyclical ; and if the coefficient is insignificant, then fiscal policy can be classified as a-cyclical.
As for ODA behavior, we estimate the following equation: ∆𝐿𝑜𝑔𝑂𝐷𝐴𝑖𝑡 = 𝜇 + 𝜗𝑖𝑡∆𝐿𝑜𝑔𝑌_𝐷𝑜𝑛𝑜𝑟𝑖,𝑡+ 𝜏𝑖𝑡 (4)
Where 𝜏 represent error terms, ODA is real Official Development Aid received by country 𝑖,
Y_Donor is the averaged real GDP growth of the main donor countries calculated in part 3.
That is to say, for each recipient country, we retain the top ten donors defined as the sum of aid provided since 1985. As argued above, the cyclical behavior of ODA depends on the sign and statistical significance of the coefficient ϑit: if it is positive, the ODA is pro-cyclical ; if it
is negative, then ODA is counter-cyclical ; and if the coefficient is insignificant, then aid can be classified as a-cyclical.
Subsequently, we present the econometric technique to estimate the coefficients βit and ϑit. To this end, we follow Aghion and Marinescu (2008) and Mpatswe, Tapsoba and York (2012) by using local Gaussian-weighted OLS to estimate equations (3) and (4). This technique determines the time-varying cyclicality coefficient for country 𝑖 at year 𝑡 by using all observations and assigning greater weights to those observations closest to the reference year (Mpatswe, Tapsoba and York, 2012). The least squares estimation procedure considers all points in a local neighborhood but allow for discrimination among the observations. The motivation behind this technique is to gain more accuracy at the reference year than the 10-rolling-window ordinary least squares, which is also estimated in Aghion and Marinescu (2008).
The second stage of the process is to examine if aid cyclicality explains fiscal policy cyclicality. Then, we use the time-varying cyclicality coefficients obtained from equations (3), (4), and we implement panel data techniques to perform our analysis. These techniques allow us to control for the presence of country-specific effects in order to avoid biased estimates. We follow therefore Aghion and Marinescu (2008) and Mpatswe, Tapsoba and York (2012). Specifically, we estimate the following equation:
𝛽̂𝑖𝑡 = 𝜃 + 𝜋𝜗̂𝑖𝑡+ ∑𝑀 𝛾𝑚𝑋𝑚𝑖𝑡
𝑚=1 + 𝛿𝑡+ 𝜔𝑖𝑡 (5)
Where 𝑋𝑚𝑖𝑡 denotes the control variables and 𝜔𝑖𝑡 stands for the error term including a country-specific fixed effect and an idiosyncratic fiscal shock. We also include period dummies, 𝛿𝑡, to account for common time effects such as shocks affecting all SSA countries at the same time, as is standard in the literature. Given that each SSA country in the sample has its own economic, political and institutional characteristics that are likely to be correlated
with the explanatory variables of the model, panel fixed-effects models are more appropriate to this study.
We now turn to explanatory variables included in the equation (5). Following previous literature on main determinants of pro-cyclicality of fiscal policy in SSA, we consider those related to the country’s economic development, financing constraints (domestic and international markets), the variables that proxy for macroeconomic policy sustainability and stabilization concerns and finally variables of governance and institutions.
For economic development variable, we consider the real GDP per capita drawn from World Development Indicators, the World Bank. Indeed, it is widely shared among researched that developed countries conduct sound policy than under-developed countries (Halland and Bleaney, 2011, Mpatswe, Tapsoba and York (2012); Frankel, Vegh and Vuletin, 2012; Ilzetski et al, 2008; Aghion and Marinescu, 2008 and so on). We therefore expect negative sign. As for financing constraints, we retain Credit-to-private sector over GDP as domestic financing constraint and Chinn-Ito financial openness index (Menzie and Ito, 2006) to measure international markets integration (KAOPEN). Credit-to-private sector is used as a proxy for the depth of the domestic credit market that, if it is not limited, can allow to pursue expansionary fiscal policies during downturns. However, its effect on fiscal policy is mixed according to previous literature. As for financial openness index, it is based on the binary dummy variables for the four major categories of restrictions on external accounts; presence of multiple exchange rates; restrictions on current account transactions; restrictions on capital account transactions and the requirement of the surrender of exports proceeds. A country financially opened can easily borrow in bad times than those closed countries. This variable has been already used in previous studies (Endegnanew, 2013; Frankel, Vegh and Vuletin, 2012). We expect therefore negative sign.
In line with Halland and Bleaney (2011), Lledó, Yackovlev, and Gadenne (2009), Mpatswe, Tapsoba and York (2012), Frankel, Vegh and Vuletin (2012) and so on, we include Debt-to-GDP ratio to control for macroeconomic policy sustainability. Reinhart, Rogoff and Savastano (2003) argued that debt could be conductive to more pro-cyclicality simply because they signal tighter financial conditions. Then, concerned countries can be shut out of international financial markets because of recent history of default or high debt, therefore no external credit is available to help smooth fiscal policy over the cycle. Furthermore, we include inflation rate to control for stabilization concerns. According to Lledó, Yackovlev, and Gadenne (2009) high inflation can affect a government’s ability to adjust to the economic cycle, because fiscal policy is subordinated to the aims of keeping price increases in check and reassuring creditors—avoiding hyperinflation. Such analysis is in line with Woo (2003), Ben Slimane and Ben Tahar (2010); Aghion and Marinescu (2008). Even if Lledó, Yackovlev, and Gadenne (2009) and Mpatswe, Tapsoba and York (2012) found no evidence of inflation effect on pro-cyclicality in SSA, we expect positive sign.
Finally, in line with the most studies and the commonly discussed determinant of pro-cyclicality highlighted in the literature, we control for governance and political institutions. Indeed, several studies suggest that better political institutions, such as less corruption, more constraints on the executive or additional checks and balances, should lead to less pro-cyclical fiscal policies ((Frankel, Vegh and Vuletin, 2012; Alesina and Tabellini, 2005; Calderón et al., 2004; Diallo, 2009; Thornton, 2008 and so on). However, some authors found that better democracy conduct to more procyclicality. For instance Tanzi and Davoodi (1997), Friedman
et al. (2000) and Ghura (2002) provide evidence that corruption leads to lower levels of tax
collection and hence to sub-optimal government spending. Thus, better governance (lower corruption) may do nothing to make fiscal policy less countercyclical: it may simply increase resources (tax revenue) available to support additional procyclical government spending.
Then, it is worth noting the effect depends on which indicator is used. To deal with this situation, we control for various indicators of political governance and institutions: degree of democracy “Polity2”, constraints on the executive “Xconst”, government openness
“Xropen”, civil liberties “Civil_liberties”, Corruption “Corruption”, checks and balances “checks”.
6. Results
6-1. Descriptive statistics and figures
We first present the descriptive statistics and some figures of the cyclicality coefficients generated in equations (3) and (4). Table 2 summarizes key results and we can observe that many SSA countries have carried out pro-cyclical fiscal policy (873 times out of 1092; i.e 𝛽>0). Furthermore, among them, government consumption spending responds more than
proportionately to output fluctuations in around half of the cases (i.e., 𝛽>1 in 371 times out of
873). In contrast, SSA countries have conduct counter-cyclical fiscal policy or at least
satisfactory in only 20% of cases (𝛽<0).
Table 2: Descriptive statics of time-varying cyclicality coefficients
Variable Obs. Mean Std. Dev. Min Max
𝛽 1092 0.698 1.387 -7.612 5.461 𝛽>0 873 (80%) 1.12 0.962 0 5.462 𝛽>1 371 1.929 0.966 1 5.462 𝛽<0 219 (20%) -0.982 1.541 -7.612 -0.0008 𝜗𝑏 1092 0.137 3.535 -18.134 17.694 𝜗𝑏 >0 661 (60.53%) 1.981 2.188 0.0017 17.694 𝜗𝑏 >1 414 2.856 2.356 1.001 17.694 𝜗𝑏 <0 431 (39.47%) -2.69 3.335 -18.134 -0.01 𝜗𝑚 1039 2.488 11.842 -31.875 55.282 𝜗𝑚 > 0 547 (52.64%) 9.793 11.41 0 55.282 𝜗𝑚 > 1 493 10.816 11.568 1.069 55.282 𝜗𝑏< 0 492 (47.36%) -5.634 5.116 -31.875 -0.005 Source: Authors’ calculations. 𝜗𝑏 refers to bilateral aid and 𝜗𝑚 to multilateral aid.
As for bilateral ODA cyclicality, table 2 shows this type of aid was pro-cyclical in 60.53% of
that the magnitude of the ODA cyclicality coefficient is sometimes very high, it scales from -18 to more than 17. Given that some SSA countries are dependent on aid, they can encounter problems if there are times when aid scale down until 17%. This volatility was most pronounced in countries receiving ODA from multilateral agencies. Indeed, the standard deviation is high (3.33 for the whole sample) and much worse in countries where multilateral aid is pro-cyclical (11.41).
Now, we plot the time-varying cyclicality coefficients by country. Figure 2 (see below) shows the evolution of the cyclicality of the government consumption expenditures and ODA for Botswana, Burkina Faso, Cameroon, Nigeria, Rwanda and Uganda. See in appendix for the rest of countries. Figure 2 highlights that each country have experienced different evolution patterns of the cyclicality coefficients of government consumption spending and ODA. While pro-cyclicality of fiscal policy has dropped over the years for Botswana, Cameroon, Rwanda and Uganda, it has increased for Burkina Faso and Nigeria. This finding is consistent with what Frankel, Vegh and Vuletin (2012) found by dividing their sample (1960-2009) into two sub-samples (1960-1999 and 2000-2009). As for ODA cyclicality, we can see that although the cyclicality coefficient has slowly dropped for Nigeria, it has known very high fluctuations for Botswana, Burkina Faso, Cameroon, Rwanda and Uganda. The case of Botswana, one of indisputable growing country in Africa, is important. Indeed, aid received by this country was counter-cyclical between 1992 and 2004 but it is becoming increasingly pro-cyclical contrary to other countries where aid pro-cyclicality is stable or decreasing in recent years.
Figure 2: Time-varying fiscal policy and bilateral ODA cyclicality between 1985 and 2012. In appendix, we report figures for multilateral aid. Note that left axis of each country’s figure is fiscal policy cyclicality coefficient and the right one is ODA cyclicality coefficient. In appendix, we present figures of the other SSA countries.
6-2. Baseline estimate results
We turn now to estimate results obtained from equation (5)’s regression. Note that we focus firstly on general government consumption expenditures.
Table 3 and 4 report the results of the estimations of equation (5) specified for the case of general government consumption expenditures. From the outset, we observe that the effect of ODA pro-cyclicality on fiscal policy behavior depends on the type of aid. Indeed the associated coefficient to aid cyclicality is negative and significant (see table 3) for bilateral aid and positive and significant for multilateral aid (see table 4).
Botswana -4 -2 0 2 4 0 .2 .4 .6 .8 1985 1990 1995 2000 2005 2010 year
Cyclicality fo fiscal policy Cyclicality of ODA Burkina Faso -. 5 0 .5 1 -. 5 0 .5 1 1985 1990 1995 2000 2005 2010 year
Cyclicality of fiscal policy Cyclicality of ODA Cameroon -2 0 2 4 -3 -2 -1 0 1 2 1985 1990 1995 2000 2005 2010 year
Cyclicality of fiscal policy Cyclicality of ODA Nigeria 0 5 10 15 20 0 1 2 3 4 1985 1990 1995 2000 2005 2010 year
Cyclicality of fiscal policy Cyclicality of ODA Rwanda -. 5 0 .5 1 1 .5 0 .5 1 1 .5 1985 1990 1995 2000 2005 2010 year
Cyclicality of fiscal policy Cyclicality of ODA 0 .5 1 1 .5 -1 -. 5 0 .5 1985 1990 1995 2000 2005 2010 year
Cyclicality of fiscal policy Cyclicality of ODA
Table 3: Baseline results for bilateral aid (1) (2) (3) (4) (5) (6) (7) Aidpro, t-1 -0.030*** -0.033*** -0.035*** -0.053*** -0.046*** -0.045*** -0.029** (0.006) (0.003) (0.003) (0.000) (0.000) (0.001) (0.010) Log(gdppc) -0.125 -0.177 -0.322 -0.166 -0.18 -0.926*** -0.097 (0.353) (0.387) (0.138) (0.428) (0.382) (0.005) (0.490) debt 0.152** 0.167** 0.167** 0.199*** 0.215*** 0.404*** 0.165** (0.024) (0.022) (0.028) (0.007) (0.003) (0.000) (0.022) private_credit -0.013*** -0.010** -0.012** -0.013*** -0.016*** 0.014* -0.012*** (0.003) (0.045) (0.019) (0.008) (0.002) (0.058) (0.008) kaopen 0.052 0.075* 0.064 0.039 0.054 0.112** 0.056 (0.188) (0.062) (0.125) (0.321) (0.176) (0.018) (0.164) Inflation 0.412*** 0.373*** 0.395*** 0.505*** 0.511*** 0.441*** 0.399*** (0.000) (0.000) (0.000) (0.000) (0.000) (0.000) (0.000) polity2 0.033*** (0.000) Civil_liberties 0.094** (0.015) xconst 0.092*** (0.000) xropen 0.134*** (0.000) corruption -0.193*** (0.001) Checks 0.079** (0.029) _cons -0.318 0.206 1.436 -0.669 -0.741 3.870* -0.626 (0.760) (0.88) (0.342) (0.632) (0.591) (0.078) (0.570)
Years dummies Yes Yes Yes Yes Yes Yes Yes
Observations 894 842 820 794 794 610 845
Countries 39 37 37 37 37 28 37
R² 0.22 0.245 0.215 0.306 0.324 0.296 0.228
The table reports regression coefficients and in parenthesis the associated p-value ***p<0.01, significant at 1% ; **p<0.05, significant at 5%; *p<0.10, significant at 10%
Table 4: Baseline results for multilateral aid 1 2 3 4 5 6 7 Aidprom, t-1 0.021*** 0.022*** 0.022*** 0.019*** 0.021*** 0.023*** 0.021*** (0.000) (0.000) (0.000) (0.000) (0.000) (0.000) (0.000) Log(gdppc) -0.19 -0.062 -0.178 0.058 -0.012 -0.785** -0.184 (0.17) (0.771) (0.433) (0.979) (0.957) (0.026) (0.207) debt 0.210*** 0.218*** 0.205*** 0.240*** 0.261*** 0.409*** 0.213*** (0.002) (0.003) (0.008) (0.001) (0.000) (0.000) (0.004) private_credit 0.021*** -0.022*** -0.022*** -0.023*** -0.026*** 0.095 -0.021*** (0.000) (0.000) (0.000) (0.000) (0.000) (0.916) (0.000) kaopen 0.051 0.071* 0.045 0.043 0.060 0.074 0.056 (0.208) (0.085) (0.293) (0.294) (0.139) (0.124) (0.176) inflation 0.348*** 0.301*** 0.328*** 0.451*** 0.445*** 0.356*** 0.333*** (0.000) (0.000) (0.000) (0.000) (0.000) (0.000) (0.000) polity2 0.029*** (0.001) Civil_liberties -0.024 (0.556) xconst 0.084*** (0.001) xropen 0.149*** (0.000) corruption -0.247*** (0.000) checks 0.084** (0.021) _cons -0.144 -0.69 -0.0173 -2.004 -2.086 3.035 -0.264 (0.894) (0.628) (0.991) (0.176) (0.151) (0.2) (0.817)
Year_dummies Yes Yes Yes Yes Yes Yes Yes
Obs. 850 799 777 755 755 578 802
Countries 39 37 37 37 37 28 37
R² 0.248 0.276 0.238 0.32 0.346 0.324 0.256
The table reports regression coefficients and in parenthesis the associated p-value ***p<0.01, significant at 1% ; **p<0.05, significant at 5%; *p<0.10, significant at 10%
In all columns of table 3, we reject at the 1 % level that the coefficients associated to “aidpro” is different from zero, except in column (7) where the coefficient is significant at 5% level. Then, pro-cyclical bilateral aid does not cause fiscal policy pro-cyclicality in SSA countries. This is unexpected finding because we was believed that lack of policy space due to
conditions attached to lending by donors (pro-cyclicality) limits the set of policy choices available to countries in response of shocks. Even if previous studies have not worked on the effect of aid cyclicality on fiscal policy, some authors have already shown that a larger share of aid seems to decrease fiscal policy pro-cyclicality, suggesting that access to concessional sources of finance enables countries in SSA to mitigate the tendency for spending growth to follow output growth (Lledó, Yackovlev, and Gadenne, 2009).
However, our hypothesis is confirmed by the case of multilateral ODA. Indeed, the coefficient associated to multilateral aid pro-cyclicality “aidprom” is positive and significant at 1% level in all columns of table 4. Pro-cyclical multilateral aid constrains the ability of low-income countries to run counter-cyclical fiscal policies. This is consistent with the hypothesis according to which pro-cyclical access to international capital markets by developing countries may lead to pro-cyclical fiscal policies (Calderon and Schmidt-Hebbel, 2008; Gavin, Hausmann, Perotti and Talvi, 1996; Kaminsky, Reinhart and Végh, 2004). These results mean that African countries run prudent macroeconomic policies when it comes to their partnership with OECD countries, but they remain more dependent on multilateral agency decisions. This is due to the policy of multilateral agencies like the World Bank and the International Monetary Fund (IMF) that traditionally influence the reforms in developing countries. Then, if there are downwards in developed countries and therefore difficult financial conditions, the multilateral agencies may reduce their assistance to developing countries and ask for them structural reforms which are sometimes tied to budget austerity policies.We will come back with further investigations in the following sections.
Turning to control variables, the results indicate that GDP per capita does not appear to be a relevant determinant of fiscal policy pro-cyclicality in SSA countries. It is significant only in column (6) and shows that higher the GDP per capita, lower the pro-cyclicality of government consumption spending, which is a known result widely agreed among researchers (Lledó,
Yackovlev, and Gadenne, 2009; Alesina and Tabellini (2005); Frankel, Vegh and Vuletin (2012) and so on). While Halland and Bleaney (2011) found no evidence of the effect of the economic development level on fiscal policy in developing countries, Mpatswe, Tapsoba and York (2012) found that wealthier CEMAC countries behave more pro-cyclicality.
As for financing constraint explanations of pro-cyclicality, we observe that credit-to-private sector is consistently significant and negatively associated to government consumption expenditures pro-cyclicality. In other words, financial development by allowing to borrow in any times in order to face fluctuations improves the ability of a country to carry out counter-cyclical fiscal policy. This finding is consistent with Aghion and Marinescu (2008), Frankel, Vegh and Vuletin (2012), Calderon and Schmidt-Hebbel (2008). However, table 3 sheds light that SSA financially opened countries conduct more pro-cyclical fiscal policy. This finding contradicts the arguments put forward about lack of access or imperfect access to international credit markets to explain pro-cyclicality in developing countries (Caballero and Krishnamurthy, 2004; Riascos and Végh, 2004; Gavin and Perotti, 1997; Aizenman et al (2003) and so on). We can explain this result by the fact that in good times financially opened can borrow in international markets to finance policies but in bad times borrowers are fear about the ability of the country to pay back. Such situations have been observed recently in Greece where the exchange was forced to close for this country during bad times in 2010 and opened in 2014 (precisely 10th April) when Greece’s economic performance is recovering. Therefore, be financially integrated can conduct to more pro-cyclicality. Nevertheless, Frankel, Vegh and Vuletin (2012) found that financial integration can allow to carry out less pro-cyclical fiscal policy.
Regarding the macroeconomic policy sustainability and stabilization concern explanations, table 3 highlights that both public debt and inflation lead to a loss of credibility and are associated to more fiscal policy pro-cyclicality. This finding is consistent with Reinhart,
Rogoff and Savastano (2003), Woo (2003), Ben Slimane and Ben Tahar (2010); Aghion and Marinescu (2008). Indeed, difficult macroeconomic conditions (high debt and high inflation) reduce the government’s ability to adjust to the economic cycle and therefore exacerbate the fluctuations.
We now look at political governance and institutions concerns. Results reported in table 3 shows that in SSA countries better governance is not associated to counter-cyclical fiscal policy. All indicators included are strongly significant and affect positively government consumption spending pro-cyclicality. This finding is in line with Woo ( 2008), Erbil (2011), Calderon and Schmidt-Hebbel (2008), Tanzi and Davoodi (1997), Friedman et al. (2000), Ghura (2002) that shown that better governance may do nothing to make fiscal policy less countercyclical: it may simply increase resources (tax revenue) available to support additional pro-cyclical government spending. However, it contradicts those of Frankel, Vegh and Vuletin, 2012; Alesina and Tabellini, 2005; Calderón et al., 2004; Diallo, 2009; Thornton, 2008 and so on that found that stronger institutions (more democracy, less corruption, more control on executives, more checks and balances) are linked to less pro-cyclical fiscal policy. 6-3. Robustness checks
To check the validity of our findings we undertake a number of robustness exercises. It is worth noting that we present in the following section the results for bilateral aid, while those of multilateral aid are reported in appendix.
(i) Bootstrap
Our first experiment essentially concerns the above results. Given that our ODA cyclicality coefficients are estimated variables, they are likely to be measured with error and therefore be biased. To deal with this issue, we follow Diallo (2009) by proposing the residual-based bootstrap method. The idea is to consider the observed sample the population and, at each iteration, draw from this a sub-sample that is used to estimate cyclicality coefficients (fiscal
policy and ODA). We generated 200 bootstrap samples from the given data above. Results reported in table 5 sheds light that bootstrapping estimates are quite similar to previous findings.
Table 5: Bootstrap results for bilateral aid
(1) (2) (3) (4) (5) (6) (7) Aidpro, t-1 -0.026** -0.028*** -0.031*** -0.046*** -0.039*** -0.049*** -0.025*** (0.010) (0.007) (0.004) (0.000) (0.002) (0.000) (0.008) Log(gdppc) -0.123 -0.203 -0.368* -0.142 -0.152 -0.951*** -0.088 (0.239) (0.342) (0.074) (0.441) (0.357) (0.001) (0.412) debt 0.153** 0.179** 0.175* 0.213*** 0.230*** 0.403*** 0.166** (0.025) (0.038) (0.07) (0.003) (0.005) (0.000) (0.021) private_credi t -0.013*** 0.096** 0.011** -0.013*** -0.016*** 0.014* -0.012*** (0.001) (0.022) (0.017) (0.003) (0.001) (0.068) (0.002) kaopen 0.039 0.072 0.058 0.039 0.054 0.109** 0.047 (0.319) (0.111) (0.195) (0.34) (0.139) (0.012) (0.219) Inflation 0.400*** 0.362*** 0.388*** 0.490*** 0.500*** 0.437*** 0.388*** (0.000) (0.000) (0.000) (0.000) (0.000) (0.000) (0.000) polity2 0.036*** (0.000) Civil_libertie s 0.109*** (0.003) xconst 0.099*** (0.000) xropen 0.142*** (0.000) corruption -0.185*** (0.000) Checks 0.089** (0.031) _cons 0.274 0.396 1.817 -0.881 -1.012 4.179** -0.653 (0.783) (0.806) (0.271) (0.503) (0.398) (0.042) (0.543) Year dummies
Yes Yes Yes Yes Yes Yes Yes
Obs. 923 870 848 821 821 628 873
Countries 39 37 37 37 37 28 37
R² 0.224 0.251 0.224 0.314 0.334 0.31 0.233
The table reports regression coefficients and in parenthesis the associated p-value ***p<0.01, significant at 1% ; **p<0.05, significant at 5%; *p<0.10, significant at 10%
More importantly, the coefficients remain strongly significant like those reported in table 3. This said pro-cyclicality of bilateral aid, domestic financial depth and high GDP per capita decease pro-cyclicality of government consumption spending. However, better governance and institutions, a loss of stabilization tool and macroeconomic policy unsustainability conduct to more fiscal policy pro-cyclicality in SSA countries.
Results for multilateral aid (see table A 5 in appendix) are consistent with those of table 4, and show that pro-cyclical multilateral aid leads to pro-cyclical fiscal policy in SSA countries. Furthermore, the coefficients associated to “aidprom” are stable and closely equal to those of table 4.
(ii) Testing for alternative measure of business cycle
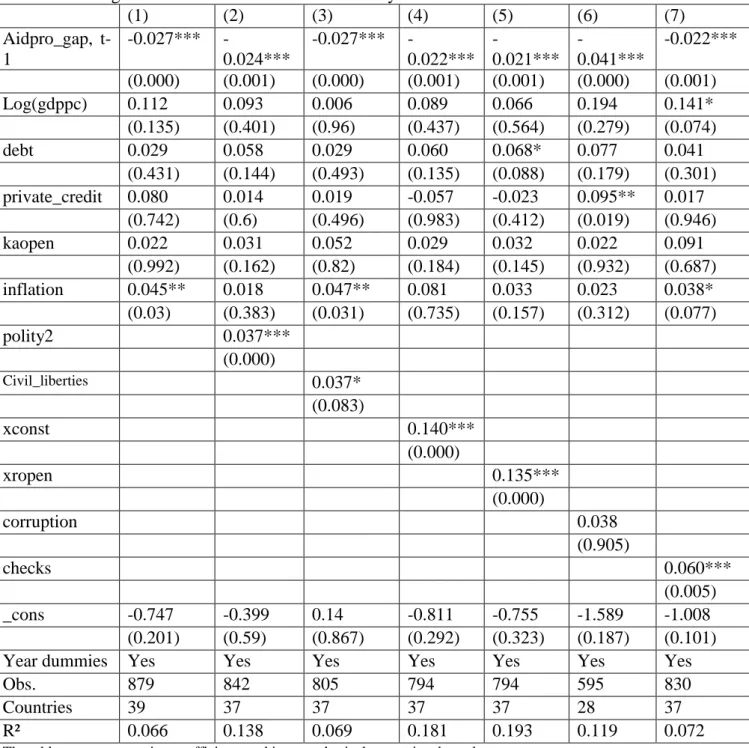
Up to now, we used real annual GDP growth both in SSA and donor countries to measure cyclicality of government consumption spending and ODA, respectively. However, in previous literature some authors have used output gap instead of GDP growth (Aghion and Marinescu, 2008; Frankel, Vegh and Vuletin, 2012; Carmigrani, 2010; Halland and Bleaney, 2011, Woo, 2008; Kaminsky, Reinhart and Vegh, 2004; Talvi and Vegh, 2005). The output gap is estimated as the log deviation from a Hodrick-Prescott trend. The smoothness parameter of the filter is set to 6.25 as suggested by Ravn and Uhlig (2002) for annual data. The results are presented in table 6. On the whole, they tend to support those reported in table 3 about the effect of bilateral ODA pro-cyclicality on government consumption spending behavior. Furthermore, a part from column (6), the magnitude of coefficient associated to ODA cyclicality is stable. For the rest of control variables, they are weakly significant, expect political governance and institutions indicators.
As for multilateral aid whose results are reported in table A5 (in appendix), we observe that the associated coefficients to “aidprom” are positive and very high than those of table 4.
Table 6: Testing for alternative measure of business cycle (1) (2) (3) (4) (5) (6) (7) Aidpro_gap, t-1 -0.027*** -0.024*** -0.027*** -0.022*** -0.021*** -0.041*** -0.022*** (0.000) (0.001) (0.000) (0.001) (0.001) (0.000) (0.001) Log(gdppc) 0.112 0.093 0.006 0.089 0.066 0.194 0.141* (0.135) (0.401) (0.96) (0.437) (0.564) (0.279) (0.074) debt 0.029 0.058 0.029 0.060 0.068* 0.077 0.041 (0.431) (0.144) (0.493) (0.135) (0.088) (0.179) (0.301) private_credit 0.080 0.014 0.019 -0.057 -0.023 0.095** 0.017 (0.742) (0.6) (0.496) (0.983) (0.412) (0.019) (0.946) kaopen 0.022 0.031 0.052 0.029 0.032 0.022 0.091 (0.992) (0.162) (0.82) (0.184) (0.145) (0.932) (0.687) inflation 0.045** 0.018 0.047** 0.081 0.033 0.023 0.038* (0.03) (0.383) (0.031) (0.735) (0.157) (0.312) (0.077) polity2 0.037*** (0.000) Civil_liberties 0.037* (0.083) xconst 0.140*** (0.000) xropen 0.135*** (0.000) corruption 0.038 (0.905) checks 0.060*** (0.005) _cons -0.747 -0.399 0.14 -0.811 -0.755 -1.589 -1.008 (0.201) (0.59) (0.867) (0.292) (0.323) (0.187) (0.101)
Year dummies Yes Yes Yes Yes Yes Yes Yes
Obs. 879 842 805 794 794 595 830
Countries 39 37 37 37 37 28 37
R² 0.066 0.138 0.069 0.181 0.193 0.119 0.072
The table reports regression coefficients and in parenthesis the associated p-value ***p<0.01, significant at 1% ; **p<0.05, significant at 5%; *p<0.10, significant at 10% (iii) Testing for public investment and total expenditure
We now look at what happens for public investment and total expenditures. Heretofore, we have used government consumption spending as main variable to generate cyclicality coefficient. Even if Thornton (2008) argues that there is a strong case for leaving investment spending outside the constraints of fiscal policy, Fata´s (2005), Alesina and Tabellini (2005)
fiscal stance in developing countries because of corruption. So, given the fact that for example a government may change either consumption or investment more in response to a change in output, we follow Erbil (2011) and Mpatswe, Tapsoba and York (2012) by interesting in public investment and government total expenditure. To this end, we generated the time-varying cyclicality coefficient of equation (3) by using public investment and government total spending as dependent variables. Then, we estimated equation (5) for both the two variables.
Results are reported in table A5 (in appendix) for public investment spending and table A6 for government total expenditures (see in appendix). We observe that beyond the fact that the associated coefficients to bilateral ODA cyclicality are significantly similar (highly significant) to those of government consumption, their magnitudes are greater. However, in contrary to government consumption, we find that be financially opened is associated to less pro-cyclicality of public investment and government total expenditures.
As for results of multilateral aid’s equation reported in table A7 and A8 (in appendix), we observe that pro-cyclical multilateral ODA affects positively the pro-cyclicality of public investment spending, while the effect on government total expenditures is mixed positive. Furthermore, the coefficients associated to aid cyclicality for public investment’s equation (table A7) are closely equal to those of government consumption’s equation (table 4).
(iv)Testing for additional controls on baseline specification
We add further controls in the baseline specification (i.e with government consumption spending as fiscal policy variable) in order to take into account other variables likely to affect pro-cyclicality of general government consumption expenditures. These additional controls are IMF programs “imf”, urbanization rate “urban”, the log of public investment “investment”, internal conflict “conflict”, the log of remittance inflows “remittance”, and total expenses over GDP (See in appendix for more details on data sources). Even controlling for these various variables, we found that bilateral ODA pro-cyclicality still affects negatively
government consumption spending cyclicality. Furthermore, these estimations improve the goodness of the previous results.
Table 7: Testing for additional controls on baseline specification
(1) (2) (3) (4) (5) (6) (7) Aidpro, t-1 -0.032*** -0.034*** -0.035*** -0.049*** 0.054*** 0.035** -0.034*** (0.006) (0.002) (0.003) (0.001) (0.000) (0.019) (0.003) Log(gdppc) -0.168 -0.113 -0.078 -0.703** 0.660*** 0.115 -0.182 (0.412) (0.581) (0.715) (0.03) (0.004) (0.665) (0.374) debt 0.168** 0.180** 0.206*** 0.497*** 0.287*** 0.238** 0.168 (0.021) (0.013) (0.007) (0.000) (0.000) (0.011) (0.021) private_credit -0.010** -0.010** -0.014** 0.021*** -0.024*** -0.015** -0.01** (0.042) (0.039) (0.015) (0.005) (0.000) (0.02) (0.045) kaopen 0.076* 0.065 0.086** 0.103** -0.054 -0.036 0.075* (0.062) (0.105) (0.036) (0.029) (0.251) (0.477) (0.067) Inflation 0.374*** 0.368*** 0.377*** 0.382*** 0.590*** 0.455*** 0.371*** (0.000) (0.000) (0.000) (0.000) (0.000) (0.000) (0.000) polity2 0.033*** 0.034*** 0.031*** 0.032*** 0.0256*** 0.040*** 0.031*** (0.000) (0.000) (0.000) (0.002) (0.009) (0.001) (0.001) imf -0.047 (0.506) Log(urban) -0.978*** (0.002) investment -0.108 (0.169) conflict -0.032 (0.194) remitance 3.122*** (0.001) expense 0.105 (0.622) aid 0.037 (0.489) _cons 0.17 2.869* -0.215 1.933 -6.092*** -2.588 0.061 (0.901) (0.072) (0.882) (0.364) (0.000) (0.179) (0.965) Year dummies
Yes Yes Yes Yes Yes Yes Yes
Obs. 842 842 826 595 647 604 838
Countries 37 37 37 29 31 32 37
R² 0.245 0.2544 0.2508 0.3206 0.3167 0.2608 0.245
The table reports regression coefficients and in parenthesis the associated p-value ***p<0.01, significant at 1% ; **p<0.05, significant at 5%; *p<0.10, significant at 10%
All these additional controls are checked for multilateral aid and the results are reported in table A9 (in appendix). We observe that even controlling for other determinants of fiscal policy behavior, pro-cyclical ODA from multilateral agencies still leads to more pro-cyclical government consumption spending.
(v) Testing for alternative estimation method: instrumentation
Finally, we investigate whether the estimates are robust to using alternative estimation methods. Heretofore, we have lagged ODA pro-cyclicality coefficients in order to avoid simultaneity issue and therefore endogeneity problem. If we drop this assumption, there are reasons to believe in endogeneity issue in our estimates. Indeed, governments can anticipate donor behaviors and then decide which policies they will rule. Furthermore, donor countries can make pressure on aid recipient countries-that is the so-called conditionality- and so dictate their fiscal policy behaviors. Then, causation may rule in two directions. As a consequence, the dropped lag of the above fixed effects estimations on the impact of ODA cyclicality on fiscal policy cyclicality may be biased. To account for the potential endogeneity of aid, we re-estimate equation (5) by two-stage least squares (2SLS). Concretely, we propose to address the endogeneity issue by instrumenting ODA cyclicality coefficients with its lagged values, the average degree of independence of the donor’s development agencies “agency” and the average voting similarity index “proximity” at the United Nations General Assembly. The addition of external instruments weakens the potential “weak instruments” problem that often arises in using only lagged values.
As for agency independence and proximity variable calculations, we replicate the formula written in section 3. Then, proximity (agency) is defined as political proximity (degree of agency’s independence) to the average weighted by the amount of aid a country receives from that particular donor. Political proximity is the voting similarity index that is equal to total of votes where both states agree over total of joint votes. The data are drawn from United
Nations General Assembly Voting Data (Strezhney and Voeten, 2013). Regarding the degree of donor’s agency independence, we used those constructed by Bertoli, Cornia and Manaresi (2008) and updated by Fuchs, Dreher and Nunnenkamp (2014). This variable takes one if the aid agency is independent from the Ministry of Foreign Affairs and zero otherwise.
We now discuss on the relevance and exogeneity of these instruments. With respect to aid agency, Bertoli, Cornia and Manaresi (2008) argued that countries where aid is provided by an ‘independent aid agency’ may be less exposed to the whims of political-electoral cycles and thus exhibit higher and more stable aid to GDP ratios than countries where aid decisions are taken by the foreign affairs ministry or the prime minister’s office, i.e. institutions exposed to conflicting demands for funds (p. 14). Such assertion means that aid agency independence has an effect on aid donation but it is unbelievable that development agencies have a direct effect on recipients’ fiscal policy behavior apart from aid channel. We expect that recipient countries whose aid is from independent aid agencies less suffer of donor macroeconomic constraints. As for political proximity, many studies found that aid tends to be low and less effective when political ideology differs between the donor and the recipient (Neumayer, 2003; Dreher et al, 2013; Bobba and Powell, 2007; Alesina and Dollar, 2000). Alesina and Dollar (2000) argue that the ―direction of foreign aid is dictated by political and strategic considerations, much more than by the economic needs and policy performance of the recipients. Therefore, we suspect political proximity to impact aid donation but not directly on recipients’ fiscal policy behavior. To conclude, our instruments appear relevant (i.e they are correlated with ODA cyclicality) and exogenous (i.e they are uncorrelated with recipients’ fiscal policy cyclicality). We will test the relevance and exogeneity of our instruments by using the Anderson’s test of under-identification, the Cragg-Donald’s test of weak identification and the Sargan test of overidentification. The results of the fixed effects 2SLS estimator are presented in table 8. See in appendix for those of first stage.