HAL Id: halshs-01160814
https://halshs.archives-ouvertes.fr/halshs-01160814
Preprint submitted on 8 Jun 2015HAL is a multi-disciplinary open access archive for the deposit and dissemination of sci-entific research documents, whether they are pub-lished or not. The documents may come from teaching and research institutions in France or abroad, or from public or private research centers.
L’archive ouverte pluridisciplinaire HAL, est destinée au dépôt et à la diffusion de documents scientifiques de niveau recherche, publiés ou non, émanant des établissements d’enseignement et de recherche français ou étrangers, des laboratoires publics ou privés.
MADAGASCAR YOUNG ADULT TRANSITIONS
SURVEY - Preliminary Descriptive Results
Catalina Herrera Almanza, Frédéric Aubery, Francesca Marchetta, Aurore
Pelissier, Harivelo Rajemison, Faly Rakotomanana, David Sahn, Kira Villa
To cite this version:
Catalina Herrera Almanza, Frédéric Aubery, Francesca Marchetta, Aurore Pelissier, Harivelo Rajemi-son, et al.. MADAGASCAR YOUNG ADULT TRANSITIONS SURVEY - Preliminary Descriptive Results. 2015. �halshs-01160814�
1
C E N T R E D'E T U D E S E T D E R E C H E R C H E S S U R L E D E V E L O P P E M E N T I N T E R N A T I O N A L
SERIE ETUDES ET DOCUMENTS DU CERDI
MADAGASCAR YOUNG ADULT TRANSITIONS SURVEY
Preliminary Descriptive Results
Catalina Herrera Almanza, Fred Aubery, Francesca Marchetta, Aurore Pélissier, Harivelo
Rajemison, Faly Rakotomanana, David Sahn, and Kira Villa
Etudes et Documents n° 23
November 2013
CERDI
65 BD. F. MITTERRAND
63000 CLERMONT FERRAND - FRANCE TÉL. 0473177400
FAX 0473177428 www.cerdi.org
2 Etudes et Documents n° 23, CERDI, 2013
The authors
Catalina Herrera Almanza, Cornell University
Fred Aubery,
Clermont Université, Université d'Auvergne, CNRS, UMR 6587, CERDI, F-63009 Clermont FdFrancesca Marchetta,
Clermont Université, Université d'Auvergne, CNRS, UMR 6587, CERDI, F-63009 Clermont FdAurore Pélissier,
Clermont Université, Université d'Auvergne, CNRS, UMR 6587, CERDI, F-63009 Clermont FdHarivelo Rajemison, INSTAT Madagascar
Faly Rakotomanana, INSTAT Madagascar
David Sahn, Cornell University and CERDI
Kira Villa, Cornell University
Corresponding author:
[email protected]
La série des Etudes et Documents du CERDI est consultable sur le site : http://www.cerdi.org/ed
Directeur de la publication : Patrick Plane
Directeur de la rédaction : Catherine Araujo Bonjean Responsable d’édition : Annie Cohade
ISSN : 2114 - 7957
Avertissement :
Les commentaires et analyses développés n’engagent que leurs auteurs qui restent seuls responsables des erreurs et insuffisances.
This work was supported by the LABEX IDGM+ (ANR-10-LABX-14-01) within the program “Investissements d’Avenir” operated by the French National Research Agency (ANR)
3
Abstract
This report provides a preliminary descriptive analysis of the Madagascar Youth Transition
Survey 2012–13 (Enquête Statistique sur les itinéraires de vie des jeunes à Madagascar
2012-13).
This survey is the last round of a cohort panel following children from around age 8 (for
about half the sample) or age 15 (for the remainder) to their early 20s. The first two surveys
were mainly focused on schooling and skills and were complemented by school surveys and
by community surveys. This new survey re-interviewed the cohort members and their
households and updated the community information. This last round of the survey was
designed to improve our understanding of the determinants and impacts of the major life
course transitions—involving marriage, family, schooling, and work—of young people in
Madagascar. The purpose of this report is to provide the reader with a sense of the scope
and nature of the data set and with some information about the lives of young adults in
Madagascar.
We acknowledge the support of The William and Flora Hewlett Foundation, the Agence
inter-établissements de recherche pour le développement (AIRD) and the Agence française de
développement (AFD), who funded this work as part of the DEMTREND project. The authors
4
Index
INTRODUCTION ... 5
A. THE SURVEY ... 6
B. DESCRIPTIVE DATA ... 10
1. Households characteristics ... 102. Cohort member basic characteristics ... 15
3. Education ... 19
4. Test scores ... 25
5. Employment and Earnings ... 30
6. Health ... 36
6.1 Smoking ... 36
6.2 Alcohol consumption ... 36
6.3 Diseases ... 37
7. Fertility, Family Planning and Anthropometric Outcomes ... 42
8. Migration... 49
9. Personality Traits ... 53
10. Entrepreneurship ... 57
5
INTRODUCTION
The transition from adolescence to adulthood is a critical period in the life course. The decisions that young people and their families make regarding transitions from school into work, marriage, and parenthood will affect their opportunities and well-being for the rest of their lives. For example, given the exhaustively documented link between the level of education and individual earnings, choices about how long to continue schooling will be a major determinant of the eventual standard of living enjoyed by young men and women. For young women in particular, changes in the timing of other key transitions, such as a longer delay of marriage and motherhood, may lead to significant changes in their ability to engage in productive and remunerative work and to achieve economic and social parity with men. Delays of marriage and motherhood may also significantly reduce health risks to young women that occur through early pregnancy and heightened HIV risk from older spouses.
In developing countries, these choices also have profound implications for aggregate welfare and economic growth. If young women start families later in life and consequently have fewer dependents, more family resources will be available for savings and investment, and more female labor available to fuel economic development. This “demographic dividend” has already greatly benefited East Asia, but in other regions, notably sub-Saharan Africa, it has yet to occur. Further, there are widely documented associations of small family size and better child health and schooling outcomes, as well as between later age at marriage or childbearing and these child outcomes. Hence delays in childbearing and reduced fertility are likely to have important benefits for the well-being and healthy development of children.
Many factors condition the early life course transitions of young people: family background, the policy environment (e.g., school quality and access, family planning services or promotion), unplanned economic and health events, community norms, and incentives such as labor demand. These transitions can also be conditioned by prior decisions and behaviors that are largely or completely irreversible, such as leaving school early or having a child. These behaviors therefore are inherently dynamic and path-dependent.
For disadvantaged young people, the nature and timing of the transitions to adult roles as labor force participants, spouses, and parents will significantly determine whether they are able to escape from the poverty of their parents, or if this poverty will persist across generations. The analysis of early life course transitions is therefore closely linked to another important research area attracting considerable attention in both developed and developing countries: intergenerational economic mobility, or conversely, the intergenerational transmission of poverty. Studies from widely varying settings demonstrate strong associations between the education and incomes of parents and those of their offspring. What is less clear, especially in developing countries, is the extent to which this relationship is truly causal, and how parental and household characteristics, as opposed to the institutional environment (including for example, labor market conditions) and specific policies, shape outcomes for young people. Understanding the phenomenon of poverty persistence at the individual or household level, in turn, promises to shed light on the broader riddle of why some economies, or subgroups within an economy, are able to move out of poverty and others do not.
Potentially, research has a great deal to contribute to the design of policies to improve the lives of young people and break the transmission of poverty from one generation to the next. The need for such policy-relevant research is nowhere greater than in sub-Saharan Africa, where poverty
6 is more widespread and persistent than in any other region, where levels of human capital and productivity are the lowest, and where low schooling, early marriage, and high fertility of women remains pervasive, hampering progress toward economic and social gender equality.
Our project made substantive contributions in two ways. First, we collected and made publicly available high-quality panel data from Madagascar covering young people from early primary school age to early adulthood, data that will provide the required longitudinal dimension and will be designed to permit a range of non-experimental approaches to causal inference. These surveys form a cohort panel following children from around age 8 (for about half the sample) or age 15 (for the remainder) to their early 20s. The 2003 and 2004 household surveys were complemented by community surveys and school surveys that provided detailed information on the local environment and services, including family planning services. These new surveys re-interviewed the cohort members and their households and updated the community information. The survey instrument for the second 2012–13 surveys can be viewed at:
<http://www.saga.cornell.edu/Madagascar2010/survey2010.html>
The purpose of this report is to present some descriptive statistics and related analysis of the 2012–13 survey data. We do not attempt to be comprehensive. Rather, our purpose is to provide the reader with a sense of the scope and nature of the data set and some information about the lives of young adults in Madagascar.
The remainder of this report is organized as follows: In Section A we present a brief description of the survey. This is followed, in Section B, with a presentation of descriptive statistics that correspond to the major modules or themes covered by the survey. They are as follows: Households characteristics, Cohort member basic characteristics, Education, Test scores, Employment and earnings, Health, Fertility, Family planning and anthropometric outcomes, Migration, Personality traits, Entrepreneurship, and Agriculture.
THE SURVEY
Panel household survey data, almost non-existent in developing countries a few decades ago, are now considerably more common. What remains quite rare, however, are long-term panels covering periods of more than a few years. Such data are needed to properly understand many important aspects of behavior as related to human capital accumulation and poverty transmission across generations, and impacts of policy on both issues.
As indicated, the overall project uses two periods of data collection: first, the Madagascar Study on Academic Progress and Academic Performance in Madagascar (EPSPAM) survey from 2004, and second, the Madagascar Youth Transition Survey 2012–13. In the second survey, we revisited most of the approximately 1800 households in the earlier sample, and administered specialized surveys (described below) to members in each household in the cohort of children born between 1986–1989. Some of these individuals were still living in their 2003/4 households; others will have moved away. Procedures used for finding and interviewing the latter group are described below.
The survey instruments consisted of: (1) primary surveys of the cohort members (the “target respondents”); (2) re-surveys of their originating households; and (3) an update of the community
7 surveys on local infrastructure and services. We describe these survey instruments next, and then discuss procedures for tracking original respondents for the re-survey.
(1) Individual surveys of target respondents: The surveys administered to the cohort sample (aged 21–24 in 2002–13) were the primary survey instrument and covered the following main areas: education, migration, and employment histories; illness episodes and disability; marital and childbearing history; living arrangements; and assets and transfers to and from other households. The format of these modules was generally designed to be the same as in the 2003/4 surveys so as to facilitate constructing full histories using both data sets. As in the earlier survey, the data provided the basis for event history analysis of migration, work, and other life course transitions. It was designed to capture all such events and their timing since the previous survey. In some cases, additional detail relative to the earlier survey modules was gathered to obtain more information for the analysis of early life course transitions. We highlight a few of these areas:
Contraceptive use and fertility histories: Administered to the women in the target cohort sample, this new module was patterned after similar modules in Demographic and Health Surveys. It recorded knowledge and use of different methods of contraception, attitudes toward contraception, and desired family size and spacing. Fertility histories were gathered to provide information on the timing of all pregnancies and live births and use of pre- and post-natal care for each birth. Respondents were also asked about contraceptive availability (distance and travel costs to different sources), price, and periods when they could not be obtained.
Transfers and remittances: For many young men and women no longer living at home, transfers from parents and others could be an important means of support. In other cases, individuals who are working may remit funds to their originating households. To understand these flows and how they evolve, information on amounts and relationships with senders or recipients was gathered for each year the individual had been away from home (the 2003 survey recorded this information for the prior 12 months only). Information was also recorded on assets at marriage and bride price, or dowry, if relevant.
Expanded education module: Unusually detailed information was collected on the education of all cohort members to provide a complete record of individual schooling careers that could be linked to household events and characteristics, community factors, and policies. The information gathered included, among many other variables, school entry and completion or quitting ages and dates, grade repetitions and schooling interruptions and their timing, time allocated to schoolwork, education expenses, and financial assistance from schools and relatives for education purposes. Travel times and distances to schools attended, as well as schools not chosen, were recorded; the schools were identified using names and predetermined identification codes for matching to surveys of schools and the community that were also conducted.
Employment, job search, and training: We recorded standard information on work (for pay and in-kind and detailed information on work patterns for children, including detailed questions on the cohort members’ job searches and desired employment, training (on and off the job), and pay. This module was designed to capture, in a level of detail not often seen in most household surveys, the economic activities and time allocation of children and youth, including household work, farm or enterprise work, and wage labor. Information included the year that work began and the time allocated to this work and to schoolwork at that time and currently for those still enrolled.
8 Parents’ family backgrounds: Atypically for household surveys, a range of questions was asked about the childhoods and family backgrounds of each adult in the household. These included questions on their own parents’ state of health when they (the adult respondents) were 10 years old, whether their parents were absent at that time, and the year of death if the parents had died. Adult respondents were also asked a set of questions pertaining to the health and education infrastructure of the place they lived as children: presence of a primary school and lower and upper secondary schools within 5 km of their homes, and presence of a health clinic. Information was also collected on basic characteristics of their family’s dwelling, their parents’ education levels (as noted), as well as their occupations, and the number of older and younger brothers and sisters and their completed education. These data allowed for an exploration of the links between parents and children over three generations, as well as provided means of statistically identifying the impact of parental schooling and wealth on children’s outcomes.
Histories of economic and health events: Many questions were asked about events affecting family and individual well-being, typically referring to the 10-year period before the survey. These events included parental death, illness, or disability of all individuals in the household; unemployment spells; enterprise failure, years of unusually bad or good harvests, and enterprise revenues; and planned and unplanned losses or acquisitions of land, livestock, and other assets. Information was collected on the year of occurrence and duration, where relevant. This information provided a year-by-year picture of major economic and health events affecting the members of the household, and was updated in the recent survey. Further, the data on exogenous shocks also provided a means of statistically identifying endogenous behaviors such as schooling duration.
Cognitive tests: Each respondent took short tests of ability in math and French. As in the 2003/4 survey, there were both oral and written math tests. As before, we developed and tested the questions for the tests in collaboration with local institutions and with the assistance of other experts in test design. There were some common items in the 2013 and 2003 tests to facilitate comparisons across surveys.
(2) Household surveys (of originating households): In the vast majority of cases, the process of locating members of the cohort involved first contacting the individual’s 2003 household. Whether the target respondent was living at home or had moved away, we administered during these contacts a relatively short survey to the head or other members of the household on events and changes since the previous interview. The main motivation for these interviews was to update information on important economic or life course events experienced by the household and its members. This included information on various outcomes (education, health, marriage, and childbearing, etc.) for younger and older siblings of those in the cohort. This information was useful because, as described below, several estimation techniques as well as questions of interest rely on variation across children of different ages within a household. The questionnaires followed the basic event-history structure of the 2003/4 surveys. Since survey personnel needed to visit these households as the first step in tracking the cohort members, these household surveys raised no challenging logistical or financial issues. Of course, in many instances a target respondent was still living in the households, in which case there essentially was a single interview process.
In a number of cases, follow-up did not involve visiting the original households. This occurred when the household has moved (or dissolved), and we obtained information on the (separate)
9 location of the target cohort members from other sources in the community. In these cases, information on key household events of the original household were obtained from the target respondents: these individuals, now adults and (presumably) maintaining ties with their families, know, for example, about parental illness or death, and a father’s retirement or loss of employment. Respondents were also asked basic questions about their siblings, such as schooling and marital status. Enumerators administered this short module using preprinted lists of household members’ identification codes and names from the 2003 survey.
(3) Community surveys: These re-surveys were implemented in each of the original 2004 clusters. They updated information on the availability and timing of introduction of various services and programs, including health and family planning services and schools, and other important developments in the community. This information was relevant for understanding the schooling and family transitions of young people occurring since the last survey. For members of the cohort who now reside elsewhere, the information gathered in these surveys obviously captured their exposure to different services only up to the period they left. We did not expect it to be feasible to gather detailed community information in the areas to which such individuals have migrated, given their dispersion to different towns and communities. However, the individual survey instruments collected some information on local services, e.g., the nearest available source of family planning services and contraception, as noted above.
1. Tracking Respondents
Longitudinal data are only as good as the follow-up whereby baseline participants are relocated and re-interviewed. When migration is substantial and selective, inferences about changes in household well-being over time, for example, if based only on panel analysis of those who remain in their original locations, may be very misleading. For analyzing behavioral dynamics and welfare outcomes for people who have recently entered adulthood, the hazards may be particularly acute. For these individuals, geographical mobility is often a key aspect of life course transitions, as young people move out of their parents’ households (and often, away from their home communities) to marry or work. Achieving high rates of follow-up in developing country contexts was challenging but possible, as we identified adequate resources and effort to do so.
The tracking and re-interview of the 2003/4 survey respondents took place in two main stages. In the first, survey teams returned to the original sample clusters with pre-printed lists of household addresses and names of household members and their basic characteristics. If a household was no longer at its original location, inquiries were made with neighbors and community leaders as to its current location. If the household had moved to another residence in the cluster or reasonably close by, it was visited in the same initial stage. For located households, survey personnel asked about the residence of children in the cohort, now aged 21–24. Those still living in the same households (expected to be about half, as discussed below) or in other locations nearby were interviewed in this phase. Locations, addresses, and phone numbers of other target respondents were obtained for later interview. The household itself was asked to respond to a questionnaire updating information since the 2003 survey, as described above.
For target respondents who were no longer in their original locations, there were two basic situations: First, the family of the respondent had been located in the first stage and information on current residences of the target individual obtained. Second, the original household itself had moved.
10 In the latter, the teams asked neighbors, community leaders or administrators, shopkeepers, and others about the location of the household, and of the target respondents specifically, as these could differ. Other panel survey experience in developing countries, including our own experience in 2003 in locating children in the original PASEC sample, suggested that it would not be difficult to obtain this information in the vast majority of cases. The second stage consisted of using this information to plan and carry out the interviews of target respondents who are in new locations.
As result of these efforts, we achieved a target attrition rate of less than 10 percent.
2. Other Survey Implementation Issues
The objective of collecting high quality data was achieved, due to several factors. One was the extensive experience of the institutions in conducting survey work in this and similar environments. A second was that the various institutions had worked successfully in the previous survey to produce high-quality data that yielded valuable and original analyses. A third was that this was a panel data collection, using similar instruments as before and using the same households and individuals. This had many benefits, among them that both households and communities in the panel have been sensitized to the survey process, so outreach will not be difficult.
(1) Interviewer and supervisor training: Many of the experienced individuals involved in the previous survey were available for work on the new surveys. As before, training was the key to success, requiring several weeks. We trained more personnel than were eventually selected for the work, with selection based on instructor evaluations and performance on tests at the completion of training. As in the 2003/4 surveys, the number of interviewers was kept relatively small with each team working under a highly trained supervisor.
(2) Field testing: The household and individual (cohort) questionnaires and the cognitive tests were field tested in several rural and one urban location. Adequate time was allotted for thorough review and revision of questionnaires and tests as well as the data entry program as required.
(3) Data entry and data quality: Problems of electricity supply in many rural areas made computerized data collection, otherwise advantageous, problematic. In addition, not all interviewers were comfortable with using computers to note responses. Therefore, we stayed with the standard paper-and-pencil interview, as used for the previous survey. The data entry programs were developed in Madagascar and were written with complex consistency checks that were built into the program.
DESCRIPTIVE DATA
1. Households characteristics
This section presents descriptive statistics on the households where cohort members live. The number of households is lower than the number of cohort members since some of them live in the same household.
11 Among the 1,555 households interviewed, 697 are defined as “original households,” meaning that they are the same as in 2003/4 survey, while 858 are newly established households (Table 1.1).
In terms of household size, the average number of household members is 4.69, and the distribution is shown in Table 1.2. Approximately 60% of the sample households have four or more members, and the percentage of very large households is not negligible, with 15% per cent of the sample households having more than seven members.
Table 1.3 shows the dependency rate, which is defined as number of dependents (individuals aged less than 15 or more than 64) as compared to the number of working age members (aged between 15 and 64 years old). It ranges from zero to four, with an average of 0.49.
As shown in Table 1.4, more than 80% of the heads of households are males. In about half of the cases, they had not attained any school diploma. Approximately 25% of household heads completed primary school, and about 17% completed college. Just a small percentage of household heads had earned a university diploma (see Table 1.5).
To initially assess the households’ living standards, we analyzed some characteristics of their dwellings. The questionnaire contained a section with questions addressed to heads of the household about the conditions of their dwellings.
Concerning the type of kitchen, almost 42% of the kitchens were identified as being indoors by the heads of households; another 42% were described as outdoor kitchens, while almost 15% of the sample households do not have a kitchen in their dwellings (Table 1.6).
Table 1.7 shows that almost half of the sample households use a wood latrine platform; just a small percentage of them have a toilet seat or a squat toilet, while more than 30% of the households surveyed do not have any type of toilet at their disposal.
Concerning the water sources in the rainy season, 32% households are compelled to use water obtained from a river, lake or spring. A public tap is the source of water used by 28% of the households, followed by water from a well (without a pump), used by around 20% of the households. Less than 10% of the households have either an indoor or outdoor private tap (Table 1.8).
Table 1.9 shows that around 60% of the households use wood as the main source of fuel, while 37% use charcoal.
Table 1.10 provides information on the number of rooms in the dwelling, not including toilet and kitchen. Thirty-seven percent of the households have only single-room dwellings, and about 34% of the households live in 2-rooms dwellings. The number of rooms in a dwelling, divided by the number of persons living in the household, is a measure of the crowded conditions in which the residents live: the average in our sample is 0.56.
12
Tables
Table 1.1 Household type
All
N Percent
Original household 697 44.82
New household 858 55.18
Total 1,555 100.00
Table 1.2 Household size
All N Percent 1 112 7.20 2 196 12.60 3 339 21.80 4 245 15.76 5 171 11.00 6 125 8.04 7 117 7.52 8 91 5.85 More than 8 159 10.23 Total 1,555 100.00
Table 1.3 Dependency rate
All N Percent 0 447 28.75 0 < dep ≤ 0.5 630 40.51 0.5 < dep ≤1 372 23.92 More than 1 106 6.82 Total 1,555 100.00
Table 1.4 Gender of household head
All
N Percent
Male 1,284 82.57
Female 271 17.43
13
Table 1.5 Education of household head (highest diploma attained)
All
N Percent
No diploma 750 48.23
CEPE (Completed primary school) 374 24.05
BEPC (Completed college) 259 16.66
BAC (Completed high school) 92 5.92 DEIG/BAC+2 (2nd year University) 30 1.93 LICENCE/BAC+3 (3rd year University) 32 2.06 MAITRISE/BAC+4 (4th year University) 7 0.45 DEA/BAC+5 (5th year University) 5 0.32
PhD 3 0.19
Other 3 0.19
Total 1,555 100.00
Table 1.6 Type of kitchen
All N Percent Indoor kitchen 653 41.99 Outdoor kitchen 666 42.83 No kitchen 229 14.73 No information 7 0.45 Total 1,555 100.00
Table 1.7 Kind of toilet
All
N Percent
Toilet seat 33 2.12
Squat toilet 27 1.74
Latrine platform, concrete 86 5.53 Latrine platform, wood 719 46.24
Open hole 158 10.16
None (nature) 522 33.57
Others 2 0.13
No information 10 0.51
14
Table 1.8 Water source, rainy season
All
N Percent
Indoor tap 75 4.32
Public tap 432 27.78
Private outdoor tap 65 4.18
River, lake or spring 502 32.28
Well without pump, covered 184 11.83 Well without pump, not covered 154 9.90
Well pump 65 4.18
Rain water 67 4.31
Water seller 1 0.06
No information 10 0.64
Total 1,555 100.00
Table 1.9 Kind of fuel
All N Percent Wood 929 59.74 Charcoal 575 36.98 Gas 2 0.13 Electricity 20 1.29 Oil 1 0.06 No information 28 1.80 Total 1,555 100.00
Table 1.10 Number of rooms in dwelling (without kitchen and toilet)
All N Percent 1 581 37.36 2 536 34.47 3 176 11.32 4 167 10.74 5 90 5.79 No information 5 0.32 Total 1,555 100.00
15
2. Cohort member basic characteristics
This section provides basic information on cohort members. Half of the cohort members live in the same household they lived in 2004, and half live in a new household (Table 2.1).
The sample of cohort members is almost equally split between men and women, with a slight prevalence of women, which represent 52.32% (Table 2.2). The average age of cohort members is 22 years old, and the average is the same for males and females (Table 2.3).
Table 2.4 shows that 22% of the cohort members are heads of their households, and the percentage is far higher for males (34.9%) than for females (9.98%). Conversely, only a small percentage of males in the survey are spouses of females identified as household head (0.74%), while the majority of females are in this relationship with the head of the household (40.58%). Most of the cohort members are children of the household head—almost half of the men and around 38% of the women.
Table 2.5 shows the ethnicity of the cohort members; we reported only the ethnicities that included more than 3% of the cohort members. The largest and most dominant of the groups is the Merina people; the second and third largest groups are the Betsileo and the Betsimisaraka, respectively.
Concerning marital status, almost 36% of the cohort members are married, and the percentage is far larger for women rather than for men (44% vs. 28%). There is quite a wide variability in the duration of the marriage (Table 2.7): most of the marriages have been contracted one or two years before the survey, but approximately 46% of cohort members have been married for more than four years, and the percentage is higher for women (54.71%) in marriages of longer duration.
Table 2.8 and Table 2.10 show that around 43% of cohort members live with their mothers, and around 36% live with their father. Both of these groups are more largely populated by males, and this probably reflects the higher number of women who left their own households when they married.
About 15% of the mothers and 24% of the fathers of cohort members are dead. Again we observe a difference between men and women, with the data showing that men’s parents are more likely to have died (Tables 2.9 and 2.11). There was also a small percentage of cohort members who declared that they did not know if their parents were still alive.
Tables
Table 2.1 Household type
All
N Percent
Original household 835 48.97 Old household 870 51.03
16 Table 2.2 Gender All N Percent Male 813 47.68 Female 892 52.32 Total 1,705 100.00 Table 2.3 Age
All Males Females
N Percent N Percent N Percent
14 1 0.06 0 0.00 1 0.11 15 2 0.12 1 0.12 1 0.11 17 3 0.18 2 0.25 1 0.11 18 2 0.12 1 0.12 1 0.11 19 32 1.88 10 1.23 22 2.47 20 101 5.92 46 5.66 55 6.17 21 517 30.32 260 31.98 257 28.81 22 478 28.04 209 25.71 269 30.16 23 402 23.58 199 24.48 203 22.76 24 125 7.33 57 7.01 68 7.62 25 35 2.05 22 2.71 13 1.46 26 5 0.29 4 0.49 1 0.11 27 2 0.12 2 0.25 0 0.00 Total 1,705 100.00 813 100.00 892 100.00
17
Table 2.4 Relationship to the household head
All Males Females
N Percent N Percent N Percent
1. Household head 373 21.88 284 34.93 89 9.98 2. Spouse 368 21.58 6 0.74 362 40.58 3. Child 740 43.40 399 49.08 341 38.23 4. Adopted child 12 0.70 9 1.11 3 0.34 5. Grandson or granddaughter 46 2.70 26 3.20 20 2.24 6. Nephew or Niece 49 2.87 27 3.32 22 2.47 8. Brother or Sister 40 2.35 17 2.09 23 2.58 9. Son or Daughter-in-law 4 0.23 2 0.25 2 0.22 10. Brother- or Sister-in-law 14 0.82 7 0.86 7 0.78 12. Father- or Mother-in-Law 2 0.12 1 0.12 1 0.11 13. Cousin 9 0.53 4 0.49 5 0.56 14. Other relative 1 0.06 0 0.00 1 0.11 15. Adopted child 7 0.41 7 0.86 0 0.00 16. No relationship 6 0.35 4 0.49 2 0.22 No information 34 1.99 20 2.46 14 1.57 Total 1,705 100.00 813 100.00 892 100.00 Table 2.5 Ethnicity
All Males Females
N Percent N Percent N Percent
Antandroy 105 6.16 54 6.64 51 5.72 Antesaka 65 3.81 31 3.81 34 3.81 Betsileo 330 19.35 150 18.45 180 20.18 Betsimisaraka 199 11.67 92 11.32 107 12.00 Merina 430 25.22 225 27.68 205 22.98 Sakalava 103 6.04 46 5.66 57 6.39 Sihanaka 74 4.34 38 4.67 36 4.04 Tanala 60 3.52 26 3.20 34 3.81 Tsimihety 128 7.51 68 8.36 60 6.73 Others 211 12.38 83 10.21 128 14.35 Total 1,705 100.00 813 100.00 892 100.00
18
Table 2.6 Marital status
All Males Females
N Percent N Percent N Percent
Married 622 36.48 229 28.17 393 44.06 Single 1,083 63.52 584 71.83 499 55.94 Total 1,705 100.00 813 100.00 892 100.00
Table 2.7 Marriage duration, years
All Males Females
N Percent N Percent N Percent
0 2 0.32 1 0.44 1 0.25 1 110 17.68 54 23.58 56 14.25 2 122 19.61 65 28.38 57 14.50 3 95 15.27 32 13.97 63 16.03 4 94 15.11 36 15.97 58 14.76 5 66 10.61 15 6.55 51 12.98 6 73 11.74 14 6.11 59 15.01 7 35 5.63 5 2.18 30 7.63 8 and more 23 3.71 6 2.62 17 4.33 No information 2 0.32 1 0.44 1 0.25 Total 622 100.00 229 100.00 393 100.00
Table 2.8 Mother living in the same household
All Males Females
N Percent N Percent N Percent
Yes 729 42.76 383 47.11 346 38.79
No 969 56.83 426 52.40 543 60.87
No information 7 0.41 4 0.49 3 0.34
Total 1,705 100.00 813 100.00 892 100.00
Table 2.9 Mother died
All Males Females
N Percent N Percent N Percent Yes 145 14.95 82 19.25 63 11.60 No 824 85.05 344 80.75 480 88.40 Total 969 100.00 426 100.00 543 100.00
19
Table 2.10 Father living in the same household
All Males Females
N Percent N Percent N Percent
Yes 612 35.89 335 41.21 277 31.05
No 1,087 63.75 475 58.43 612 68.61
No information 6 0.35 3 0.37 3 0.34
Total 1,705 100.00 813 100.00 892 100.00
Table 2.11 Father died
All Males Females
N Percent N Percent N Percent
Yes 258 23.74 123 25.89 135 22.06 No 793 72.95 339 71.37 454 74.18 Don’t know 26 2.39 8 1.68 18 2.94 No information 10 0.92 5 1.06 5 0.82 Total 1,087 100.00 475 100.00 612 100.00
3. Education
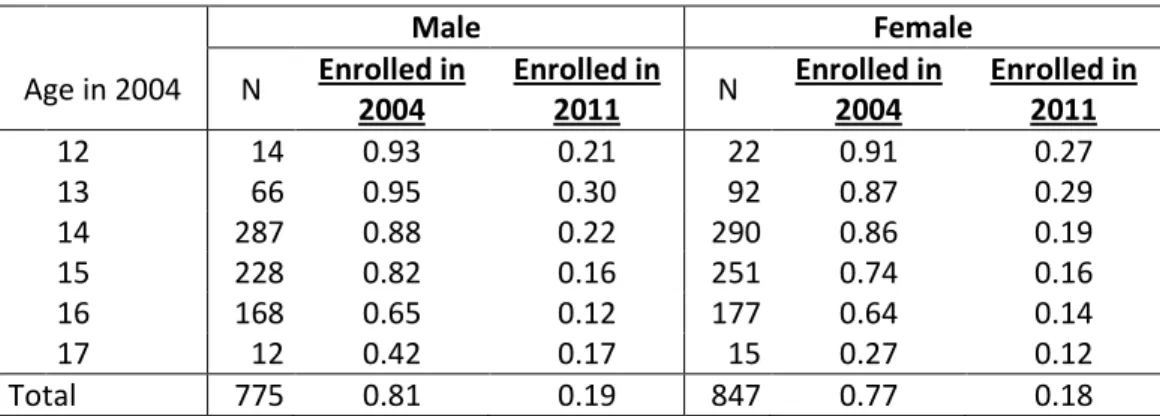
The transition from adolescence to adulthood is a crucial period for education.1 This is the time when cohort members decide (or their parents make the decision for them) to drop out school, and as a consequence, to end their education. Table 3.1 presents this transition: in 2004, in the previous survey, 79% of the cohort members in our sample were enrolled in school while only 19% were attending school in 2011. Enrolment rate decreases with age: in 2004, 90% of 13-year old cohort members were enrolled while only 65% of 16-year olds were in school; in 2011, 20% of the 20-year old cohort members were enrolled while only 14% of the 24-year old cohort members were. The enrolment rate is significantly higher among those living in richer households: in 2004, only 6% of the cohort members living in one of the 25% poorest households of the sample were enrolled in 2011 while nearly one-third of the cohort from highest quartile of assets index were in school. Parent’s education is also associated with a higher enrolment rate. Nearly one-half of the cohort members, with fathers who completed higher secondary school, was still enrolled in 2011. Table 3.2 shows enrollment rate by gender for each considered age. On average, girls were slightly less likely to be enrolled in 2004 but there were no significant difference in 2011.
Tables 3.3 and 3.4 present information concerning the last school attended and the highest grade attained in 2011. Thirty-five percent of male cohort members and 38% of female have not
1
The Malagasy school system consists of a primary cycle and a secondary cycle composed of two phases. The primary school starts at the age of 6. Some schools offer a pre-scholar education. The primary cycle, which lasts 5 years (CP1, CP2, CE, CM1, CM2), ends with an exam at the end of the last year and a CEPE (Primary Education Completion Certificate) is acquired after succeeding to that exam. The first phase of the secondary education (lower secondary school) lasts 4 years and ends with the BEPC (Basic Secondary Education Completion Certificate). The second phase of the secondary education (High School), to last for 3 years, ends with the High School Diploma.
20 been enrolled beyond primary school. Nearly 35% of the cohort have attended higher secondary school and above. Only 9% have continued schooling after secondary school.
Table 3.5 shows the average grade attained in 2004 and in 2011, as well as the average grade progression between the two surveys. In 2004, cohort members had reached an average of 5.19 years of schooling. In 2011, the average years of schooling attained were 7.74, and the average grade progression was 2.6 years. Interestingly, girls’ and boys’ performances show an opposite pattern in the two surveys. Girls performed significantly better in 2004, while boys had reached a higher grade by 2011. Grade progression is significantly higher for boys. Parents’ education and household wealth are associated with better grade attainment in 2004 and in 2011 and with greater grade progression. This result suggests that differences in school achievement observed in 2004 have increased in the intervening years between the surveys. It is worth noting that the gradient in grade attainment by parents’ education or household wealth is large: grade attainment is more than twice as high for households in the wealthiest quartile of the distribution that in the poorest quintile.Table 3.6
Reasons for dropping out school are presented in Tables 3.7, 3.8, and 3.9. The inability to pay for school is the main reason given by cohort members for dropping out, no matter what the last grade attained. This reason is given by 43% of the cohort. The second most frequently offered reason is related to housework (including assisting other households’ members) and is given by 20% of the cohort members. This reason is more prevalent in poorer households (32% for households in the poorest quartile) than in richer ones (14%). The third most often provided reason is the completion of an academic cycle (17%), suggesting that the diploma associated with the end of the cycle is a clear target for cohort members. Similarly, failing the entrance exam to the next cycle is given as a reason for dropping out by one-quarter of the cohort members who were last enrolled in higher secondary school. There is also only a small share of cohort members enrolled in college (9%). Finally, having a bad opinion of education is the reason given by 16% of cohort members. This reason is more prevalent amongst cohort members who have attended only primary school (22%), suggesting those with negative opinions regarding education left school early.
21
Tables
Table 3.1 Enrolment rate by age, asset index, and parent’s education
Enrolled in 2003 Enrolled in 2011 N Percent Percent Total 1681 0.79 0.19 Age in 2004 12 36 0.92 0.25 13 158 0.90 0.30 14 577 0.87 0.21 15 479 0.77 0.16 16 345 0.65 0.13 17 27 0.33 0.14
Quartile of asset index in 2004
1 350 0.64 0.06 2 398 0.75 0.11 3 457 0.80 0.18 4 473 0.91 0.34 Father’s education None 208 0.68 0.08 Some primary 586 0.73 0.11 Completed primary 232 0.76 0.12
Some lower secondary 171 0.83 0.20
Completed lower secondary 197 0.87 0.25
Some higher secondary 112 0.94 0.29
Completed higher secondary 114 0.95 0.50
Above secondary 53 0.94 0.45 Mother’s education None 274 0.71 0.07 Some primary 583 0.72 0.13 Completed primary 267 0.77 0.19
Some lower secondary 207 0.89 0.22
Completed lower secondary 169 0.88 0.25
Some higher secondary 80 0.95 0.34
Completed higher secondary 65 1.00 0.52
22
Table 3.2 Enrolment rate by gender and age in 2004
Male Female Age in 2004 N Enrolled in 2004 Enrolled in 2011 N Enrolled in 2004 Enrolled in 2011 12 14 0.93 0.21 22 0.91 0.27 13 66 0.95 0.30 92 0.87 0.29 14 287 0.88 0.22 290 0.86 0.19 15 228 0.82 0.16 251 0.74 0.16 16 168 0.65 0.12 177 0.64 0.14 17 12 0.42 0.17 15 0.27 0.12 Total 775 0.81 0.19 847 0.77 0.18
Table 3.3 Highest school attended by gender
Male Female N Percent N Percent Primary school 279 0.35 329 0.38 Lower secondary 221 0.28 260 0.30 Higher secondary 233 0.29 197 0.23 Above secondary 65 0.08 88 0.10 Total 798 1.00 874 1.00
Table 3.4 Highest grade attained by gender
Male Female N Percent N Percent No grade 15 0.02 18 0.02 CP1/T1 15 0.02 14 0.02 CP2/T2 24 0.03 35 0.04 CE/T3 63 0.08 72 0.08 CM1/T4 72 0.09 77 0.09 CM2/T5 105 0.13 131 0.15 6th 37 0.05 39 0.04 5th 32 0.04 50 0.06 4th 55 0.07 46 0.05 3rd 97 0.12 125 0.14 2nd 35 0.04 36 0.04 1st 53 0.07 41 0.05 Terminale 145 0.18 120 0.13 BAC+1 35 0.04 40 0.04 BAC+2 17 0.02 31 0.03 BAC+3 7 0.01 11 0.01 BAC+4 5 0.01 5 0.01 BAC+5 or more 1 0.00 1 0.00 Total 813 1.00 892 1.00
23
Table 3.5 Grade in 2004, grade in 2011 and grade progression
Grade in 2004 Grade in 2011 Grade progression
Number of years Number of years Number of years
Total 5.19 7.74 2.60 Male 5.07 7.89 2.85 Female 5.28 7.64 2.38 Rural 4.81 7.10 2.33 Urban 6.24 9.67 3.42
Quartile of asset index in 2003
1 3.33 4.74 1.49 2 4.65 6.76 2.14 3 5.56 8.21 2.68 4 6.65 10.44 3.77 Remoteness index 1 6.13 9.24 3.12 2 5.70 8.53 2.82 3 4.76 6.83 2.12 4 4.63 7.00 2.44 5 3.83 5.07 1.31 Father’s education None 3.63 5.31 1.77 Some primary 4.44 6.38 1.98 Completed primary 5.12 7.37 2.26
Some lower secondary 5.78 8.49 2.74
Completed lower secondary 6.18 9.64 3.50
Some higher secondary 6.49 10.00 3.52
Completed higher secondary 7.29 11.80 4.42
Above secondary 6.89 11.85 4.89 Mother’s education None 3.44 5.20 1.84 Some primary 4.75 6.80 2.09 Completed primary 5.24 7.65 2.44
Some lower secondary 6.03 9.15 3.14
Completed lower secondary 6.46 9.98 3.53
Some higher secondary 6.67 10.59 3.90
Completed higher secondary 7.32 12.14 4.78
24
Table 3.6 Grade attainment and grade progression by grade in 2004
Grade in 2003 Grade in 2011
Grade progression since 2004 Number of years Number of years
0 2.18 2.18 1 3.02 2.07 2 3.64 1.69 3 4.35 1.42 4 5.76 1.85 5 7.28 2.33 6 9.40 3.43 7 10.80 3.80 8 11.22 3.23 9 11.85 2.85 10 and more 13.50 2.78
Table 3.7 Reasons for dropping out school, by gender (percent)
Male Female Total
Illness / accident 0.04 0.05 0.05
Pregnancy 0.00 0.13 0.07
Cannot pay for school 0.47 0.40 0.43
Housework 0.11 0.08 0.09
Assist household’s members 0.10 0.11 0.11
Involved in family business 0.05 0.01 0.03
Academic cycle completed 0.20 0.15 0.17
Bad opinion on education 0.15 0.16 0.16
Sexual harassment 0.00 0.01 0.01
Family moved 0.00 0.01 0.01
Failed at the exam 0.08 0.05 0.06
No more places open at school 0.01 0.01 0.01
Next school too distant 0.02 0.02 0.02
25
Table 3.8 Reasons for dropping out school, by type of last school attended (percent)
Dropped out at
primary school lower secondary
higher secondary
Illness / accident 0.04 0.05 0.06
Pregnancy 0.04 0.10 0.08
Cannot pay for school 0.42 0.46 0.43
Housework 0.15 0.07 0.02
Assist household's members 0.12 0.13 0.06
Involved in family business 0.04 0.02 0.01
Academic cycle completed 0.17 0.19 0.15
Bad opinion on education 0.22 0.14 0.04
Sexual harassment 0.00 0.01 0.00
Family moved 0.01 0.01 0.01
Failed at the exam 0.00 0.01 0.26
No more places open at school 0.01 0.00 0.03
Next school too distant 0.01 0.01 0.05
Number of observations 512 318 261
Table 3.9 Reasons for dropping out school, by asset index quartile (percent)
Quartile of asset index
1 2 3 4
Illness / accident 0.02 0.03 0.05 0.09
Pregnancy 0.05 0.07 0.06 0.10
Cannot pay for school 0.41 0.43 0.50 0.37
Housework 0.17 0.12 0.03 0.06
Assist household's members 0.14 0.11 0.09 0.08
Involved in family business 0.04 0.04 0.02 0.02
Academic cycle completed 0.15 0.18 0.16 0.21
Bad opinion on education 0.24 0.18 0.12 0.08
Sexual harassment 0.00 0.00 0.01 0.01
Family moved 0.01 0.00 0.01 0.01
Failed at the exam 0.00 0.04 0.10 0.13
No more places open at school 0.00 0.00 0.02 0.01
Next school too distant 0.00 0.03 0.01 0.03
Number of observations 283 281 303 241
4. Test scores
Test scores provide an accurate evaluation of an individual knowledge. During the 2003/4 survey, cohort members were given tests in mathematics, French, and life skills. Math and French tests included oral and written parts. Tests were the same for every cohort member, no matter what the final grade they had attained. Scores are normalized from 0 to 1 (a score of 1 means that all answers were correct). Table 4.1 presents the correlation the various tests scores and grade
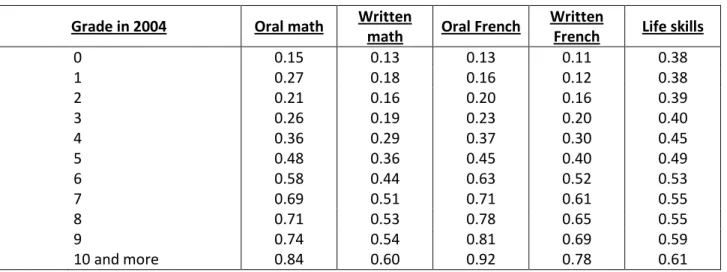
26 attainment. The five scores (oral and written math test scores, oral and written French test scores, and life skills test score) are strongly correlated with each other. Not surprisingly, they are also positively and highly correlated with grade, suggesting grade attainment is a major predictor not only for academic knowledge but also for life skills. Table 4.2 presents average score by grade in 2004. Not surprisingly, cohort members enrolled at higher grades in 2004 performed better in the 2011 tests.
Table 4.3 presents average scores by gender, parent’s education, and household characteristics. For the whole sample, male cohort members performed slightly better than females, but the difference is only significant for math tests and may only be the consequence of a better mean grade attainment for males. Parent’s education is strongly associated with better scores: for instance, cohort members whose fathers has no education performed 0.27 on the written French test, while cohort members whose fathers had completed higher secondary performed 0.70. Members from wealthier households and less remote areas also received better scores. These results are not surprising if we consider them in the context of the distribution of grade attainment by quartile of asset index and by remoteness index (see Education Section 3).
In 2004, in the previous survey, cohort members were also given oral and written tests in math, French, and life skills. Previous scores are only available for 824 to 980 cohort members, depending of the kind of test. Table 4.4 presents the correlation between 2004 tests scores and the 2011 test scores. Correlations are strong, positive, and highly significant. Cohort members who performed better in the previous survey also received better scores in 2011. This result is confirmed by Tables 4.5, 4.6, and 4.7, which present average scores for the 2011 test by quintile of the scores from the previous survey. Male cohort members from the lowest 2004 French score quintile scored 0.30, while those from the highest quintile scored 0.68. There is no significant difference by gender. However, there is a large difference in knowledge acquisition between cohort members from rural and urban areas . Although there is no difference in math scores for members of the lowest quintiles (0.29 and 0.30), cohort members from urban areas scored 0.60 on average, as compared to the average rural areas of only 0.50.
27
Tables
TABLE 4.1 Correlation between tests scores and final grade attained
2011 Test scores
Grade in
2011 Oral math
Written
math Oral French
Written
French Life skills
Grade in 2011 1.0 N 1705 Oral math 0.6882* 1.0 N 1550 1550 Written math 0.6934* 0.7810* 1.0 N 1557 1550 1557 Oral French 0.7142* 0.6815* 0.6971* 1.0 N 1534 1523 1530 1534 Written French 0.7573* 0.7357* 0.7882* 0.7948* 1.0 N 1532 1523 1529 1528 1532 Life skills 0.5442* 0.5686* 0.5795* 0.5066* 0.5483* 1.0 N 1635 1543 1550 1528 1526 1635
Table 4.2 Average scores for 2011 tests by grade level in 2004.
Grade in 2004 Oral math Written
math Oral French
Written
French Life skills
0 0.15 0.13 0.13 0.11 0.38 1 0.27 0.18 0.16 0.12 0.38 2 0.21 0.16 0.20 0.16 0.39 3 0.26 0.19 0.23 0.20 0.40 4 0.36 0.29 0.37 0.30 0.45 5 0.48 0.36 0.45 0.40 0.49 6 0.58 0.44 0.63 0.52 0.53 7 0.69 0.51 0.71 0.61 0.55 8 0.71 0.53 0.78 0.65 0.55 9 0.74 0.54 0.81 0.69 0.59 10 and more 0.84 0.60 0.92 0.78 0.61
28
Table 4.3 Average scores for the 2011 tests by gender, parent’s education and household characterictics
Oral math Written
math Oral French
Written
French Life skills
Total 0.51 0.38 0.52 0.44 0.49 Male 0.52 0.39 0.52 0.45 0.50 Female 0.49 0.37 0.52 0.43 0.49 Rural 0.47 0.35 0.47 0.39 0.47 Urban 0.62 0.45 0.67 0.57 0.54
Quartile of asset index
1 0.30 0.23 0.27 0.22 0.41 2 0.43 0.32 0.42 0.34 0.47 3 0.55 0.41 0.57 0.47 0.51 4 0.67 0.50 0.72 0.63 0.55 Remoteness index 1 0.60 0.44 0.64 0.54 0.54 2 0.58 0.42 0.55 0.49 0.52 3 0.38 0.31 0.43 0.35 0.44 4 0.47 0.35 0.47 0.39 0.46 5 0.28 0.22 0.23 0.19 0.42 Father’s education None 0.35 0.26 0.31 0.27 0.42 Some primary 0.42 0.31 0.40 0.34 0.46 Completed primary 0.48 0.37 0.50 0.42 0.49
Some lower secondary 0.53 0.41 0.57 0.50 0.51
Completed lower secondary 0.65 0.47 0.68 0.55 0.53
Some higher secondary 0.66 0.47 0.70 0.60 0.55
Completed higher secondary 0.71 0.55 0.82 0.72 0.57
Above secondary 0.73 0.54 0.81 0.70 0.59 Mother’s education None 0.33 0.24 0.29 0.26 0.43 Some primary 0.44 0.33 0.44 0.38 0.47 Completed primary 0.51 0.38 0.52 0.43 0.50
Some lower secondary 0.60 0.45 0.63 0.52 0.52
Completed lower secondary 0.66 0.48 0.72 0.59 0.55
Some higher secondary 0.65 0.49 0.71 0.59 0.55
Completed higher secondary 0.79 0.59 0.81 0.76 0.58
29
Table 4.4 Correlation between 2004 and 2011 tests scores
2004 test scores 2011 test scores
Math 2004 French 2004 Life skills 2004 Oral math Written math Oral French Written
French Life skills
Math 2004 1.0 N 824 French 2004 0.6624* 1.0 N 813 923 Life skills 2004 0.6266* 0.5267* 1.0 N 820 913 980 Oral math 0.4727* 0.3944* 0.3697* 1.0 N 767 849 889 1550 Written math 0.4718* 0.4007* 0.3783* 0.7810* 1.0 N 773 855 895 1550 1557 Oral French 0.4598* 0.4280* 0.3646* 0.6815* 0.6971* 1.0 N 762 843 882 1523 1530 1534 Written French 0.5171* 0.4867* 0.3953* 0.7357* 0.7882* 0.7948* 1.0 N 758 839 878 1523 1529 1528 1532 Life skills 0.4424* 0.3826* 0.3876* 0.5686* 0.5795* 0.5066* 0.5483* 1.0 N 794 889 939 1543 1550 1528 1526 1635
Table 4.5 Average 2011 math test score by quintile of the 2004 math test score
2011 math test score
2004 Math test score Male Female Rural Urban
Lowest quintile 0.31 0.28 0.29 0.30
Second quintile 0.39 0.33 0.36 0.35
Third Quintile 0.45 0.44 0.46 0.39
Fourth quintile 0.56 0.48 0.52 0.51
30
Table 4.6 Average 2011 French test score by quintile of the 2004 French test score
2011 French test score
2004 French test score Male Female Rural Urban
Lowest quintile 0.30 0.26 0.27 0.35
Second quintile 0.41 0.35 0.39 0.33
Third Quintile 0.48 0.49 0.50 0.44
Fourth quintile 0.60 0.57 0.56 0.63
Highest quintile 0.68 0.68 0.56 0.79
Table 4.7 Average 2011 life skills test score by quintile of the 2004 life skills test score
2011 life skills test score
2004 Life skills test score Male Female Rural Urban
Lowest quintile 0.44 0.40 0.41 0.48
Second quintile 0.51 0.47 0.49 0.53
Third Quintile 0.50 0.52 0.50 0.53
Fourth quintile 0.54 0.53 0.53 0.55
Highest quintile 0.56 0.55 0.54 0.56
5. Employment and Earnings
Employment statistics are reported in Table 5.1. Employment in the sample is high with 76% of the sample working, 14% attending school, and only 6% are neither working or in school. Unemployment is higher among females than among males, with gender-specific unemployment rates of 8.56% and 3.27%, respectively. Roughly 14% of both males and females are still in school, and 80% of males and 74.33% of females are working. As can be seen in Table 5.2, at 74%, females make up a larger share of the unemployed. However the sample of those employed and students are largely equal in shares of males and females. Fifty percent of those working are males; 47% of the students in the sample are male.
Table 5.3 reports the average grade attainment in each employment category, and Figure 5.1 shows the educational distribution of individuals in each category. As would be expected, grade attainment is highest for those who are still students, with an average grade attainment of 12.10 (12.71 for males and 11.76 for females). Most current students have completed secondary school (at 34.15%), and an even larger (39.02%) share is currently in university. Grade attainment is lowest for those currently employed, with an average grade attainment of 6.83 (7.02 for males and 6.68 for females). Although the largest share of workers (28.11%) has only completed some primary school, the distribution is wide with a significant portion of workers having completed at least some middle (college) and some secondary school. Average grade attainment for those individuals who are neither working nor students is fairly high at 9.31 (10.81 for males and 8.73 for females). Looking at the distribution of educational status among the unemployed, there appears to be some queuing for better jobs, with the largest share (30.84%) having completed secondary school.
31 Table 5.4 describes the breakdown across occupational categories among those individuals in the sample who are working. Half of all workers (44.48% of working males and 57.7% of working females) are employed in a family enterprise or are doing domestic work in another household not their own. Thirty percent of workers (31.91% of males and 33.75% of females) are self-employed, and 16.58% (21.77% of males and 11.79% of females) are working in the public or private sector. Looking at the breakdown of main occupations across industrial sectors in Table 5.5, we see that 71% of workers who are self-employed and 79% of those who are in a family enterprise or domestic work are working in the agricultural sector. Those who report working in the public or private sector are primarily working in a high skill occupation or a low skill/manual labor occupation.
Not surprisingly, those employed in the public and private sector have the highest grade attainment with an average grade attainment of 9.72, as reported in Table 5.6. Females in the private/public sector have a statistically significantly higher grade attainment of 10.48 than males whose average grade attainment is 9.32. However, females in family enterprises and domestic work have statically significantly less education than their male counterparts, with average grade attainments of 6.54 and 7.03, respectively. Grade attainment for the self-employed is the lowest with average grade attainment of 5.65 (5.58 for males and 5.69 for females). The educational distribution across occupational categories can be seen in Figure 5.2.
Table 5.7 and Figure 5.3 describe individual earnings by main occupational category. In the full sample, individuals working in the private or public sector have the highest earnings while those in family and domestic work have the lowest average earnings. However, when looking at gender-specific earnings, self-employed males actually have the highest earnings while females in the public or private sector have the highest average earnings.
Tables
Table 5.1 Distribution of employment status
All Males Females
N Percent N Percent N Percent
Unemployed 108 6.07 27 3.27 77 8.56
Working 1,354 76.07 661 80.12 669 74.33
Student 249 13.99 112 13.58 127 14.11
Missing 69 3.88 25 3.03 27 3
Table 5.2 Gender make-up of employment categories
Male Female Difference
Mean Mean
Unemployed 0.2596 0.7404 0.2331
Working 0.4970 0.5030 -0.0917
32
Table 5.3 Highest grade attained by employment status
All Males Females Difference
N Mean SD N Mean SD N Mean SD (Female-Male)
Unemployed 107.00 9.31 3.21 26.00 10.81 2.79 77.00 8.73 3.19 -2.08 Working 1327.00 6.83 3.52 653.00 7.02 3.61 654.00 6.68 3.44 -0.34 Student 247.00 12.10 5.71 110.00 12.71 7.63 127.00 11.76 3.38 -0.95
Total 1681.00 7.77 4.34 789.00 7.94 4.82 858.00 7.61 3.86 -0.31
Table 5.4 Main occupation of those currently working
All Males Females
N Percent N Percent N Percent
Public/Private Sector 214 16.58 138 21.77 75 11.79
Self-Employed 412 31.91 214 33.75 194 30.5
Family Enterprise/
Domestic Work 665 51.51 282 44.48 367 57.7
Table 5.5 Main occupation across industrial sectors
Public/ Private Sector Self-Employed Family Enterprise/ Domestic Total Agriculture/ Livestock 6 291 522 819
Manual Labor/ Low Skill 78 49 71 198
Service 33 68 63 164
High Skill 95 3 7 105
33
Table 5.6 Highest grade attained by main occupational category
All Males Females Difference
N Mean SD N Mean SD N Mean SD (Female-Male)
Public/Private Sector 209.00 9.72 3.07 136.00 9.32 3.05 73.00 10.48 2.99 1.16*** Self-Employed 406.00 5.65 3.15 211.00 5.58 3.32 191.00 5.69 2.98 0.11 Famliy Enterprise/
Domestic Work 650.00 6.74 3.38 279.00 7.03 3.52 358.00 6.54 3.26 -0.49 *
Table 5.7 Earnings by main occupational category (1,000 Ariary)
All Males Females Difference
N Mean Median SD N Mean Median SD N Mean Median SD
(Female-Male) Public/Private Sector 212 193.27 1040 445.65 138 207.69 1200 456.78 73 168.64 800 428.33 -39.05 Self-Employed 409 180.27 330 848.10 213 222.43 384 106.33 192 137.22 178 52.64 -85.22 Family Enterprise/ Domestic Work 659 82.55 0 459.69 282 120.22 0 639.35 362 52.64 0 250.08 -67.58 Total 1280 132.11 100 611.19 633 173.69 320 780.09 627 92.05 0 379.35 -81.64
34
Figures—Employment and Earnings
Fig. 5.1 Distribution of educational attainment by Employment status
Fig. 5.2 Distribution of educational attainment by occupational category 11.21 5.607 13.08 23.36 9.346 30.84 6.542 0 1 0 2 0 3 0 P e rc e n t No Scho ol Prim ary Som e Prim ary Com plet e Col lege Som e Col lge Com plet e Sec onda ry S om e Sec onda ry C ompl ete Uni vers ity Level of Education
Distribution of Education Status if Currently Unemployed
1.733 28.11 16.5 17.41 12.66 8.214 12.28 3.09 0 1 0 2 0 3 0 P e rc e n t No School Prim ary Som e Prim ary Com plet e Col lege Som e Col lge Com plet e Sec ond ary Som e Sec onda ry C ompl ete Uni vers ity Level of Education
Distribution of Education Status if Currently Working
4.878 .4065 2.846 8.13 10.57 34.15 39.02 0 1 0 2 0 3 0 4 0 P e rc e n t No Sch ool Prim ary Som e Prim ary Com plet e Col lege Som e Col lge Com plet e Sec ond ary Som e Sec onda ry C ompl ete Uni vers ity Level of Education
Distribution of Education Status if Currently A Student
5.742 5.263 17.22 14.83 22.49 25.84 8.612 0 5 1 0 1 5 2 0 2 5 P e rc e n t No Sch ool Prim ary Som e Prim ary Com plet e Col lege Som e Col lge Com plet e Seco ndar y So me Sec onda ry C ompl ete Uni vers ity Level of Education
Public/Private Sector Workers
2.956 37.44 18.72 17.98 11.33 4.926 5.665 .9852 0 1 0 2 0 3 0 4 0 P e rc e n t No Sch ool Prima ry S ome Prima ry C omp lete Col lege Some Col lge Comp lete Sec onda ry S ome Sec onda ry C omp lete Uni vers ity Level of Education Self-Employed 1.692 27.54 19.08 17.38 13.54 5.692 12.46 2.615 0 1 0 2 0 3 0 P e rc e n t No Sch ool Prim ary Som e Prim ary Com plet e Col lege Som e Col lge Com plet e Sec onda ry S om e Sec onda ry C ompl ete Uni vers ity Level of Education
35
Fig.5.3 Earnings by main occupational category 193265 180266 82552.4 0 5 0 ,0 0 0 1 0 0 0 0 0 1 5 0 0 0 0 2 0 0 0 0 0 M e a n I n co m e
Public/Private Self-Employed Family/Domestic
Mean Income by Occupational Category
207693 222434 120224 0 5 0 ,0 0 0 1 0 0 0 0 0 1 5 0 0 0 0 2 0 0 0 0 0 2 5 0 0 0 0 M e a n I n c o m e
Public/Private Self-Employed Family/Domestic Males
Mean Income by Occupational Category
168639 137218 52640 0 5 0 ,0 0 0 1 0 0 0 0 0 1 5 0 0 0 0 2 0 0 0 0 0 M e a n I n c o m e
Public/Private Self-Employed Family/Domestic Females