HAL Id: hal-00017227
https://hal.archives-ouvertes.fr/hal-00017227
Preprint submitted on 18 Jan 2006
HAL is a multi-disciplinary open access
archive for the deposit and dissemination of
sci-entific research documents, whether they are
pub-lished or not. The documents may come from
teaching and research institutions in France or
abroad, or from public or private research centers.
L’archive ouverte pluridisciplinaire HAL, est
destinée au dépôt et à la diffusion de documents
scientifiques de niveau recherche, publiés ou non,
émanant des établissements d’enseignement et de
recherche français ou étrangers, des laboratoires
publics ou privés.
Analysis of the circumstellar environment of the B[e]
star HD 45677 (FS CMa)
Gérard Muratorio, Corinne Rossi, Michael Friedjung
To cite this version:
Gérard Muratorio, Corinne Rossi, Michael Friedjung. Analysis of the circumstellar environment of
the B[e] star HD 45677 (FS CMa). 2006. �hal-00017227�
ccsd-00017227, version 1 - 18 Jan 2006
(DOI: will be inserted by hand later)
Analysis of the circumstellar environment of the B[e] star
HD 45677 (FS CMa)
⋆
G. Muratorio
1, C. Rossi
2, M. Friedjung
31 Laboratoire d’Astrophysique de Marseille, 2 Place le Verrier, FR-13248 Marseille Cedex 04, France e-mail: gerard.muratorio@oamp.fr
2 Dipartimento di Fisica , Universit`a “La Sapienza”, Piazzzale A. Moro 2 00185, Roma, Italy e-mail: corinne.rossi@roma1.infn.it
3 Institut d’Astrophysique, 98 bis Boulevard Arago, FR-75014 Paris, France e-mail: fried@iap.fr
the date of receipt and acceptance should be inserted later
AbstractWe studied the circumstellar environment of the B[e] star HD 45677 through the analysis of the emission lines from ionized metals. We used the statistical approach of the self absorption curve method (SAC) to derive physical parameters of the line emitting region. The Fe II and Cr II double-peaked emission line structure is explained by the presence of a thin absorption component red shifted by ∼ 3 km s−1. This absorption component can be interpreted geometricaly as being due to infalling
material perpendicularly to the disk seen nearly pole-on, as indicated by the emission line structure. The Cr II and Fe II emission lines have a complex structure with two (narrow and broad) components, of 45 and 180 km s−1FWHM for the permitted lines
and 25 and 100 km s−1FWHM for the forbidden ones, respectively. From our best data set of 1999, we obtained a
Boltzmann-type population law whose excitation temperature is 3 900+900
−600K and 3 150 +350
−300K for the narrow component lower and upper
levels respectively. We obtained an excitation temperature of 3 400+350
−300K for the broad component upper levels. The forbidden
lines are found to be formed in the outer regions with higher excitation temperatures of 10 500 ± 1 000K and 8 000 ± 1 500K for the narrow and broad components respectively in 1999. Our results are consistent with line formation in a rotating disk, around a young star. In the framework of a very simplified geometrical model, we argue that the narrow components are principaly emitted by an optically thin disk seen nearly pole-on, in a region whose minimum radius is estimated to be 4 1012cm, while the broad ones are formed in a disk-linked wind.
Keywords. Line: formation – Methods: data analysis: Self Absorption Curve – Stars: emission-line, Be – Stars: individ-ual: HD 45677 (FS CMa)
1. Introduction
HD 45677 (FS CMa) is generally recognized as an early type star, usually classified as B[e], or more precisely as showing the B[e] phenomenon, even if it is difficult to determine its exact evolutionary stage (de Winter et al. 1997; Lamers et al.1998).
The presence of a disk, and even more of a bipolar envi-ronment, was inferred by polarization measurements (Coyne & Vrba 1976; Schulte-Ladbeck et al. 1992) and by UV spec-troscopic measurements of accreting gas (Grady et al. 1993).
Send offprint requests to: G. Muratorio e-mail:
gerard.muratorio@oamp.fr
⋆ Based on observations obtained at the Haute Provence
Observatory. Table.12 is available in electronic at the CDS via http://vizier.u-strasbg.fr (130.79.128.13) or via http://cdsweb.u-strasbg.fr/cats/Cats.htx (130.79.128.40)
These last authors agreed on the presence, around the star, of an actively accreting circumstellar, protoplanetary disk, and the presence of low-velocity absorption profiles in FeIIlines, among other species, while optical spectroscopic measure-ments of strong absorption cores of a few lines are commented on by de Winter et al. (1997).
In the optical HD 45677 is characterised by a rich emis-sion line spectrum, including the Balmer lines of hydrogen, and both permitted and forbidden lines of neutral and ionized met-als (MgI, MgII, NaI, CrII, SiII, MnII, TiII, [NiII], [SII]and especially FeIIand [FeII]).
Israelian et al. (1996) found a surface gravity of log g = 3.85 ± 0.05 (luminosity class V) from the photospheric wings of Hγ and Hδ, while examination of the HeIabsorption lines suggested a spectral class of B2 (Teff=22 000 ± 1 500 K). The effective temperature was less certain than the surface gravity, due to a circumstellar contribution to the He Ilines. Israelian et al. (1996) also found that the photospheric Si II4128 and 4130 Å lines were not blended, and could be only fitted by
models with a projected rotational velocity v sin i of less than 70 km s−1.
Cidale et al. (2001) used the method of Barbier, Chalonge & Divan, based on the magnitude and position of the Balmer photospheric (not circumstellar) discontinuity. They obtained a spectral type of B2IV-V, corresponding to
Teff =21 500 ± 300 K and log g = 3.89, in agreement with the
previous determinations.
De Winter & van den Ancker (1997) studied the behaviour of HD 45677 during the last 25 years, and concluded that the large photometric variations of the star are best explained by a variable obscuration from circumstellar grains. They also de-rived a stellar instrinsic visual–ultraviolet energy distribution close to that of a B2 V star, with an infrared excess due to the dust emission. The recent spectral variations were discussed by Israelian et al. (1996) and Israelian & Musaev (1997).
In the present study, we analyse the emission line spectrum in order to get an insight into the physical processes of line ex-citation and geometrical conditions of their forming regions. It is clearly impossible at the present stage to calculate a detailed synthetic spectrum for this badly known object, so in order to analyse the spectrum, we use the statistical approach offered by the Self-Absorption Curve method (Friedjung & Muratorio 1987; Muratorio & Friedjung 1988; Baratta et al. 1998; Kotnik-Karuza et al. 2002).
2. Observations and Reductions
The spectra of HD 45677 were obtained in various contiguous domains in the course of different observing runs at the Haute Provence Observatory (OHP) by means of the Aurelie spectro-graph attached to the Coud´e focus of the 1.52 m telescope.
Until 1999 Aurelie used as receiver a Thomson TH 7832 photocell “Double Barette”, and since 2000 a new CCD/EEV which improved the instrument performances (see http://.www.obs-hp.fr/www/guide/aurelie/annonce.html).
We obtained many spectra in selected regions; A higher res-olution was used in 1999 and 2001-2002 in order to charac-terise better the profile of the metallic spectral lines. A detailed log of the observations is given in Table.11 (online material).
The 1995 observations were used in 1996 for the analysis of the HeIlines 4387, 4471, 5876 and 4438 Å (Israelian et al. 1996).
The spectra were reduced at the Marseille Observatory us-ing procedures runus-ing in the MIDAS environment.
After the files were calibrated in wavelength, and reduced to the heliocentric standard of rest, we identified the spec-tral features present in all our spectra. No large variations are present in the metallic emission lines within our observing time target (see Fig. 1). Higher resolution spectra of HD 45677 were obtained from October 14, 19 and 20 in 1995 by Musaev with the Coud´e Echelle Spectrometer at the 1-m telescope of the Special Astrophysical Observatory of the Russian Academy of Sciences (Israelian & Musaev 1997), and kindly provided for us by Garik Israelian.
For the purpose of our analysis of the emission lines we need the absolute values of the fluxes. To do this, we have nor-malized the individual spectra to the local continuum level and,
following de Winter et al. (1997), we multiplied the line fluxes by the energy distribution of the Kurucz (1979, 1993) model of
Teff = 22 500K and log g = 4.0 with solar abundance,
normal-ized to the visual magnitude of the star, V0=6.6. The results are not dependent on the model choosen in the limit of the pre-cision of the determination of the star’s type by various authors (see Introduction). We adopted the same continuum distribu-tion for the three studied epochs.
2.1. Line identification
Extensive line identification lists of HD 45677 are available from the literature (Swings 1973; Andrillat et al. 1997; de Winter et al. 1997). However, they generally refer either to lower resolution spectra and/or to limited spectral ranges. We therefore prepared a new line list, based on our observations, which is presented in Table.12 (online material). Emission and absorption components identified in different species are sum-marized in Table.13 (online material).
2.2. Line components
Figure 1 shows that the lines of the most numerous species, namely CrII, FeIIand [FeII], did not significantly vary dur-ing 1995-2002. This will be best illustrated at the end of this section.
As shown in Figure 1, and, more in detail, in Figures 2, 3, 4 and 17 (online material), in the higher resolution spectra of HD 45677, the strongest permitted lines present a double peaked emission. This feature has been in previous papers ascribed to emission from a rotating equatorial disk (de Winter et al. 1997). But they can be as well attributed to absorption in the emitting medium or in a circumstellar shell according to Grady et al. (1993) from their ultraviolet observations.
Israelian and Musaev (1997) discussed the narrow absorp-tion components observed in Mg II λ4481 Å and in the hy-drogen lines in the framework of both infalling material with a patchy structure, and outfall-wind. They also noticed the strong variations of the Mg IIline from pure absorption to P Cygni profile on timescales of a few days.
Actually, in the higher resolution spectra the central dips of the strong MgIIλ4481 Å and CrIIλ4558.6 Å and λ 4588.2 Å go well below the continuum level (Figs. 1 and 2).
In our lower resolution 1995 spectra (top), the absorption is probably smoothed out, but is nevertheless present, as con-firmed by the fitting procedure discussed below. The other emission lines are either sligthly flat–topped or present a dip at the red side of their maximum, again suggesting the presence of an unresolved central (or slightly red–shifted) absorption.
Indeed, the line shape is that typical of an emission line with a central absorption, rather than that of a rotating disk seen close to edge-on and we shall see in Section 4 that these profiles can be interpreted as originating in a nearly face-on seen disk.
At the same time, the strongest emission lines clearly present extended wings, that, however, are difficult to detect in many cases because of line blending.
Figure 1: The spectrum of HD 45677 during 1995-2001. The spectrograms, normalized to the continuum and vertically shifted, are, from top to bottom, of 14/01/1995 (R=7000), 19/10/1995 (R=36000), 2/2/1999 (R=15000) and 5/12/2001 (R=15000). All the spectra were obtained at OHP with AURELIE, except the October 1995 one which is from the Russian Special Astrophysical Observatory. On the higher resolution spectrograms the deep CrIIabsorptions at 4558 and 4588 Å show up clearly.
In Fig. 2 we show in more detail the two most intense lines of CrIImultiplet 44. The line profiles are well reproduced with a multiple Gaussian fit, with two components in emission with a FWHM of 45 and 180 km s−1FWHM respectively, having the
same central wavelength, and one absorption with a FWHM of 25-30 km s−1, slightly displaced to the red. (See the infalling
material model discussed by Israelian and Musaev.)
Strong absorption components have also been observed in the NaID doublet since a long time, and were discussed by de Winter et al. (1997). In our spectra the NaI D doublet shown in Fig. 17 underwent dramatic variation in both intensity and position of the emission components, as well as in the intensity of the central absorption (its position is stable within the fitting precision). This behaviour is not unexpected because Israelian et al. (1996) report variability for these lines within 2-3 days. Due to the intense absorption, the narrow emission component, if present, cannot be found by the fitting procedure. The ve-locity and fluxes of absorption and broad emission components are given for the three epochs in Table. 1.
Table 1: Flux (in 10-13erg cm2s−1) and velocity (in km s−1)
variations of the Na I D1 and D2 components.
1995 flux 1995 vel 1999 flux 1999 vel 2002 flux 2002 vel Na I D1 a -0.88 31 -1.85 24 -2.60 24 Na I D1 e 2.77 48 4.84 4 2.86 9 Na I D2 a -1.26 31 -2.05 22 -2.55 22 Na I D2 e 3.34 48 5.24 5 2.88 6
As for the FeIIlines, a central absorption is clearly present in the line profiles at λ 4508.288 Å in Fig. 1 and Fig. 3 and
at λ 4520.224 Å, 4549.474 Å and 4583.837 Å in Fig. 1. The absorptions, like the CrIIones, are red shifted an average of 3 km s−1with respect to the central wavelength of the emission;
the shift is the same for all the observing runs (Table. 2). The same set of components than for CrIIlines with similar parameters is present in the FeIIlines (FWHM of 45 and 180 km s−1), while the [FeII] display narrow and broad emissions
with smaller FWHM of 25 and 100 km s−1, respectively (see
Fig. 3 for highly blended lines and Fig. 4 for more separated ones).
As the FWHM of the FeIIabsorption components FWHM are similar to the Cr IIones (≃30 km s−1), these components probably originate from the same region.
We postulate that in HD45677 the double-peaked FeIIline structure reported in the literature is in fact due to the same type of absorption and originates from material in the star’s line of sight. Their redward displacement can be interpreted as due to the infall of the absorbing material. This result is in agreement with the observations and the conclusions of Grady et al. (1993) and Israelian and Musaev (1997).
The two emission components clearly originate from re-gions of different dynamical behaviour, a possible model of the environment of FS CMa will be given in Sec. 4.
Based on the above results, we have fitted all, strong and weak, metallic permitted lines identified in our spectra with three Gaussian line components, central absorption narrow emission and broad emission. The forbidden lines were fitted with two emission components. The same central wavelength was assumed for the two emission components. The derived line fluxes, FWHMs and central radial velocities are given in Table.12 (online material). For the line fluxes we estimated
Figure 2: The two most intense lines of multiplet 44 of CrII observed the 5/12/2001, showing the central absorption well below the continuum and the three Gaussian components’ fit . Each line profile (solid line) is fitted (dotted line) by three Gaussian components (dashed line). The residual (long dashed line) appears around the continuum (straight line). Notice the rising of the residual towards shorter wavelengths which is in both cases due to the presence of a strong FeIIline.
from the fitting procedure an error from 15% for the strongest lines to 50% for the weakest lines.
Table 2: Mean radial velocities (in km s−1) of the most
numer-ous species, absorption and emission of CrII,FeII, and [FeII] emission. The number of lines is given in parentheses.
1995 1999 2001 CrIIa 25.4 ± 1.3(10) 25.4 ± 1.4(11) 21.8±0.8(4) CrIIe 23.6 ± 1.3(11) 23.1 ± 1.2(11) 18.6 ± 2.0(4) FeIIa 29.4 ± 0.7(58) 28.2 ± 0.6(59) 24.2 ± 0.6(35) FeIIe 25.8 ± 0.5(69) 24.5 ± 0.4(64) 21.6 ± 0.5(47) [FeII] 21.5 ± 0.5(85) 22.5 ± 0.4(77) 21.4 ± 0.3(32)
The mean heliocentric radial velocity of the narrow emis-sion and central absorption components of CrII, FeIIand [FeII] in the three epochs are given in Table 2.
We compared the fluxes of the narrow emission compo-nents of FeIIand [FeII] lines in 1995 and in 2001-2002 with those of 1999.
Between 1995 and 2001-2002 the fluxes of the permitted lines are the same within the measurements errors, except for the weaker lines which are fainter in 1995. In December
2001-Figure 3: Profiles and various components of the blend 4508.288 Å (FeIImultiplet 38), 4509.610 Å ([FeII] multiplet 6F) on the 2/2/1999 (see Fig. 2 for the explanation of the differ-ent curves). The differdiffer-ent compondiffer-ent FWHM are given in the text.
Figure 4: Profiles and various components of 5273.38 Å ([FeII] multiplet 18F), 5276.002 Å (FeIImultiplet 49), and 5278.374 Å ([FeII] multiplet 35F) on the 3/2/1999 (see Fig. 2 for the expla-nation of the different curves).The different component FWHM are given in the text.
January 2002 the forbidden lines have weakened by somewhat less than 30% with respect to 1995 and 1999. As for the broad components, their larger measurement errors only allow to put an upper limit of 30% to their variation during our observing period.
In the following we shall analyse the broad and narrow emission components of these species, with special regard to the February 1999 data which cover a wider spectral range.
3. Analysis of the emission line fluxes
The spectrum of HD 45677 is rich in emission lines (see on-line material table 13), whose strength can be used to derive information about the physical parameters and geometry of the circumstellar region. Here we analyse the intensity of the per-mitted and forbidden ionized iron emission lines and perper-mitted ionized chromium emission lines in a statistical way, the Self– Absorption–Curve Method (SAC), following the procedure de-scribed by Friedjung & Muratorio (1987), and used among oth-ers by Muratorio et al. (1992), Viotti & al. (1999), Viotti et al. (2000), Kotnik-Karuza et al. (2002) and van den Ancker et al. (2004). Details on the SAC method are given in the SAC Manual (Baratta et al. 1998, available at www.rm.iasf.cnr.it
/ftp/uvspace/).
The Self absorption Curve Method has been discussed by Kastner (1999), in the framework of the escape probability for-malism of radiative transfer. He found, with such a forfor-malism, that for a static source having negligible differential velocities, the method is valid up to optical thicknesses of about 10. The self absorption curve we use is very similar to that found from Kastner’s approach. As we shall see, the use of a static model can be justified for one of the emission line components, while most of the FeIIemission lines examined, do not have an opti-cal thickness larger than 10.
The method makes a certain number of assumptions, as fol-lows :
(a) The populations of different levels belonging to the same spectroscopic term are approximately proportional to their statistical weights.
(b) The self absorption of lines of different multiplets is always the same function of the optical thickness. In the opti-cal region studied by us, our analysis is mainly based on lines whose lower levels are both even and metastable, while the up-per levels are odd. The processes of excitation are supposed to be similar. If such a situation exists, we may expect that effects of inhomogeneities in the emitting region, affect the different lines in almost the same way.
(c) Selective excitation mechanisms, and particularly pumping of populations of upper levels of emision lines be-cause of wavelength coincidences with other strong emission lines, are fairly infrequent and can be neglected for most lines. Such an assumption would be quite dangerous in the ultraviolet wavength range (Eriksson et al. 2004).
Other assumptions can often be made, as in this paper, when applying the method:
(d) The populations of different collisionally excited even lower terms of Fe+follow roughly Boltzmann’s law. In fact one can expect LTE at least for those having a lower excitation po-tential. The only relevant calculations of Verner et al. (2002) for emission by the B+D Weigelt blobs of η Car, with an es-timated electron density of the order of only 106cm−3, suggest
that Boltzmann’s law is obeyed up to 2.3 ev, with deviations as a function of excitation potential for higher metastable levels. Our lines are formed in a circumstellar region, with a presum-ably much higher electron density and larger collisional excita-tions and de-excitation rates of the metastable levels, as indeed is consistent with the determined column densities and limits
on the size of the line emitting region, given below (see Section 5.2, for what may happen, if this assumption is relaxed.).
(e) The populations of the upper odd levels are not in LTE, but we suppose that they tend to cluster around a Boltzmann law like distribution. Our analysis of HD 45677 is consistent with such an assumption for levels, which are not highly ex-cited (see below), irrespective of what the dominant excitation mechanism may be. Let us note that the Verner et al (2002)
η Car analysis, indicates departure coefficients, which tend to be mostly a function of the excitation potential.
3.1. FeIIpermitted emission lines
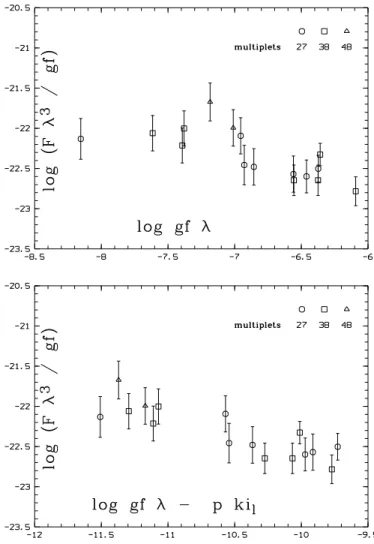
Figure 5: Upper panel : Log normalized fluxes versus log g f λ plots for the narrow components of FeIImultiplets 27 (circle), 38 (square),48 (triangle) with common upper term z4D0in the 1999 spectrum of HD 45677. Lower panel : log normalized fluxes versus log gfλ − pχl plots of multiplets 27, 38 and 48. The multiplets are horizontally shifted according to the popu-lation ratio of their lower terms by p = 1.3.
We first consider the narrow emission components of FeII. For the analysis we adopt Kurucz’ (1993) oscillator strengths. In order to look for self–absorption effects, we have analysed
the narrow component line fluxes of individual FeIImultiplets in the [log gfλ, log Fλ3
gf ] diagram, where the quantity Fλ3
gf is the normalized flux of an individual emission line, and gfλ is pro-portional, for a given multiplet, to the optical thickness at the line centre (see Viotti et al. (2000)). This procedure requires of course the first of the above assumptions (a).
In the upper panel of Fig. 5 we show the diagram for mul-tiplets 27, 38 and 48 that have z4D0 as common upper term. In the diagram, if the lines were optically thin, the normalized emission line flux should be constant within a multiplet. We note on the contrary that the strongest lines of multiplets 27 and 38 have a normalized flux lower than that of the weaker multiplet lines. This indicates that they are affected by a certain amount of self–absorption. It should also be noticed that we have not found for any multiplet any systematic trend, within the measurement errors of the line fluxes, with respect to the quantum number J, which would suggest a contradiction with assumption (a), about level populations within the upper and lower terms of each multiplet. Anyhow, a thourough study of this effect will be difficult for such complex line profiles, even with much higher quality material.
The bend of these diagrams helps to determine the relative population of the lower terms of the multiplets, by their hori-zontal shifts with respect to each other by an amount equal to the logarithm of this population ratio (e.g. Kotnik-Karuza et al. 2002). This has been performed in the [log gfλ − pχl,log Fλ
3
gf] diagram (lower part of Fig. 5) where the multiplets have been overlapped assuming a power law with exponent -p. A value of p =1.3 ± 0.4 eV−1) is derived for the exponent of the power law
of the lower terms population of the multiplets 27, 38 and 48. Similarly, by comparing the 1999 diagrams for multiplets 28, 37 and 49, having z4F0 as common upper term, we derive a mean lower level population gradient of p = 1.0 ± 0.4 eV−1.
In general these results are fairly uncertain because of the small energy range of the lower terms, and the same is the case of multiplets with common lower term, which cannot be prop-erly used to derive the mean excitation of the upper terms be-cause of the small energy range of our data. In order to over-come this problem, we have assumed that all the multiplets fit a common theoretical self–absorption curve Q (τ), and have used the least squares method to determine the parameters p, Xc, q, Yc, needed to overlap the lines of all multiplets to the theoret-ical curve in an [X − Xc,Y − Yc] diagram, where they corre-spond to the following physical definitions :
X = log gfλ − p(χl− χc) (1) Y = logFλ 3 gf + q(χu− χc) (2) Xc= 1.576 − log Nc gc + log vc (3) Yc= log S′ d2 + log Nc gc + w − log 2πe2h me (4)
and log2πem2h
e = 16.977 in cgs units.
The quantities χland χuare the excitation potentials (in eV)
of the lower and upper levels of each transition, χc is a
char-acteristic excitation potential taken different from 0 eV in the case of FeIIpermitted lines (and equal to 2.75 eV) in order to avoid problemsof thepopulations of the higher metastable lev-els, whose possible large departures from LTE are pointed out by Verner et al. (2002). The unknown parameters p and q de-scribe the mean population distributions of the lower and upper terms, respectively (Muratorio et al. 1992). In this procedure we assume the first of the above assumtions (a),as verified in each multiplet [log gfλ, log Fλ3
gf ] diagram, and thatall the lower
and upper levelsfollow a Boltzmann–type law with excitation
temperatures Tland Tuof 5040/p and 5040/q, respectively. The zero points Xc and Yc, are related to the Fe+ column
density Nc
gc at the arbitrary choosen level χc, taken to be equal
to 2.75 eV for Fe IIpermitted lines, and to the projected ex-tension of the emitting volume S′ (S′= S cos i), through the
equations 3 and 4 (Friedjung & Muratorio 1987; Baratta et al. 1998). The column density Nc
gc also depends on the parameter
vc(eq. (3), which is the velocity broadening of the opacity
pro-file (see Section 5.2). For the theoretical SAC function Q (τ) we adopted the analytical expression for a Gaussian line pro-file and an homogeneous emitting envelope given by Friedjung & Muratorio (1987).
All the quantities are in cgs units. The term w in eq. 4 describes the overall deviation of the population of the upper (odd) levels of the FeIItransitions with respect to the popula-tion of the lower (even) ones. If we assume that the odd and even level population laws link up at an intermediate χ , the term turns out to be equal to w = (χ − χc) (q − p), where for
the case of Fe IIone can take χ = 4.72 eV. Since we expect the odd terms to be largely underpopulated with respect to the even ones (see e.g. Fig. 13 in Verner et al. (2002)), this value of w should be taken as an upper limit, which corresponds to a lower limit to S’.
Table 3: SAC fit parameters for the permitted Fe II narrow component lines. p (eV−1), Xc, q (eV−1) and Yc are fitting
parameters,χ2is a measure of the fitting precision.
year 1995 1999 2001 p 1.32 ± 0.33 1.28 ± 0.23 0.94 ± 0.31 Xc −7.27 ± 0.09 −7.52 ± 0.08 −7.37 ± 0.11 q 1.79 ± 0.19 1.60 ± 0.16 1.28 ± 0.17 Yc −17.00 ± 0.54 −17.40 ± 0.47 −18.37 ± 0.47 N lines 50 50 28 red.χ2 0.65 0.45 0.34
Fig. 6 shows the result of the least squares fit of the dered-dened fluxes (with error bars) of 49 narrow components of the FeIIlines measured in the 1999 spectrum of HD 45677. The high excitation (χu>7.5 eV) FeIIlines have not been included in the fit, and will be discussed separately in Section 3.2.
As expected, in Fig. 6 multiplet 74 emission lines lie on the optically thin branch of the SAC, while the very strong lines of multiplet 42 lines are the most optically thick ones (central line
Figure 6: Global SAC of the narrow emission components in the 1999 spectrum of HD 45677. Results from the least squares overlapping of multiplets 27, 28, 32, 37, 38, 41, 42, 48, 49 and 74. The representative points are shifted horizontally and verti-cally according to a least squares fitting procedure by log level population corresponding to excitation temperatures of 3900 K and 3150 K for the lower and upper terms respectively.
opacity of about 70). Note that many multiplets lie around the bend of the SAC (log τ ≃ 0).
The fit gives a mean lower level population p correspond-ing to an excitation temperature Tlof 3900+900−600K, in fairly good
agreement with the values previously found by considering two groups of multiplets having common upper terms. The result-ing mean upper level population parameter q corresponds to a mean excitation temperature Tu of 3150+350−300K, much smaller
than that of the lower levels. Let us note that the modelling of Verner et al. (2002) for two of the Weigelt blobs of η Car pre-dicted electron temperatures going down to 5000 K.
We have applied this analysis also to the narrow FeII emis-sion components in the 1995 and 2001–2002 spectra of HD 45677. The derived best fit parameters for the three epochs are summarized in Table. 3. One may note in the table that the derived Ycparameters are very different from one epoch to an-other. This cannot be totally ascribed to a variation of the size of the FeIIemitting region, to which the Yc parameter is re-lated, since, as noted in Sec. 2.2, the spectrum did not largely vary during 1995-2002. Actually, the fitting value of Ycis cor-related with the q parameter, so that a small error on q results in a large change in Yc. In view of this point, as also discussed above, in this paper we shall mostly concern ourselves with the 1999 spectrum of HD 45677, and leave the problem of the spectral variation to a forthcoming paper.
The same procedure has been applied to the Fe II broad emission components components. Fig. 7 shows the global SAC of the FeIIbroad emissions in the 1999 spectrum of HD 45677 obtained from the least squares overlapping of ten FeII multiplets. The fluxes of the broad components are less pre-cisely determined than the narrow component ones, and the scatter of their SAC curves is higher, respectively.
Table 4: SAC fit parameters for the permitted FeIIbroad com-ponent lines. See Table. 3 and text for definitions.* parameter taken equal to the narrow components one as no convergence is obtained. year 1995 1999 2001 p 1.32∗ 1.28∗ 0.94∗ Xc −6.97 ± 0.14 −7.03 ± 0.11 −7.29 ± 0.18 q 0.99 ± 0.29 1.50 ± 0.26 1.53 ± 0.26 Yc −19.35 ± 0.82 −17.84 ± 0.75 −17.84 ± 0.74 N lines 49 49 28 red.χ2 0.45 0.41 0.33
Figure 7: SAC of broad components of multiplets 27, 28, 32, 37, 38, 41, 42, 48, 49 and 74 of FeIIin 1999. The representative points are shifted horizontally and vertically by log level popu-lation corresponding to excitation temperatures of respectively 3900 K and 3400 K
The fitting parameters of the FeIIbroad emission compo-nents are given in Table 4.
The SAC analysis of the broad components in 1995 and 2001-2002 is more uncertain, due to the lower spectral resolu-tion in 1995, which results in a less precise determinaresolu-tion of the broad component fluxes, and to the smaller set of data in 2001– 2002.Despite the lack of convergence for the p value in 1999,
the parameters, summarized in Table. 4, appear fairly similar to the ones derived from the narrow emission components except for the 1995 data, despite the too small q value derived.
3.2. High excitation FeIIpermitted lines
In the spectrum of HD 45677 we have identified many emission lines arising from high energy levels (χu ≥ 7.5 eV), that have
not been included in the previous SAC analysis. Fig. 8 shows the position of the narrow components of these lines with re-spect to the SAC derived from the narrow components of the lower excitation FeIIlines. Indeed, plotting these lines in the same graph may present a difficulty, since we cannot adopt for these lines the same excitation temperature of the lower
excita-Table 5: For each high excitation line we give : (1) the labo-ratory wavelength, (2) upper and lower term of the transition, (3) upper and lower term excitation potential, (4) logarithm of oscillator strength, (5) log ratio of observed flux to calculated flux according to the lower excitation lines parameters.
Wavelength upper Term lower Term χup χlow log g f log Fobs Fcalc 6158.019 (3G)4p x4F (3F)4s c4F 8.23 6.22 -3.09 4.1 6160.755 (3H)4p z4H (1F)4s c2F 7.58 5.57 -3.63 3.5 6233.534 d5 4s2 c4D (5D)4p z4F 7.47 5.48 -2.94 2.7 6248.898 d5 4s2 c4D (5D)4p z4D 7.49 5.51 -2.70 2.9 6317.983 d5 4s2 c4D (5D)4p z4D 7.47 5.51 -1.99 2.6 6371.125 d5 4s2 c4D (5D)4p z4F 7.49 5.55 -3.56 2.8 6383.722 d5 4s2 c4D (5D)4p z4D 7.49 5.55 -2.27 2.7 6385.451 d5 4s2 c4D (5D)4p z4D 7.49 5.55 -2.62 2.9 6442.955 d5 4s2 c4D (5D)4p z4F 7.47 5.55 -2.88 2.9 6455.837 d5 4s2 c4D (5D)4p z4D 7.47 5.55 -2.95 3.0 6482.204 (3G)4p x4G (3F)4s c4F 8.13 6.22 -2.27 3.3 6491.246 d5 4s2 c4D (5D)4p z4D 7.49 5.58 -2.79 3.0 6493.035 d5 4s2 c4D (5D)4p z4D 7.49 5.58 -2.58 2.9 6506.333 d5 4s2 c4D (5D)4p z4F 7.49 5.59 -3.11 3.1 6517.018 d5 4s2 c4D (5D)4p z4D 7.49 5.58 -2.76 3.1
tion Fe II lines, or even define an excitation temperature for the upper levels, as they certainly are far from equilibrium. However, it is clear from the figure that, whatever level exci-tation law is adopted, the high exciexci-tation lines are 2–3 orders of magnitude stronger than if they were excited by the same mechanism as the lower excitation permitted lines. The values displayed in Table 5 are a clear indication of an overpopula-tion of the upper levels, as also appears in Fig. 16. This will be discussed in Section 5.1.
3.3. FeIIforbidden emission lines
Now we analyse the narrow and broad components of the for-bidden lines of ionized iron observed in the 1999 spectrum of HD 45677. We adopted the [Fe II] transition probabilities of Quinet et al. (1996), and took for simplicity χc= 0 eV.
The plot of [Fe II] individual multiplets in the [log gfλ, log Fλ3
gf] diagram shows a systematical down-ward shift of multiplets arising from higher excitation terms, that can be used to determine their upper level population
Figure 8: Position of the high excitation Fe IIlines (filled tri-angles) in the 1999 spectrum of HD 45677 with respect to the global SAC of Fig. 6. The multiplet 37 lines (filled squares) are shown for comparison .
Figure 9: SAC diagram of narrow components of multiplets 4F, 6F, 7F, 17F, 18F, 19F, 20F and 21F of [FeII] in 1999. The same mean level excitation temperature of 10 500◦K has been used
for both lower and upper levels. The observational points are
interpolated with horizontalline.
gradient q. In the strongest multiplets there is also an indication of the most intense lines having a smaller normalised flux.
We have overlapped the [Fe II] multiplets in the [X − Xc,Y − Yc] plane, in the same way as we did for permit-ted Fe IIlines , with the least squares method, assuming that
thegroundand lower Fe+levels have the same excitation
tem-perature (i.e., p = q = 5040/Tf). The derived SAC diagram
shown in Fig. 9 corresponds to a best fit excitation temperature of the metastable levels (0-4 eV) of Tf = 10 500 ± 1 000 K.
Actually, the upper [FeII] levels are the same as the lower lev-els of the permitted transitions treated above. Nevertheless, the fact that two such different excitation temperatures have been derived, added to the smaller FWHM value of the [FeII], 25 km s−1against 45 km s−1for Fe IIpermitted lines, is strongly
Table 6: SAC fit parameters for the [FeII] narrow components. q (eV−1) and Yf are fitting parameters.Y is Yf corrected for q
at a mean 3 eV excitation potential. log N(H)is the logarithm
of the total number of Hydrogen atom in the emitting volume.
year 1995 1999 2001 q 0.44 ± 0.05 0.47 ± 0.05 0.57 ± 0.08 Yf −15.51 ± 0.16 −15.41 ± 0.13 −15.20 ± 0.25 Y -16.83 -16.82 -16.91 Tf 11 500 ± 1 000 10 500 ± 1 000 9 000 ± 2 000 log N(H) 49.9 ± .2 50.0 ± .1 50.2 ± .3 N lines 85 80 31 red.χ2 0.68 0.82 0.94
suggestive of two different formation regions. The results for the three epochs are summarised in Table 6.
Let us point in Table 6 that the variation in the different epochs of the Tfand Yfparameters are much smaller than those
derived for the permitted lines, probably as the result of the smaller uncertainties. The value, at the mean upper level exci-tation potential of our sample lines χu= 3.0 eV, of the quantity
Y = −p × χu+ Yfis smaller by a factor .8 in 2001
correspond-ing approximately to the small flux decreasebetween 1999 and
2001-2002 noted in Sec. 2.2.
Figure 10: SAC diagram of broad components of multiplets 4F, 6F, 7F, 17F, 18F, 19F, 20F and 21F of [Fe II] in 1999. The representative points are shifted horizontally and vertically by log level population corresponding to an excitation temperature of 8 500 K.
Table 7: SAC fit parameters for the [FeII] broad components.
year 1995 1999 2001 q 0.50 ± 0.20 0.64 ± 0.09 0.48 ± 0.18 Yf −15.95 ± 0.60 −15.38 ± 0.26 −15.94 ± 0.53 Y -17.45 -17.30 -17.38 Tf 10 000 ± 3 000 8 000 ± 1 500 10 500 ± 3 000 log N(H) 49.5 ± .6 50.0 ± .3 49.5 ± .5 N lines 61 63 28 red.χ2 2.0 1.23 1.45
As for the broad components of the [FeII] emission lines, the strength of the better measured lines seems to suggest by itself an emitting region with properties comparable to those of the narrow components discussed above, this is confirmed by the fitting values given in Table. 7.
3.4. CrIIemission lines
Figure 11: Self Absorption Curve for the narrow components of CrIIemission lines .
Table 8: SAC fit parameters for the narrow and broad compo-nent lines of CrII in 1999.
component narrow broad p=q 0.82 ± 0.15 0.43 ± 0.28
Xc −8.63 ± 0.60 −7.03 ± 1.00
Yc −18.42 ± 0.98 −20.87 ± 1.85
N lines 11 11 red.χ2 0.07 0.19
The analysis of the narrow and broad Cr II multiplet 44 components, indicates a moderate optical thickness. Here again we adopted χc = 0 eV in the equations defined in Section 3.1.
Due to the low number of CrIIlines observed in the other mul-tiplets we have derived the SAC parameters taking the same
Figure 12: Self Absorption Curve for the broad components of the CrIIemission lines.
excitation temperatures for the lower and upper terms of both the narrow and broad components.
The SACs plotted in Figs. 11 and 12 correspond to the pa-rameters given in Table. 8.
4. Line profiles
The two–component profile of the emission lines is sugges-tive of line formation in two regions with different velocity broadening in the observer’s line–of–sight. In B[e] stars, of which HD 45677 is one important representative, low excita-tion emission lines, like among others FeIIand CrII, are gen-erally thought to be formed in an equatorial disk around the B star, while the higher temperature emission lines are thought to be emitted in a polar wind. Zickgraf (2003) recently studied the kinematical structure of B[e] star envelopes based on high res-olution profiles of permitted and forbidden emission lines, and compared them with theoretical profiles emerging from an op-tically thin latitude–dependent expanding stellar wind and an equatorial opaque dust ring. He observed in his 1986–88 CAT– CES spectra of HD 45677 a marginal line split of 6 km s−1for
the [OI] 6300 Å emission line, while [FeII] and [NII] were sin-gle peaked. He interpreted his observations with line formation in a wide opening angle polar wind seen nearly pole–on.
In HD 45677 the profile of the emission lines do not show the double peaked structure typical of line emission from an equatorial rotating disk seen at high inclinations. The narrow components of strongest permitted emission lines are split by a slightly longward displaced (∼ +3 km s−1) dip which we
at-tribute instead to absorption from matter flowing towards the star. A central absorption with the same radial velocity is also present in the NaIyellow doublet, and in the MgII4481 Å line. No line splitting is seen in the forbidden lines. Another impor-tant feature of HD 45677 is the narrower profile of the forbid-den [Fe II] lines, suggesting line formation in regions with a smaller radial velocity range, like for instance the outer parts
of a rotating disk in which the inner, denser and faster rotating parts produce the permitted emission lines.
In HD 45677 the velocity broadening of the Si II photo-spheric lines (≤∼ 70 km s−1, Israelian et al. 1996) should
indi-cate either a relatively low stellar rotational velocity, or a low inclination angle i of a fast rotating star. If this is the case, the narrow emission components could arise from a dense, fast ro-tating disk seen nearly face-on. If one assumes that matter in the disk is rotating at the Keplerian velocity, the narrower [Fe II] emission lines should be formed in the outer (and less dense) rings of the disk. In such a framework, the broad components of the FeIIand [FeII] emission lines, that, as discussed above, approximately emit a total amount of radiative power compa-rable to that of the narrow components, should be formed in region(s) with a large radial velocity range in the observer’s line-of-sight. This could beidentifiedas being a rather massive
streamof matter flowing from(or to)the stellar polar regions.
We geometrically model the emitting region of HD 45677 in order to synthetise simultaneously both the observed profiles of the [FeII] emission lines and the FeIIones.
As discussed above, the model of a disk seen nearly edge-on proposed for this star for instance by Swings 1973 or de Winter et al. 1997 besides the fact that it would imply a too small star rotational velocity, would generate emission line profiles with the typical double-peaked profile totally different from the ones observed.
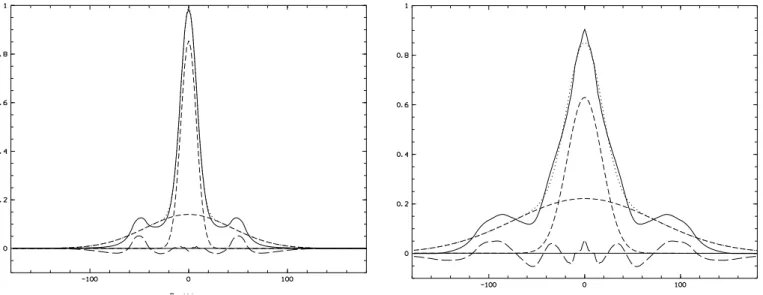
The bimodal model currently adopted for B[e] stars sup-poses different physical conditions in the dense disk medium, where the emission lines of the lower excitation species such as FeIIare supposed to be produced, and in the polar wind or streams, where lines from higher excitation species are emitted (Swings 1973, Zickgraf 1998). We nevertheless took this con-figuration, namely an edge-on disk and a polar wind confined in a cone having the same physical conditions (temperature and density), into consideration. The most similar profile was ob-tained with a 24◦ opening angle disk inclined 85◦on the sky plane, in which the wide component is emitted, and a 30◦cone wind for wich we had to suppose a 100 km s−1decreasing
ve-locity wind to get the narrow component. The computed profile is shown in Fig. 13. But the result is unsatisfying (too sharp).
In order to get better results we had to suppose that the narrow components are produced in a nearly pole-on
opti-cally thindisk. We got satisfying results taking an inclination
to the sky plane of 12◦, and as a first step a keplerian rota-tional velocity taken to be 340 km s−1at the star surface. With
such an inclination and velocity we are in agreement with the v sin i = 70 km s−1 determination of Israelian et al. (1996).
Such a region of line formation, would, when seen nearly pole on, resemble Kastner’s static model.
To get the broad line components we had to suppose the ex-istence of a flow falling on the disk (or alternatively escaping from the disk), whose material is incorporated into (or alterna-tively ejected from) the disk material at the Keplerian velocity in each point.
With such a configuration we can reproduce at the same time as well the permitted (Fig. 14) as the forbidden (Fig. 15) FeIIline profiles, by just playing on the distance to the star of the emitting zone.
Figure 13: Histogram of the emitting material radial velocities of an optically thin disk plus polar wind. The disk is inclined 85◦to the sky plane with a total opening angle of 24◦. The
ve-locity in the disk is 150 km s−1at the photospheric radius r=1,
and the law is Keplerian. The polar wind is emitted in a 30◦
cone with a velocity of 100 km s−1at the pole and decreases
exponentialy. In this figure and in figures 14 and 15, the syn-thetised profile and the continuum are plotted as a solid line, each Gaussian component as a short dashed line, the total fit profile as a dotted line and the residual flux as a long dashed line.
The permitted and forbidden FWHM line components can be understood if we assume that the permitted lines are formed in the inner parts of the disk, while the forbiden ones issue from the external parts of the Keplerian disk.
Fig. 14 shows the profile corresponding to an optically thin Keplerian disk inclined 12◦on the sky plane. The velocity at the
photospheric radius r=1 is equal to 340 km s−1. The emission
comes from the inner part (5 < r < 9, in photospheric radius unit) of the optically thin disk whose total opening angle is 24◦. The components flux ratio narrow/broad is close to 1 (the
narrow component is slightly more intense) as was found for HD 45677, while the components FWHM are similar (44 and 194 km s−1) to the FeIIpermitted lines ones.
Fig. 15 shows the profile corresponding to the same disk, but with emission coming from outer regions
(15 < r < 20, in photospheric radius unit). The component flux ratio narrow/broad is slightly higher than in Fig. 14, as it is the case for [FeII] with regard to FeIIlines in HD 45677, while the components FWHM are similar (28 and 108 km s−1) to the
[FeII] lines ones.
These two profiles model fairly well the mean component parameters we measured in HD 45677 as well for the permitted as for the forbidden FeIIlines.
Figure 14: Theoretical profile corresponding to the histogram of the emitting material radial velocities of an optically thin Keplerian disk inclined 12◦ on the sky plane. An accreting
wind generates the broad component. The total fit profile co-incides with the broad component for large velocities, and with the sum of the components for small velocities. The component FWHM are the ones derived in Sec. 2.2. The Keplerian veloc-ity is equal to 340 km s−1at the photospheric radius r=1. The
emission comes from 5 < r < 9, in photospheric radius unit.
Figure 15: Theoretical profile corresponding to the histogram of the emitting material radial velocities of an optically thin Keplerian disk inclined 12◦on the sky plane. An accreting wind
generates the broad component. The component FWHM are the ones derived in Sec. 2.2. The Keplerian velocity is equal to 340 km s−1at the photospheric radius r=1. The emission comes
Figure 16: Relative population of the Fe+ levels in the [Fe II] (squares), and in the low and high excitation Fe II emission re-gions derived from the narrow emission components measured in the 1999 spectrum of HD 45677. The fluxes of the lower ex-citation emission lines (open circles) have been corrected for self–absorption, as discussed in the text. The high excitation emission lines are drawn as triangles. The straight lines rep-resent the mean excitation temperatures of the upper levels of the [FeII] and of the lower and upper levels of the FeII emis-sion lines, respectively. The crossing at 4.72 eV marks the con-nection between the lower (3900 K) and upper (3150 K) FeII level population laws. The zero points Y(0 eV) are the esti-mated ground level relative populations.
5. Discussion
5.1. Level Population
The results of our analysis concerning level population are summarised in Fig. 16 where we plot for the three groups of lines – forbidden, low excitation and high excitation permit-ted FeIInarrow components emission lines – the logarithm of the normalised line flux as a function of the excitation poten-tial χu of the upper level of the transitions for our 1999 data.
The fluxes of the intermediate excitation permitted lines are corrected for the self–absorption as discussed above. The di-agram is used to investigate the formation region of the three line groups. One normally expects the upper levels of the per-mitted lines to be de-populated with respect to the metastable levels. If no de-population occurs, the population laws for the upper levels and the lower levels should join. In fig. 16, the mean population laws for the upper (3 150 K) and the lower (3 900 K) cross at the mean excitation potential value of 4.72 eV, to take into account the overall deviation of the population of the upper (odd) levels of the FeIItransitions with respect to the population of the lower (even) ones (see Section 3.1).The extrapolated ordinate value at 0 eV of this law, given by
equa-tion 4, for the FeIIlines (−14.51 ± 1.2) turns out to be close
to the value for the [FeII]lines (−15.41 ± 0.13). This will be
discussed in Section 5.2.
We get in this diagram a limit to the position of the metastable levels in the permitted line formation region. As
for-bidden and low excitation FeIItransitions have the metastable levels in common, we may note that the [FeII] transition upper levels in the FeIIpermitted lines region appear to lie in this di-agram aproximately 2 to 3 dex under the location of the [FeII] observed line ones. Consequently [FeII] lines in the permitted line formation region cannot be observed.
Finally, the high excitation Fe+levels are clearly overpopu-lated with respect to the upper levels of the lower excitation Fe II emission lines. We attribute this overpopulation to the same fluorescence mechanism acting in other peculiar stars, such as KQ Pup, η Car, and RR Tel (Muratorio et al. 1992; Viotti et al. 1999; Hartman & Johansson 2000) whose optical and UV spectrum shows prominent FeIIlines arising from high excitation levels. Like in these cases, the far–UV radiation is most probably an important process of population of the Fe+
upper levels in the envelope of HD 45677, while probably di-electronic recombinations are unimportant.
5.2. Column density
From the position of the bend in the SAC plots of FeIIlines (Fig. 6 and Fig. 7 for 1999 data) we are able to determine the value of Xc and hence through eq. 3 the values of the Fe+column density of the FeIIpermitted lines emitting regions
for each studied epoch.
To derive the Fe II column density Nc
gc , defined by eq. (3),
in the narrow component FeIIpermitted line region, we have to estimate the velocity broadening of the opacity profile vc
in eq.3. The narrow components of the emission lines of HD 45677 should be formed in a region with a small velocity gra-dient in the line of sight, as discussed in Section 4, it is sup-posed to be an equatorial disk seen nearly pole on. If we are observing a disk in rotation, without being in its plane, the ap-propriate vcto use, to which the line broadening along a line
of sight is linked, is twice the thermal broadening velocity that has been derived from the [FeII] emission lines, as discussed in Section 3.3. The local velocity dispersion for a tempera-ture Tth=11 500 K is given by vth = 0.215 105
√
Tth/PA where PA = 55.85 for Fe+(Baratta et al. 1998). For the narrow
com-ponents vc= 6.2 km s−1. As for the broad components, the
ap-propriate vcto use is given by our model, as the mean velocity
along a line of sight, vcis equal to 7 km s−1.
Table 9: logarithm of the minimum Fe+column densityNc
gc (for
an excitation potential χc= 2.75 eV) of both components
emis-sion line region at the different epochs studied. The first line display (N) the narrow component region values, while the sec-ond line displays (B) the broad component region ones.
year 1995 1999 2001 logNc
gc (N) 14.6 ± 0.1 14.9 ± 0.1 14.73 ± 0.1
logNc
gc (B) 14.4 ± 0.1 14.5 ± 0.1 14.5 ± 0.1
The different epochs and region logNc
gc values at χc =
2.75 eV are given in Table 9. If we extrapolate this column den-sity to 0 eV using 1.28 as the exponent of the power law of the lower terms population we obtain log N(Fe+) = 46.5 in 1999.
It is not certain that assumption (d), in sec. 3, about the same Boltzmann population distribution for all metastable levels is correct for the more excited of these levels (see Verner et al. 2002). Therefore, if we are very conservative and suppose that the mean excitation temperature down to 0 ev is 10 000 K, typi-cal of HII regions, as well as being of the order of what we find here for the less excited forbidden [FeII] lines with lower levels at or near 0 ev, the column density values might be smaller by a factor of about 2.1 dex.
The different narrow and broad component column densi-ties in Table 9 are very similar. The eventual column density variations with time are of the order of the precision.
As for forbidden lines, Fig. 9 shows a marginally signif-icant bending of the data points towards large optical thick-nesses, as if the strongest [Fe II] lines were slightly self– absorbed. The curve bend, if real, would correspond in this figure to a self absorption factor of 3 for strongest of the ob-served forbidden lines, much less than what is obob-served for the strongest permitted lines, as the optical depth range is lower for forbidden lines. It would correspond to an Fe+ column density about 100 times larger than that above derived for the permitted lines, which seems to us unrealistic.
The vertical overlapping of the multiplets provides the zero point of the ordinates: Yf = −15.41 ± 0.13 (see Table 6). This
quantity is related to the total number N(Fe+) of Fe+ions in the
[FeII] emitting volume through the relationship (see Baratta et al. 1998):
log N(Fe+)/d2= Yf + log U + 16.977 (5)
, where U is the partition function of Fe+.
Assuming for HD 45677 a distance of 420 pc (Zorec 1998), we obtain log N(Fe+) = 45.6 ± 0.13 which gives in 1999, for a cosmic abundance, a total hydrogen mass of 1.7 1026g, with a precision factor estimated as 0.13.
Notice that the log N(Fe+
) = 46.5 ± 1.3 value of the FeII
permitted emitting region, obtained with a value of 1.28 for the
lower level constant p of eq. (1), is close to the forbidden FeII
region one.
5.3. Size of the emitting region
From the fit results summarised in tables 3 and 4 we can calcu-late, using equations 3 and 4, the apparent size of both emitting line regions.
Table 10: Emission line region minimum sizes at the different epochs studied (in cm). The first line display the narrow com-ponent region values (N), while the second line displays the broad component region ones (B).
year 1995 1999 2001 log R′(N) 13.1 ± 0.5 12.9 ± 0.3 12.5 ± 0.4
log R′(B) 12.8 ± 0.8 13.0 ± 0.4 12.6 ± 0.5
For 1999 we obtain log R′= 12.90 ± 0.34 for the narrow
line region. The values of log R′in Table. 10 are typical radii
of the line emitting region, equal to
q
S cos i
π . The radius of
a B2 V star is according to Drilling and Landolt (2000 in ‘Astrophysical Quantities”, page 389)) near 4 1011cm. The size of the region where the narrow Fe II emisison lines originate, probably a disk, turns out to be 20 (from 9 to 44) times that of the stellar radius. The model we presented in Section 4 is con-sistent with these results as the permitted line profile similar to the one observed is emitted from a region whose surface is that of a disk of 7 stellar radii. The assumption has been made in the R′determination that the population laws for the upper levels
and the lower levels join at 4.72 eV. Their values obtained are therefore minima, corresponding to maximum w values.
The log R′ values obtained from 1995 and 2001 data in
Table 10 remain close to the limits evaluated from the 1999 data in Table 10.
As for the broad component emitting region apparent sur-face, the values of log R′are very close, at least in 1999 to the
narrow component one. This result is consistent with the model of a disk seen nearly pole-on, developped in Section 4, as the regions in which each component is emitted, being seen under the same opening angle, are supposed to have similar apparent surfaces.
As forthe narrow componentCrIIemitting region, we used
v0= 6 km s−1(twice the 10 000 K thermalbroadeningvelocity)
and the values of Table. 8, hence aCr II column density N0
g0 =
15.98 ± 0.6. The log R′ value derived in 1999 (12.2 ± 0.8) is
only slightlysmaller than that of the FeIIemitting regions.
6. Conclusions
The SAC method has given consistent results. We have ob-tained the properties of what is probably a disk of HD 45677, including limits on a characteristic column density and a char-acteristic radius of the FeIIemitting region. These estimates re-quire reasonable assumptions, one of which is a true Boltzmann distribution of the populations of the lower even metastable lev-els and another that the Boltzmann–like law of the populations of the odd upper levels of strong optical lines are not more than what would be expected from a smooth fit between these odd and even population laws. We have demonstrated that the well known split emission line profile is in fact due to absorption components like in the ultraviolet. We have demonstrated that emission lines have narrow and broad components. We have shown that the double emission profile can be explained with a disk plus a flow (perhaps a wind) moving in or out of the disk. The FeIIforbidden lines show a similar two component structure, but the smaller width of each component is consistent with their production in a more external part of the disk, where the Keplerian velocity is lower. The examination of the fluxes of the narrow [FeII]components has shown that the metastable Fe+ levels follow a Boltzmann–type law with a mean excita-tion temperature around 11 000 K. Such a value may actually represent the electron temperature of the [Fe II] emitting re-gion, if the metastable levels are in equilibrium with the ground term through electron collisions. This is probably the case of HD 45677, since we expect the electron density to be large enough (Ne ≥ 106 cm−3) for bringing the metastable levels
to LTE (Nussbaumer & Storey 1988). The low electron tem-perature with respect to the stellar surface temtem-perature may be due to cooling of the [FeII] region by the large line emission of this ion. Indeed, low electron temperatures were predicted by Verner et al. (1999) and Verner et al. (2002) for the η Car Weigelt blobs that are strong Fe+ emitters. Fairly low [FeII] ex-citation temperatures were derived for η Car (12000 K, Viotti et al. (1999) and for the symbiotic star RR Tel (6600 K Kotnik-Karuza et al. 2002).
The narrow components of the Fe II permitted emission lines in HD 45677 are slightly, but significantly broader than the corresponding [FeII] components. From the SAC analysis of the FeIIemission lines we have derived an Fe+ lower level excitation temperature much smaller than that derived from the [FeII] lines, namely around 3 900 K. We take these results as evidence of different (but possibly partially overlapping) emit-ting regions. The derived excitation temperatures of the lower and upper levels of the permitted FeIIlines are much smaller than that expected if Fe+ were in thermodynamical equilib-rium with the local plasma. Verner et al. (2002) calculated the formation of singly ionized iron in the Weigelt blobs of η Car. According to them Fe+ emission is the most important coolant in the blobs. FeIIemission originates at electron temperatures 5 000 K ≤ Te ≤ 7 500 K. This can also be seen by comparing
their figs, 8 and 9. We argue that for HD 45677 the upper lev-els of the permitted low excitation transitions are mostly pop-ulated by the diluted stellar UV radiation followed by sponta-neous decay, and that in the FeIIregion the radiation density is high enough to make the radiation induced transitions more im-portant than electron collisions. Similar considerations can be made for FeIIand [FeII] broad components, as their emitting region parameters appear fairly close to the narrow components ones (see Table. 3 and Table. 4 for FeIIlines and Table. 6 and Table. 7 for [FeII] lines).
The Fe II metastable level, as well as the lower level (Table. 3) excitation temperatures are suspected to increase with time. The high excitation anomalous multiplets may in-dicate the presence of inhomogeneities.
The shape of the iron broad component is insufficiently known now to decide about the structure of the non-disk com-ponent. Nevertheless the similarity of the physical parame-ters derived for narrow and broad components (Texc, logNO
g0)
suggest that both emitting regions, if not the same (different FWHM) are physically linked.
Our identification of the broad components, and the sus-pected variability of both emitting regions physical parameters should stimulate in future new higher quality observations (es-pecially in the blue) in order to study more precisely the shape of the emission lines.
Acknowledgements. We are grateful to R.F Viotti for very construc-tive suggestions.This work is partly based on contract of the Consiglio Nazionale delle Ricerche (CNR).
References
Allen D.A., Swings, J.P., 1976, A&A47, 293
Allen’s Astrophysical Quantities Fourth edition., 2000, Arthur N.Cox editor
Andrillat Y., Jaschek C., Jaschek M. 1997, A&AS124, 441
Baratta G.B., Friedjung M., Muratorio G., Ross, C., Viotti R., 1998, The Self Absorption Curve Method, A Users‘ Munual, IAS Internal Report, December 1998
Cidale L., Zorec J., Tringaniello L. 2001 , A&A, 368, 160 Coyne G.V., & Vrba F.J. 1976 ApJ, 207, 790
Eriksson M., Johansson S., Wahlgren G,M., 2004, A&A, 422, 987 Friedjung M., Muratorio G., 1987, A&A, 188, 100
Grady C.A., Bjorkman K.S., Shepherd D. et al. 1993, ApJ 415, L39 Hartman H., Johansson S. 2000, A&A, 359, 627
Israelian G., Friedjung M., Graham J., Muratorio G., Rossi C., de Winter D., 1996, A&A, 311, 643
Israelian G., Musaev F., 1997, A&A, 328, 339 Kastner S.O., 1999, A&A, 351, 1016
Kotnik-Karuza D., Friedjung M., Selvelli P.L., 2002, A&A, 381, 507 Kurucz R.L., 1979, ApJS, 40,1
Kurucz R. L., 1991, Precision photometry: Astrophysics of the galaxy. In: Davis Philip A.G., Upgren A.R., James K.A. (eds.). L. Davis press, Schenectady, New York
Kurucz, R. L., 1993, SAO KURUCZ CD-ROM, No. 18
Lamers, H.J.G.L.M., Zickgraf, F.J., de Winter, D., Houziaux, L., Zorec, J. , 1998 , A&A, 340, 117
Muratorio, G., Friedjung, M., 1988, A&A, 190, 103
Muratorio, G., Viotti, R., Friedjung, M., Baratta, G.B., Rossi, C., 1992 A&A 258, 423
Moore Ch., 1945, “A multiplet table of astrophysical interest” NSRDS-NBS 40 I ed. 1945 and successive editions
Nussbaumer,H., Storey, P.J., 1998 A&A193, 327
Quinet, P., Le Dourneuf, M., Zeippen, C.J. 1996, A&AS 120, 361 Schulte-Ladbeck, R. E., Shepherd, D. S., Nordsieck, K. H., Code,
A.D., Anderson, C.M., Babler, B.L., Bjorkman, K.S., Clayton, G.C., Magalhaes, A.M., Meade, M.R., Taylor, M., Whitney, B.A. 1992, ApJ, 401, L105
Sitko, M. L., Grady, C. A., Hanner, M. S., Lynch, D. K., & Russell, R. W. 1994, in Circumstellar Dust Disks and Planet Formation, ed. R. Ferlet & A. Vidal-Madjar (Paris: Editions Frontie res), 389 Swings J.P., 1973 A&A 26, 443
van den Ancker, M.E., Blondel, P.F.,Tjin A Djie, H.R.E., et al. 2004 MNRAS, 349, 1516
Verner, E.M., Verner, D.A., Korista, K.T., Ferguson, J.W., Hamann, F., Ferland, G.J., 1999, ApJS, 120, 101
Verner, E.M, Gull, T.,R., Bruhweiler, F., Johansson, S., Ishibashi, K., Davidson, K., 2002, ApJ, 581, 1154
Viotti, R., 1976, ApJ, 204, 293
Viotti, R., Rossi, C., Baratta, G.B. 1999. In: Eta Carinae at the Millenium. J. Morse, R. Humphreys, A. Daminelli eds ASP Conference Series Vol.179, 184
Viotti, R.F., Spector, N., Baratta, G.B., Rossi, C., 2000, A&A, 363, 343
de Winter D., and M.E. van den Ancker 1997, A&AS 121, 275 Zickgraf, F.J., 2001, A&A, 375, 122
Zickgraf, F.J., 1998 in Dusty B[e] stars, eds A.M. Hubert & C.Jaschek Zickgraf, F.J., 2003, A&A, 408, 257
Zorec, J. in B[e] stars, ed. A. M. Hubert, & C. Jaschek (Kluwer Ac. Pub.), 27
Zorec, J., Moujtahid, A., Ballereau, D., Chauville, J., in B[e] stars, ed. A. M. Hubert, & C. Jaschek (Kluwer Ac. Pub.), 55

![Table 2: Mean radial velocities (in km s − 1 ) of the most numer- numer-ous species, absorption and emission of Cr II, Fe II , and [Fe II ] emission](https://thumb-eu.123doks.com/thumbv2/123doknet/14609230.545189/5.892.456.835.486.792/table-mean-radial-velocities-species-absorption-emission-emission.webp)


![Figure 16: Relative population of the Fe + levels in the [Fe II]](https://thumb-eu.123doks.com/thumbv2/123doknet/14609230.545189/13.892.65.429.72.346/figure-relative-population-fe-levels-fe-ii.webp)
