Publisher’s version / Version de l'éditeur:
Journal of Paint Technology, 45, 580, pp. 49-57, 1973-06-01
READ THESE TERMS AND CONDITIONS CAREFULLY BEFORE USING THIS WEBSITE. https://nrc-publications.canada.ca/eng/copyright
Vous avez des questions? Nous pouvons vous aider. Pour communiquer directement avec un auteur, consultez la première page de la revue dans laquelle son article a été publié afin de trouver ses coordonnées. Si vous n’arrivez pas à les repérer, communiquez avec nous à PublicationsArchive-ArchivesPublications@nrc-cnrc.gc.ca.
Questions? Contact the NRC Publications Archive team at
PublicationsArchive-ArchivesPublications@nrc-cnrc.gc.ca. If you wish to email the authors directly, please see the first page of the publication for their contact information.
NRC Publications Archive
Archives des publications du CNRC
This publication could be one of several versions: author’s original, accepted manuscript or the publisher’s version. / La version de cette publication peut être l’une des suivantes : la version prépublication de l’auteur, la version acceptée du manuscrit ou la version de l’éditeur.
Access and use of this website and the material on it are subject to the Terms and Conditions set forth at
Mechanical properties of sealants Pt. IV : Performance testing of
two-part polysulfide sealants
Karpati, K. K.
https://publications-cnrc.canada.ca/fra/droits
L’accès à ce site Web et l’utilisation de son contenu sont assujettis aux conditions présentées dans le site LISEZ CES CONDITIONS ATTENTIVEMENT AVANT D’UTILISER CE SITE WEB.
NRC Publications Record / Notice d'Archives des publications de CNRC:
https://nrc-publications.canada.ca/eng/view/object/?id=80471d8b-4ccc-4b77-a7b2-b45892152fbd https://publications-cnrc.canada.ca/fra/voir/objet/?id=80471d8b-4ccc-4b77-a7b2-b45892152fbdSer
TH1
N2lr2
no.564
c . 2BLDG
NATIONAL RESEARCH COUNCIL OF CANADA
CONSEIL NATIONAL DE RECHERCHES DU CANADA
Mechanical Properties of Sealants:
IV.
Performance Testing
Of
Two-Part Polysulfide Sealants
by
K. K. Karpati
'
BU!iCIIi.IG RESEARCHI
"-.
1 F C z : % l r' ,'I :-3 Lf
-
i
fReprinted from
TOURNAL O F P A I N T T E C H N O L O G Y
-
Vol.
45, No. 580, May 1973
p. 49-57
Research Paper No. 564 of the
Division of Building Research
OTTAWA June 1973
LES PROPRIETES MECANIQUES DES PRODUITS DE SCELLEMENT, IV: ESSAIS DE FONCTIONNEMENT DE PRODUITS DE SCELLEMENT POLYSULPHIDIQUES
A DEUX PARTIES
Som rt~aire
Au moyen d'un echantillon modble vieilli artificiellement, l'auteur definit le comportement mbcanique cl'un produit de scellement poly- sulphidique a deux parties par ses variables primaires: ccntrainte, deformation, temps et temperature. I1 r k ~ ~ s s i t a superposer les variables temps et temperature, rbduisant ainsi le nombre d e variables a trois. I1 caractbrise le produit d e scellement au moyen d'un systbme d e co- ordonnees a trois dimensions. La projection des points de rupture dans le plan d u logarithme dCEormation vs le logarithme temps constitue le lien entre les essais en laboratoire et le fonctionnement a l'extbrieur. En se fondant sur cette projection, I'auteur obtient une seule valeur caractkrisant le produit de scellement. La mbthode d'essai decrite con- vient aux normes.
Mechanical Properties of Sealants:
IV.
Performance Testing
Of
Two-Part Poly sulfidev§ealants
K. K. KARPATI
National Research Council of Canada"
The mechanical behavior of a two-part polysulfide sealant is defined, using an artificially aged model specimen, b y its primary variables: stress, strain, time and temperature. Time-temperature superposition was successfully made on the data, thereby reducing the number o f variables to three, a n d the sealant char- acterized by the property surface o f a three-dimen- sion co-ordinate system. Proiection o f the break points in the log-strain vs. log-time plane is the l i n k between laboratory testing and outdoor performance. Based on this projection a single value was derived to char- acterize the sealant. The testing procedure described is suitable for standards.
KEY WORDS: Sealants; Building sealants; Polysulfide
sealants; Mechanical properties o f sealants; Rate of movement dependence o f mechanical properties o f
sealants; Temperature dependence of mechanical
properties o f sealants; Performance testing o f sealants.
INTRODUCTION
THIS is the fourth in a series of papers reporting the results of the investigations of mechanical properties of sealants. Previous ~ublications I dealt with one- art I chemically curing silicone sea1ants.l Their mechanical properties proved to be temperature independent in the amorphous state. This rather exceptional behavior among polymers had the advantage of simplifying the complicated pioneer work by reducing the four basic variables characterizing the material-stress, strain, time and temperature-to three. The present investiga- tion makes full use of the experience gained with the one-part silicone sealant. As the material used here is temperature dependent, the feasibility of time-tem- perature superposition is investigated for the speci- mens used.
Building Materials Section, Division of Building Research, Ottawa, Canada K I A 0R6.
VOL. 45, No. 580, MAY 1973
EXPERIMENTAL
The two-part poIysulfide sealant used for the in- vestigation conforms to the CGSB specification 19- GP-3b. I t is a commercially available product, pig- mented light grey.
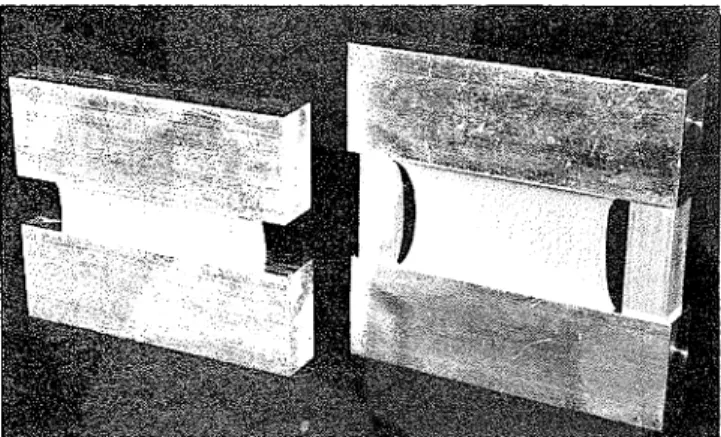
Figure 1 illustrates the specimen used for the in- vestigation. The size of the sealant bead is ?I X f4 X 2 in. (1.3 X 1.3 X 5.1 cm) cast between aluminum bars of ?4 X 1 X 3 in. (1.3 X 2.5 X 7.6 cm). Accord- ing to manufacturers' instructions, the substrate was not primed before application of the sealant. Thc specimens are cast using siliconc lease paper under- neath the bead and on the end spncers thnt limit the length to 2 in. They are cured at 72 F (22.2 C) and 5070 relative humidity for two weeks. They are then heat- aged at 158
+
2 F (70+
1 C ) in a ventilated ovei~ for a month. The specimen is the same size as that used in previous investigatioils and as required by most specifications.Tensile testing was by ineans of an Instroil tensile
cm/ min
Table 1-Cross-Head Speeds
O/O exten- sion/min 393.7 78.7 39.37 7.87 3.937 0.787 0.394 0.079 0.039
machine equipped with a chamber capable of produc- ing various test temperatures. Lower-than-room tem- perature was attained by feeding liquid nitrogen into the chamber, higher temperatures by using the built- in heaters. The test temperatures used were: 100 I;
(37.8 C ) , 73 F (22.8 C ) , 20 F (-6.7 C ) , -20 F
(-28.9 C ) , -30 F (-34.4 C ) , -40 F (-40.0 C ) . Cross-head speeds are indicated in Table 1.
During the tensile test, the substrate was gripped along its full length by jaws having serrated and parallel suifaces. A du Pont 900 differential thermal analyzer was used to determine the glass transition temperature of the sealant.
Programs were written for an IBM 360 computer to do the necessary calculations and provide tapes for plotting. The latter was done on an' EAI 430 Data- plotter.
0 1 I I I I
0 100 2 0 0 3 0 0 4 0 0
% EXTENSION
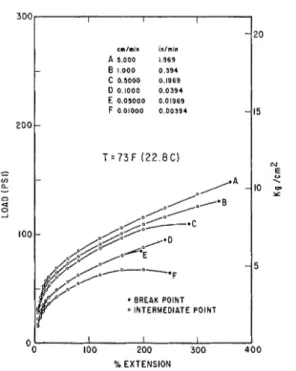
Figure 2-Tensile stress-strain curves at
-
30 FDISCUSSION
Smith2 and authors quoted by him pointed out that the following equation can be derived for stress, S:
m
--Y/Rt
S / R =
/
M ( r ) 7 0 - e ) d l n r (1)where R is strain rate, y is strain, T is the relaxation
time, M ( T ) is the relaxation distribution function, and M ( 7 ) d In is the contribution of those elastic mechanisms to the instantaneous tensile modulus that have their relaxation times between In T and In T
+
dIn T. As SIR is a function only of y/R, the tensile cuives obtained at different strain rates are super- imposed on a single cumulative curve on a plot of log SIR vs. log -y/R. Smith found, empirically, that a cor- rection for true stress has to be applied: multiplying the stress by A, the extension ratio, will achieve the expected superposition.
By
this method, one obtains a single cumulative curve at each temperature (pro- vided the material is temperature dependent). If this single curve can be obtained for the model specimens described, replacing the array of stress-strain curves obtainable at each temperature, then the theoretical approach used by Smith to characterize polymers can be applied to the specimens. The feasibility of the approach was established for silicone sea1ants.l The cumulative curves obtained for silicone sealants at different temperatures were, however, identical within allowable errors. As will be seen later, this is not the case for polysulfide and a time-temperature super- position should be applied to the data in order to re-I I I 1
100 2 0 0 3 0 0 4 0 0 % E X T E N S I O N
7 . 0 0 BREAK POINT DINTERMEDIATE POINT
Figure 4-Tensile stress-strain curves reduced to unit strain rate
duce the number of variables. A t e m ~ e r a t u r e de- L pendent polymer can b e characterized at each tem- perature by a separate three-dimensional co-ordinate system where the three axes are the logarithms of stress. strain and time. The individual stress-strain curves define a surface in the svstem. A different sec- , tioil of the surface is obtained at different t e m ~ e r a - tures. If they are shifted along the time axis i; the strain plane, they will interlock to form a single con- tinuous surface at a given amount of shift. The shift factor is given by the Williams, Landel and Ferry
( W L F ) 3 equation as:
log a, = -CIo ( T - T,) / (C?"
+
T-
T o ) (2)where T is the test temperature and T o is the refer- ence temperature in comparison with which all the other three-dimensional systems were shifted. C I 0
MECHANICAL PROPERTIES OF SEALANTS I V
10 0 0 I I I I I
5 0 0 I I I I I I
I
- 2 0 0 -1 0 0 0 0 0 1 0 0 2 0 0 3 0 0 4 0 0
lop I lminl
Figure 5-Tensile stress-strain curves reduced to unit strain rate
and C z O are two constants related to the reference temperature. If the reference temperature is chosen as the glass transition temperature, then the constants, CIS and C26, are identical for many polymers: 17.44 (dimensionless) and 51.6 Kelvin, respectively. They are usually referred to as the "universal" constants, the quotation marks indicating that not every polymer has the same constants.
Before doing a time-temperature superposition, a small correction has to be applied to the data by multiplying the stress by T o / T . This correctioil is re- quired by the theory of rubber-like elasticity. Correc- tion should be made for density changing with tem- perature. The correction would, however, be small compared to the experimental errors and it was, there- fore, omitted.
The sealant used was pigmented and, consequent- ly, the load registered in the tensile tests should be corrected for the polymer volume present. The cor- rection was omitted because i t can be assumed con-
Test Temperature
Table 2-Statistics of the Cumulative Curves
(log XSTo/T vs log t)
100 F (37.8 C) 76 0.990 7.03 73 F (22.8 C) 74 0.990 7.12 20 F (-6.7 C) 91 0.988 7.36 0 F (-17.8 C) 91 0.991 7.50 20 F (-28.9 C) 61 0.987 7.70 -30 F (-34.4 C) 41 0.990 7.84 -40 F (-40.0 C) 90 0.988 8.00 n
-
Number of readings r-
Correlation coefficient a-
Interceptta
-
Limits for the intercept at the 95 per cent confidence level20.03 0.87 20.03 0.120 20.03 0.85 20.03 0.119 20.04 0.84 20.03 0.129 +0.04 - 0.83 20.02 0.128 k 0 . 0 5 0.80 20.03 0.134 k0.07 0.80 k 0 . 0 4 0.131 k 0 . 0 5 0.80 k0.03 0.140 b - Slope
tb - Limits for the slope at the 95 per cent confidence level S.
-
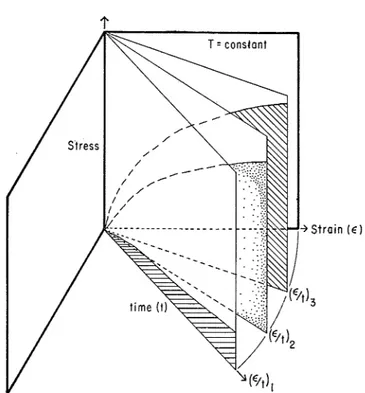
Standard errorFigure 6-Individual tensile curves illustrated in a three-dimensional co-ordinate system
stant and it does not affect the final conclusion. As will be seen, the final conclusion makes no use of the load.
Figures 2 and 3 illustrate the tensile curves ob- tained at - 30 F (-34.4 C ) and 73 F (22.8 C ) , re- spectively. (Results obtained at other temperatures are not illustrated.) Care has been taken in choosing the failure points. If the curves went through a max-
BREAK POINT - INTERMEDIATE POINT c m l m i n i n l m i a c 0.5000 0.1969 E 0.05000 0.01969 G 0.005000 0.001969 H 0.0005000 0.0001969 5.001 I I I I I I I I
I
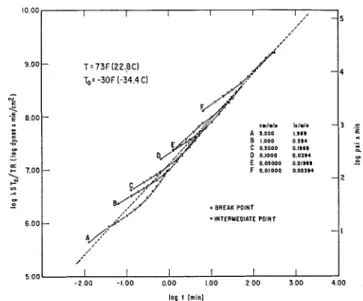
-4.00-3.00 -2.00 -1.00 0.00 1.00 2.00 3.00 4.00 5.00 log t ( m i dFigure 7-Time dependence of "true" stress at
-
3 0 Fimum without the appearance of either a cohesive or adhesive failure, then the maximum load was taken as failure point. In some cases, however, the failure started without an associated drop on the tensile curve. In these cases, the start of the failure was registered. The failure points are illustrated by filled circles in the plots, while the circles indicate readings taken at 5, 10, 15, 20, 25, 40, 60, 80, 120, 160, 200, 2AO
and 300% extensions.
Figures 2 and 3 illustrate the original tensile curves and show that the tensile load increases as the rate of extension increases or the temperature de- creases.
Figures 4 and 5 show the result of reducing the individual tensile curves to unit strain by dividing by the strain rate. The temperature correction was ap- plied using -30 F as reference temperature, and the load was multiplied by the extension ratio. As can be seen from the figures, the individual tensile curves fit the cumulative single curves fairly well. The statistical analysis of the fit is presented in Table 2 for all the temperatures used in the investigation: The table shows that the correlation coefficient is very high. The slope of the cumulative curves decreases slightly as the temperature decreases. It is more signscant, how- ever, that the intercept increases with decreasing tem- perature. As 'ta-the limits for the intercept at the 95% confidence level-indicates, there is no doubt that the confidence limits of the cumulative curves do not over- lap, i.e., they are distinctly different. In other words, the material is characterized at each temperature by a separate cumulative curve.
As the material proved to be temperature de-
cmlmin inlmtn BREAK POINT A 5.000 1.969 0 INTERMEDIATE POINT B 1.000 0 394 c O.SOO0 0.1969 D O.lOO0 0.0394 E O.OS000 0.01969 F O.OlOO0 0.00394 log t ( m i d
MECHANICAL PROPERTIES OF SEALANTS IV
Figure 9-Determination of shift factors
pendent, a time-temperature superposition was at- tempted on the data. The determination of the shift factor, which is a manual operation, is difficult to do on a three-dimensional co-ordinate system. Conse- quently, one must resort to the projection of the read- ings in one of the planes to execute the shifting.
The individual tensile curves obtained at a given temperature form a three-dimensional co-ordinate sys- tem, as illustrated in Figwe 6. The vertical axis repre- sents the stress. the axis cominc toward the reader is time, and the third axis is straiz Each tensile curve is in a separate vertical plane. The system can be com- pared to a book, opened 90°, in which each page con- tains one tensile curve, as each page represents a given strain rate. The projection of the tensile curves in the log-stress vs. log-time plane was used for time- temperature superposition. Figures 7 and 8 represent the projections at -30 F and 73 F, respectively. The projections of the individual tensile curves are indi- cated by letters from A to F. The corresponding rate of extensions are listed in the figure. The best fitting line of each percentage extension level is drawn in. As can be seen, the various extension levels slope toward longer times, indicating a relaxation occurring in the material during tensile extension. The slower
Table 3-Shift Factors (log a ~ ) Based on the Regression Lines of:
4 0 , 6 0 5, 10, 15, 2 0 & 2S0/o 8 0 X 120% Based on the "Universal" Constants
I
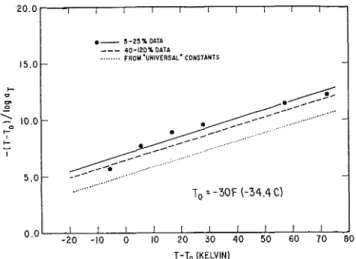
a- 5 - Z S + M T A --- 4 0 - I Z O + O A T A ... F R O M 'UNIVERSAL' CONSTANTS 15.0 O'O -20 -10 0 10 20 30 40 50 60 70 80 T-To (KELVIN)Figure 10-Plot for calculating the WLF constants
the rate of extension, the more relaxation can take place.
The lines obtained at different levels of extension can serve as guidelines for time-temperature super- position. The plots obtained at different temperatures can be shifted along the log-time axis until the re- gression lines of each extension level obtained at dif-
ferent temperatures form a single smooth curve. I t was found that the most reproducible fit can be obtained by using as guidelines for the shift several, but not all, extension levels at a time. Figure 9 illustrates the shifting executed using 5, 10, 15, 20 and 25% exten- sion levels. Table 3 gives the shift factor, log a ~ , ob- tained in Figure 9, together with factors obtained us- ing the regression lines of 40, 60, 80 and 120%. I n the last column the shift factors derived from the "uni- versal" constants are given.
The constants of the W L F equation can be de- termined by rearranging equation ( 2 ) :
T - To C," 1
-
log aT - Clo+
cl,
(T - To)When the left side of equation ( 3 ) is plotted against ( T
-
T o ) , as in Figure 10, the constants can be de- termined from the slope, B, and the intercept, A:I n Figure 10, the points indicated by a symbol are derived from the 5, 10, 15, 20 and 25% data (see T a b k 4 ) . The best fitting line across them is the continuous
Table 4-Constants of the WLF Equation
To = - 3 0 F ( - 3 4 . 4 C ) T, = - 5 0 C
C1° CIB
dimension- CzO dimension- Czg less Kelvin less Kelvin "Universal" constants: 13.59 67.2 17.44 51.6 40, 60, 80 & 120% Data: 13.04 83.1 16.05 67.5 5, 10, 15, 20 & 25% Data: 12.86 89.5 15.57 74.0
DEGREE CENTIGRADE DEGREE CENTIGRADE 5ool -5: -4: -3,O -2: -1: IF 2'3. 3: 4: 5:
,
-60 - 4 0 - 2 0 0 2 0 4 0 6 0 8 0 100 120 DEGREE FAHRENHEITFigure 11 -Load at break vs. temperature
line. The dashed line below this indicates the results based on the 40, 60, 80 and 120% data. The dotted line describes the equation using the "universal" con- stants. The correlation coefficient for the continuous line is 0.974 and 0.978 for the dashed line, with stan- dard errors of 0.608 and 0.554, respectively. Consider- ing the amount of scatter involved in the experiments leading to these data and the fair amount of error in- volved in the manual determination of the shift factor, the experimentally determined lines of Figure 10 are not very far from the curve determined by the "uni- versal" constants. They are, however, distinctly differ- ent from it a t the 95% confidence level, as the lower confidence limit of the. intercept for the continuous line is 5.96 vs. 5.04 for the intercept of the line based on the "universal" constants. (The latter is assumed to be error free.) Because of the distinct difference between the lines, the shift factors experimentally de- termined with the 5, 10, 15, 20 and 25% regression lines will be used.
The glass transition temperature, T,, of the sample used was determined with differential thermal analysis and was found to be -50 C.
The reference temperature, To, of the shifting was chosen a t -30 F (-34.4 C ) . This is the lowest tem- perature one can expect to occur every winter in the Ottawa area and, in many other densely inhabited parts of Canada. I t is a t the minimum winter tempera- ture that the sealant is extended the most and, there- fore, failure can occur if the properties of the sealant4
are not considered in the joint design.
To illustrate the temperature dependence of the occurrence of the break points, the load at break and the extension a t break vs. temperature are plotted in Figures 11 and 12, respectively. The different sym- bols illustrate different rates of extension. The load at break increases as the temperature decreases, and the
STRAIN RATES. <m/min.
.
5.000 0 1.000 1 0.5000 0 O.IOO0.
0.05000 b O.Ol000-
.
/' * 0005000 / 0 \ v 0.001000 4 0.0005000 / o 0 \ '\ I , I DEGREE FAHRENHEITFigure 12-Extension at break vs. temperature
failure points fall within a band, with the higher rates usually reaching higher loads at a given temperature.
Maximum extensibilities reached at different tem- peratures form a smooth curve going through a max- imum at room temperature. The minimum extensibil- ities, however, show a wider scatter.
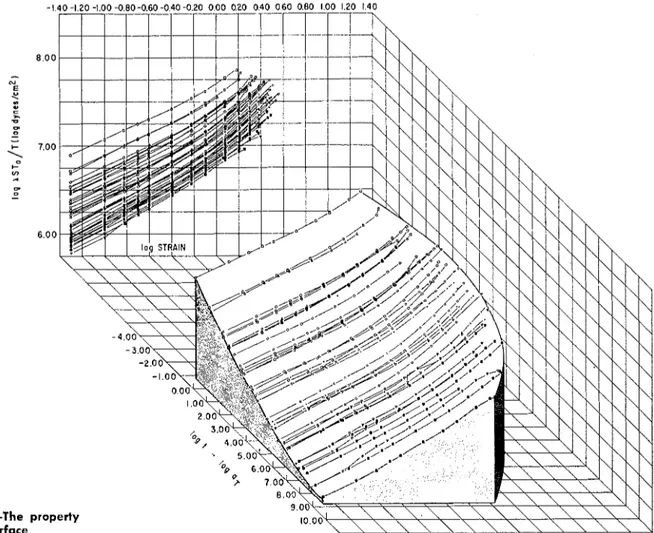
Figures 11 and 12 cannot be used to predict the occurrence of failure on the exterior of a building from laboratory tests. T o do that, one must go back to the three-dimensional co-ordinate system. As the shifting of a number of three-dimensional systems ob- tained a t different temperatures would be rather diffi- cult to illustrate with graphs, an alternative method was chosen. The result is Figure 13, illustrating the property surface thus obtained. The vertical and hori- zontal axes illustrate log-stress and log-strain, respec- tively. The third axis coming toward the reader, is the time axis. Although the plot is not in true per- spective one can see that the dotted lines trace a sur- L
face. Each line is in a stress-strain plane at a single time. I n contrast to these curves, the original stress- strain curves would go diagonally on the surface as if they were on a separate page of an open book, as mentioned earlier. To trace the surface (which al- ready includes time-temperature superposition), one must take the stress vs. time curves of the type illus- trated in Figures 7 and 8. and read the ~ o i n t s of the best fitting iurves at a @;en time. The t h e s were so chosen that each set of readings includes a break point, i.e., readings were taken at each experimentally determined time within which a break point was reached. The curves obtained for every break point at every temperature are illustrated in the upper part of
Figure 13. I n the lower part of the figure, the same curves are shifted along the log-time axis using
Figure 13-The
surface
the shift factors as previously determined, with T o
=
-30 F.The property surface ends in the failure surface at the upper right-hand edge. The projection of these points in the log-strain vs. log-time plane is the most important projection for sealants because it is the strain imposed on the sealant by the design of the building, which leads to failure if the designing is not properly done; load develops in the sealant as a con- sequence of the imposed strain. There is no need to specify the load in the design of the joint, for as long as the sealant maintains the continuity of the joint at a given extension without failure, the load can have any value. The load at failure has its importance, however, for the formulator of the sealant.
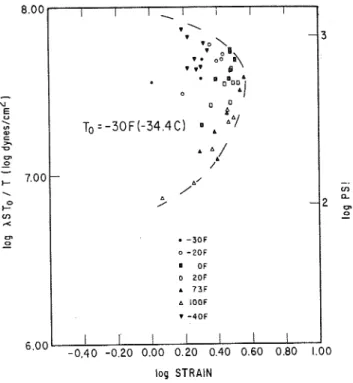
The extensibility is shown in Figure 14 for all temperatures. The different symbols refer to different test temperatures. In Figure 15, the same readings are shifted along the time axis with the amounts of log a~ given in T a b l e 3. The shift factors used were the ones obtained by shifting the 5, 10, 15, 20 and 25% exten- sion data. The reason for the choice is that these fac- tors are smaller than the factors obtained at the higher extensions, or the factors obtained by the "universal" constants. The shift factors being smaller, the predic-
tions based on the shifted data will relate to shorter time periods; therefore, they will stay on the safe side. Figure
15
is the projection of the failure points of Figure 13 in the log-strain vs. log-time plane. This pro- jection illustrates the extensibility of the sealant at -30 F as a function of time. The extension can be read in percentage on the vertical scale of the right hand side and the time in nonlogarithmic units on the upper horizontal scale. The failure points form a broad band. The highest strain readings observed fol- low a smooth line going through a maximum at ap- proximately one to six months. The lower limit is less well defined. According to the data, an extension of about 100% can be maintained without failure at -30 F for about 20 years. This observation from the graph is not supported, however, by all the results produced in the figure. A better and simpler way to evaluate the material would be based on the fact that the maximum is a very flat one. Because of this flat- ness, all the extensibility readings obtained at different times and temperatures can be considered to belong to the same "population." In that case, to characterize the material, one can set a limit. For example, one can stipulate a percentage extensibility figure under which not more than 1% of all data should falL This per--1.00
-1.00 0.00 1.00 2.00 3.00 4.00 5.00 6.00
log t (min)
Figure 14-Strain at break vs. time
centage extensibility can be calculated from the aver- age of the extensibilities of all the data presented in
Figure 15 and its standard deviation. The average is: log-strain = 0.368, with standard deviation of 0.126. The stipulated 1% being the half tail of the probability cui-ve,W9% of all readings will fall above 119% exten- sion at break, calculated as follows:
100
x
antilog (0.368-
2.33x
0.126) = 119y0 (6)The number of observations being fairly high (41), a correction for the "population" is not necessary, as it is negligibly small.
As well as the above conclusions drawn from
Figure 15, the figure also illustrates the practical use- fulness of time-temperature shifting. The performance
M m S H E MONTHS YEARS 1.20 1 I 10 I 1 3 I I 1 : 7 I 1 3 6 1 2 1020 I I l l 1 I !
1.00 -
0.80 - - 600
Figure 15-Strain at break. Shifted data
log STRAIN
Figure 16-Failure envelope
of sealants at six months is critical, for it is in that period that the sealant can reach its most extended state in the yearly cycle. This happens at the lowest temperaure, and prediction from laboratory tests of the performance at six months and minimum winter temperature is important. One can see from the figure that at six months the points experimentally deter- mined are those obtained at 0 F, 20 F, and 73 F. For routine laboratory testing, the tests at 0 F cannot be used, because at this temperature it is the test done at the slowest rate, 0.0005 cm/min, that reaches in this area of time-an uneconomical way of testing. Tests at 20 F are the most suitable from the point of view of the availability of various tensile rates (0.02 to 0.002 in./min or, 0.05 to 0.005 cm/min) to cover the area, but production of this test temperature requires special laboratory equipment that may not be avail- able. If that is the case, laboratory tests at 0.2 in./min (0.5 cm/min) and higher rates executed at room tem- perature can be used for routine testing of this time region. I t should be noted that larger scatter was found in the readings that used rates higher than 1.0 cm/min than in tests done below or at this rate. Whether this was due to human error, slow response of the recorder, or to specimen properties, has not been established. Based on this experience, the author would suggest 1 cm/min and slower rates for routine testing.
Figure 16 illustrates the failure envelope. This, as well as previous plots of the failure points, should be a band comprising the points. The upper limit is well defined; the lower one, however, disappears in the scatter. The failure envelope characterizes the ma- terial independently of time or t e m ~ e r a t u r e . ~
MECHANICAL PROPERTIES OF SEALANTS IV
Klara K. Karpati has been associated with the Division of Building Research of the National Research Council of Canada since 1965. Her field of interest
i s mechanical properties of sealants.
She was previously employed by I.C.I. (England) and Trimetal Paint Co. (Bel- gium). She obtained the licence Speciale en Chimie lndustrielle from the Univer- sity of Brussels and graduated in chem- istry from the University of Sciences of Budapest.
CONCLUSION
A method has been outlined for ~redictinrr the I "
failure of two-part polysulfide sealants under practical conditions from the results of laboratory tensile test- ing. Prediction is possible because analysis of data based on the basic understanding of polymer systems can be applied successfully to the model specimens. The material properties can be characterized by the primary variables: stress, strain, time and temperature. The stress-strain curves reduced to the unit strain rate give a single cumulative curve at each temperature for tests made at various strain rates. As the cumulative curves are different at each temperature, the material properties are represented in a separate three-dimen- sional co-ordinate system at each temperature. By applying time-temperature superposition, a single three-dimensional system can be derived. The shift factors necessary for the time-temperature superposi- tion can b e determined conveniently by manually shifting the log-stress vs. log-time curves until they overlap and form a coiltinuous line for each level of ex- tension. When the
5,
10, 15, 20 and 25% extension levels were used as guidelines for the shifting, smaller shift factors were obtained than at higher percentage levels. The "universal" constants of the W L F equation yielded greater factors than either of the above cases. The smallest factors were used for shifting because they provide the safest prediction of performance and with their help the property surface, characterizing the sealant, was derived for -30 F reference tempera- ture.A three-dimensional co-ordinate system is, how- ever, too complex to characterize the material for practical use. Various steps were taken, therefore, to derive a simpler relationship. As a first step, the pro- jection of the failure points of the three-dimensional system into the log-strain vs. log-time plane was de- rived. This projection indicated which laboratory tests were adequate for the characterization of the critical conditions occurring outdoors. The critical conditions include the lowest winter temperature and the time to reach it (about six months in the first outdoor cycle). As could be concluded from the projection, the temperature range between 20 and 73 F can be used for testing for the critical conditions.
Because the projected failure points are on a band with only a flat maximum, a further simplification of the characterization of material properties can be made. As a result, it is proposed that two-part poly- sulfide sealants should be tested at a chosen artificial aging, using the specimens described, by subjecting them to tensile tests at various rates from 0.4 to 0.004 in./min (1 to 0.01 cmlmin) at room temperature and at the minimum winter temperature occurring in the geographical area considered for use of the sealant. Any separation of approximately ?6 in. (0.3 cm) ad- vancing in any direction and occurring either co- hesively or adhesively should be taken as failure. As this point is not always obvious from the tensile curve, the appearance of the specimen during the tensile test should be checked at regular intervals of at least
5%
extensions. The logarithm of the strains at break ob- tained at the two temperatures should be pooled and the average, with its standard deviation, should be calculated. The values thus obtained should be such that only 1% of the "population" of test data should be smaller than a stipulated percentage extension: the critical single value characterizing the material. From the number of tests presented and derived with a single commercial product there was a 119% extension. The method of using a single characterizing value is given; but to stipulate the actual value with more ac- curacy would require further work. It is proposed that all two-part polysulfide sealants available on the mar- ket should be tested according to the above procedure and a single characteristic value should be estab- lished covering all of them. The test method should be supplemented by a DTA test to ensure a sufficient- ly low glass transition temperature.
ACKNOWLEDGMENT
The author wishes to thank R. C. Seeley for his contribution of experimental work and L. R. Dubois for the sample preparation. This paper is a contribu- tion of the Division of Building Research, National Research Council of Canada, and is published with the approval of the Director of the Division.
+
References
(1) Karpati, K. K., "Mechanical Properties of Sealants: 1. Be- havior of Silicone Sealants as a Function of Temperature," JOURNAL OF PAINT TECHNOLOGY, 44, No. 565, 55 (1972). Karpati, K. K., "Mechanical Properties of Sealants: 11. Be- havior of Silicone Sealants as a Function of Rate of Move- ment," JOURNAL OF PAINT TECHNOLOGY, 44, No. 569, 58
(1972).
Karpati, K. K., "Mechanical Properties of Sealants: 111. Per- formance Testing of Silicone Sealants," JOURNAL O F PAINT TECHNOLOGY, 44, No. 571, 75 (1972).
12) Smith. Thor L.. T. Polvtner Science, xx. 89 (1956). i3j ~ i l l i a r n s , M. L.,~ l a n d e l , R . F., and ~ e r r ~ , ' J . D., J. Am.
C h e m . Soc., LXXVZZ, 3701 (1955).
(4) Karpati, K . I(., "Guide for Sealed Joint Design." NRCC
13025.
(5) Neville, A. M. and Kennedy, J. B., "Basic Statistical Meth- ods." International Textbook Co., 305 (1964)
.
(6) Smith, T h o r L. and Stedry, P. J., Rubber Chemistry and
T e c h n o l o g y , XXVZZ, 1 (1958).
Reprinted from the May I973 issue of the JOURNAL O F P A I N T TECHNOLOGY Volume 45; Number 580; Pages 49-57
Copyright 1973 by the Federation of Sodietics for Paint Technology, Philadelphia, Pennsylvania, U . S. A.
This publication is being distributed by the Division of Building Research of the National Research Council of Canada. I t should not be reproduced in whole or in part without permission of the original publisher. The Division would be glad to be of assistance in obtaining such permission.
Publications of the Division may be obtained by mailing the ap- propriate remittance ( a Bank, Express, or Post Office Money Order, or a cheque, made payable to the Receiver General of Canada, credit NRC) to the National Research Council of Canada, Ottawa, K1A OR6. Stamps are not acceptable.
A list of all publications of the Division is available and may be obtained from the Publications Section, Division of Building Re- search, National Research Council of Canada, Ottawa. KIA OR6.