Competition, Innovation, and Product Exit
John M. de Figueiredo and Margaret K. Kyle Massachusetts Institute of Technology*
19 March 2001
Abstract
Why do products exit markets? This paper integrates rationale for product exit from a number of different literatures and compares the statistical and substantive effect of these explanations. We use a novel dataset covering every product introduced into the desktop laser printer industry since its inception. Using hedonic models, hazard rate models, and count models, this study generates three main findings. First, innovation does not drive products out of market per se. Managers do not pull products off the market when they innovate. Rather they seem to keep the incumbent products on the market and add the newer, more innovative products to the marketplace that have longer expected lives. Second, competition has a large impact on driving products out of markets. These non-innovative products remain in the product portfolios of companies until competition drive the products out of markets, not managerial decisions. Third, holding other factors constant, scale and learning have a marginal statistical and substantive effect on product exit.
* Sloan School of Management and Department of Economics, respectively (MIT E52-545, 50 Memorial Drive, Cambridge, MA 02142-1347, 617-258-7253, [email protected] or [email protected]; Work reported was supported (in part) by the MIT Center for Innovation in Product Development under NSF Cooperative Agreement Number EEC-9529140. We would like to thank Ron Adner, Bob Gibbons, Shane Greenstein, Ralph Katz, Dan Levinthal, Jesper Sorensen, Scott Stern, Mary Tripsas, and Whitney Newey for very helpful comments. We would like to thank Jack Nickerson for assistance with the data. All errors are the sole responsibility of the authors.
Competition, Innovation, and Product Exit John M. de Figueiredo and Margaret K. Kyle
Massachusetts Institute of Technology 19 March 2001
I. INTRODUCTION
Why do products exit markets? The short answer is that the products are no longer profitable. But what makes products no longer profitable? The academic literature puts forth a number of reasons why products that were once profitable are no longer so. The first stream of literature argues that as time progresses, an increasing number of firms and products enter the market, thus pushing down prices. A firm that was once alone in a market or market niche encounters many competitors that erode the incumbent’s market power, and depresses price and profits (Stavins 1995, Carroll 1985). A second stream of literature argues that a firm’s products prey on its other products and result in cannibalization. A multi-product firm must thus optimize its portfolio to minimize cannibalization. This means exiting products that do not enhance the value of the portfolio as a whole (Greenstein and Wade 1998, Schmalensee 1987). Another vein of literature examines fixed cost. If there are significant fixed costs, then scale is important in order to distribute fixed costs across more units. Products belonging to small firms will fail in this environment because their costs cannot become competitive (Stigler 1968). Yet another literature argues that it is not fixed costs that doom products, but improvements in marginal costs. Firms learn or acquire capabilities that can allow them to consistently improve the cost structure of their products. Firms that are unable to dynamically improve their learning or capabilities over time will find their products uncompetitive (Klepper 1997, Teece et al 1997, Jovanovic and MacDonald 1994, Jovanovic and Lach 1989, Levinthal 1997). This literature is a
superset of a related literature on innovation and the product life cycle. This work in innovation argues that firms will invest in process innovation to push down costs. Firms that do not will find themselves and their products at a distinct disadvantage (Abernathy and Utterback 1978, Klepper 1997). In this sense it is similar to the capabilities literature. Yet, another aspect to the product life cycle literature is that firms invest in product innovation in order to enhance the quality, characteristics, and commercialization potential of products. If firms do not, their products will be weeded out by more innovative products (Christensen 1997, Gort and Klepper 1982).
While each of these disparate yet related literatures has demonstrated its relevance and importance to scholars, there has not been an integrative study that compares these factors and rigorously examines product exit. To date, nearly every single study has studied firm exit (e.g. Hannan and Carroll 1993, Henderson 1995, Christensen et al 1998, Jovanovic 1982, Tushman and Anderson 1986, Ghemawat and Nalebuff 1985, Schumpeter 1942). However, the theories that explain firm exit have their micro-foundations in product markets and strategies. Hence, to gain a deeper understanding into the firm survival condition, we must understand what is happening at the product level, and how choices at the firm level affect product entry, exit, and profitability outcomes.1 To this end, this study asks what is the most important factor for product exit—managerial decision-making or the outside environment? It is also the first study to
examine product evolution from the inception of the industry.
So why do products exit markets? This paper integrates the predictions about product exit from a number of different literatures and compares the statistical and substantive effect of these explanations. We use a novel dataset covering every product introduced into the desktop laser printer industry since its inception. Using rigorous statistical methods, this study has three main
answers to this question. First, innovation does not drive products out of markets per se. Managers do not pull products off the market when they innovate. Rather, they seem keep the incumbent products on the market and add the newer, more innovative products to the
marketplace with longer expected lives. Second, competition has a large impact on weeding products from the market. These non-innovative products remain in the product portfolios of companies until competition drives the products out of markets, not managerial decisions. Third, holding other factors constant, scale and learning have a marginal statistical and substantive effect on product exit. Overall, the results in this paper are consistent with literature on product proliferation. However, instead of a strictly horizontal differentiation story (Schmalensee 1987, Judd 1985), there is product proliferation on the innovative vertical differentiation dimension as well (Shaked and Sutton 1987).
In the next section we state more concretely the hypotheses of the paper, and simplify and categorize the literature so that competing theories can be tested. In the third section of this paper, we describe the desktop laser printer industry, and explain why it is a good arena in which to compare theories empirically. We describe our data, method, and hypothesis
operationalization in Section IV. In Section V, we offer our empirical results. In Section VI, we describe some extensions, and we conclude in Section VII.
II. WHY DO PRODUCTS EXIT MARKETS?
Product exit receives prominent attention in the theoretical literature, yet is often overlooked in the empirical literature. One reason is that product population data is extremely difficult to obtain. Second, most theories assume single product firms. Yet, if we are to understand firm behavior, we must understand what happens to their product portfolios.
In this paper, we bring together, simplify, and integrate a number of streams of literatures to explain why products exit markets. Are some products so unattractive that managers choose to discontinue them, or do markets and technology drive them out?
The first reason that products exit markets is because price competition is too fierce, for a given cost. A product enters under the expectation of achieving and maintaining a price point. However, if competitors enter the market space, the market power that the initial product enjoyed disappears, and the product becomes less profitable. Thus, we expect to see higher product exit rates the fiercer is competition.
H1: Greater competition will result in higher product exit.
A second reason products may exit markets is because of a high cost position. There are two types of costs that can be examined are marginal cost and allocated fixed costs. The strategy and innovation literature focus on two cost drivers in high technology industries: economies of scale and learning. The fixed cost per unit is lowered by either reducing the overall fixed costs, or by increasing the number of units over which the fixed cost is allocated. Some fixed costs can be allocated across multiple products (such as a factory that makes multiple products), while other fixed costs can be allocated across each unit of the brand (brand advertising). Thus, in a given industry with substantial fixed costs, we expect to see firms with higher market share obtaining a better cost position, and therefore having lower per unit cost for their products. This means that firms with higher market share will have products with lower probability of exit for cost reasons.
There is a second effect of learning. As firms increase production, over time, they learn how to make products at lower cost. The learning curve, a widely accepted concept in
management, favors firms who have had high volume output for a long period of time.
H2a: There will be lower product exit rates for firms with higher market share.
H2b: There will be lower product exit rates for firms with higher cumulative production over time.
A third reason products exit markets is because of product portfolio concerns. That is, managers maximize the profits of their entire product portfolio, not of individual products. In a multi-product firm, a product that does not increase the profitability of the entire portfolio will be pulled from the market.2 We see this effect most prominently stated in the literature on
cannibalization, where one product can cannibalize sales of another product for a given firm. If this is the case, the firm is often better off withdrawing one of the products. Thus, the higher the probability of cannibalization, the higher the probability of product exit.
H3: Product exit rates will be higher the more products a firm has in a given a product niche.
A final cause of product exit is product innovation. There are two main effects we study here. First, we would expect that more innovative products survive longer in the marketplace relative to their less innovative counterparts, controlling for price and other factors. While this first effect is straightforward, the second effect of product innovation on the probability of
2
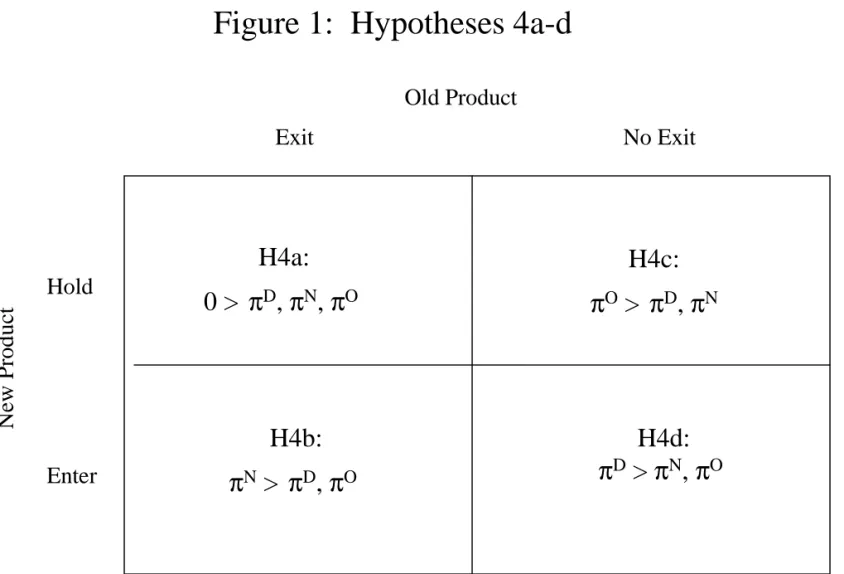
product exit is not obvious. A more innovative product may enter, which may result in an older product exiting or not. We consider four cases for the innovative product and incumbent
product: (H4a) hold, exit; (H4b) enter, exit; (H4c) hold, no exit; and (H4d) enter, no exit. In the first case, a firm may have a more innovative product, but chooses to wait to enter it.
Meanwhile, the firm exits the current product. We think this is not interesting (nor an equilibrium) or extremely unlikely, because it assumes that the firm is better off exiting the current product and having no products in the market, controlling for competition, cost, price, and current portfolio. This case should not happen provided at least one product is profitable, because the firm would be better off with some kind of profitable product in the market than no product in the market. The second case is one where the firm exits the incumbent product, and replaces it with a more innovative product. This is because the firm believes that the
replacement product will be more profitable than the incumbent product individually, or both products together in the market. The third case is one in which the firm chooses to innovate, but waits to introduce the new product on the market. This is because the old product is more profitable than the new product and more profitable than having both products in the market together. The final case is where the firm introduces the innovative product, but does not withdraw the incumbent product because the profit generated from having both products in the market exceeds the profits from any individual product in the market alone.
Theories in the literature support each of these different yet mutually exclusive cases. We leave it as an empirical exercise to identify which actually occurs. We codify these hypotheses in Figure 1, and in the hypotheses below.
H4a-d: Firms will choose product entry-exit strategies to maximize the value of the portfolio. (see Figure 1)
H4e: More innovative products will have lower product exit rates.
III. THE LASER PRINTER INDUSTRY
We have chosen the desktop laser printer industry in which to examine these hypotheses for a number of reasons. First, the characteristics of laser printers are constantly improving, buffeted by the forces of innovation, and can be easily observed. Second, the printer industry has seen numerous product entries and exit since its inception in 1984, and we are able to track each one with a comprehensive dataset. Third, the competitive environment varies across the product space, and therefore we can account for competitive and price effects. Fourth, there are heterogeneous firms of different sizes. Finally, and perhaps most importantly, the laser printer industry is like a number of other high technology industries, such as personal and mainframe computers, disk drives, fax machines, retail electronics, and the like. The products are
differentiated; there is an innovation frontier; there is an important mass market; and product and firm turnover is prevalent. Thus the insights from this study we believe will be applicable to broad sectors of the economy. We discuss these points further below.
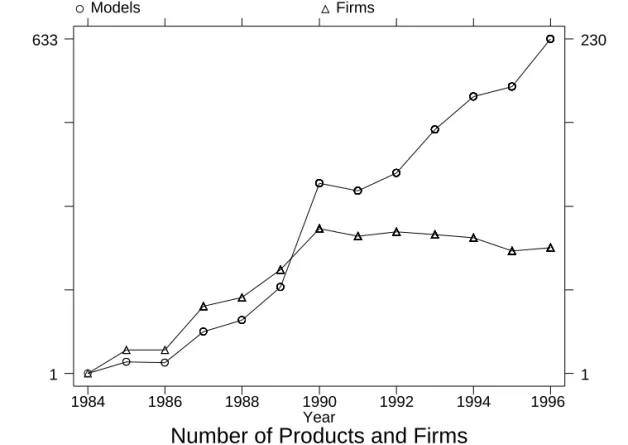
As the personal computer market expanded in 1980s, so too did the market for the desktop printers. The first desktop laser printer (available on the retail market) was introduced by Hewlett Packard in 1984. By the end of 1985, 17 firms had introduced over 23 models of printers. Figure 2 illustrates the number of firms and models in the industry from the beginning of the industry in 1984 to 1996. At its peak in 1990, the industry had 100 firms. Since that time, the number of firms has fallen off to 87.
Three types of firms populate the industry. There is a large number of relatively big, diversified firms such as Ricoh, IBM, Hewlett Packard, Canon, and Xerox. There is also a small number of medium sized firms that specialize in multiple printer technologies, such as Lexmark, Kyocera, Genicom, and Kentek. Finally, there are over 100 very small “fringe” firms, which produce few printer models, ship very few units, and tend to appear in the industry only briefly. Hewlett Packard is the dominant firm in the industry, and has maintained between 45% and 65% market share for most of the industry’s history. Table 1 documents the concentration ratios of the top 1, 5, and 10 firms in the industry (noted as the C1, C5, and C10 ratios, respectively).3 If a firm has appeared in the sample in the C10 ratio, then we call that firm as a dominant firm in that year. All other firms are considered fringe firms in that year. Note that dominant firms account for between 70% and 87% of the market share in a given year, but account for only 30-45% of the product models introduced.
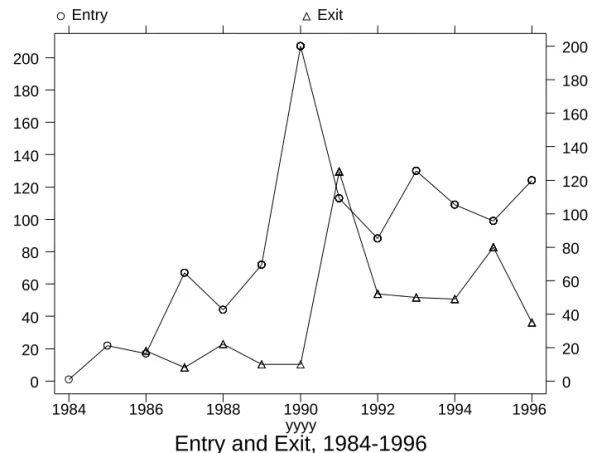
At the product level, there has been a large amount of product entry and exit by year. The number of products on the market has generally been increasing over time, with a peak at 633 product models in 1996. In Figure 3, we illustrate the amount of product entry and exit by year, and show that product entry rates peaked in 1990. Figure 2 and Figure 3 together suggest that a smaller number of firms are offering more diversified product portfolios. The average number of products per firm is 8.8 in 1996, up from 1.8 in 1988.4 We explore this result further in the econometric analyses.
3
The quantity data we possess seem to be sufficiently good to make determinations about the largest firms in the industry. Unfortunately, the coverage of fringe firms and individual models is poor.
4
In defining the industry, we appealed to the data and to industry experts and trade journals. These sources consistently define the desktop laser printer industry as laser printers that print 0-12 PPM, can be attached to a personal computer, and are small enough to fit on a desk. This industry definition has remained constant over the time period. When we analyzed our data, we excluded printers that were particularly fast, exceeded certain weight and size measures, or were not designed to communicate with any type of personal computer. Our statistical analyses are robust to small definitional changes.
Although printers can be characterized on a number of dimensions, our research has found that two most common measures of printer performance are speed, measured by pages per minute (PPM), and resolution, measured by dots per inch (DPI).
We apply the vendors’ definition in determining what constitutes a product. On the surface, this definition may seem problematic. Vendors may have incentives to put many
different product model numbers on the same printer in order to proliferate models in the product space. Alternatively, they may make very small changes to a printer and market it as a different product. We have examined this possibility and found, with the exception of the addition of Postscript features (which is a substantial enhancement), printers with different model numbers generally do have different features. In addition, unlike some product markets, firms do not change printer attributes once the product has been introduced. Rather, they introduce new products.
IV. DATA AND METHOD
A. SOURCE OF THE DATA
The information on laser printer characteristics, entry, and exit come from a variety of sources. The primary source is Dataquest’s SpecCheck analysis of page printers. Dataquest follows each manufacturer’s products and records a variety of product characteristics, including ship date, speed, resolution, and other features. We found the data were incomplete for many models. Therefore, we supplemented our data with information from trade journals, private analysts’ reports, and general industry data provided to us by a private consulting firm. We believe the dataset, which covers the industry from its inception in 1984 to 1996, is the most comprehensive available on the desktop laser printer industry. Over this 13-year period, we are
able to record 633 printer introductions covering nearly 2835 printer-year observations. We restrict the analysis to data from 1986-1996, because too few models were introduced in the early years of the industry to permit identification of the econometric models. Though we have
attempted to be as thorough as possible, there remain some printers for which we cannot identify all of the independent variables. These have been dropped from the analysis. All data are recorded annually.
To identify patterns of innovation we rely on patent data. We have used the MicroPatent database to track patent application dates for patents granted in the industry. We confine our analysis to three four patent classes: 271, 355, 359, and 395. Our interviews with industry experts have suggested that these four patent classes contain most of the patents that would apply to the laser printer.5
B. PATTERNS IN THE DATA
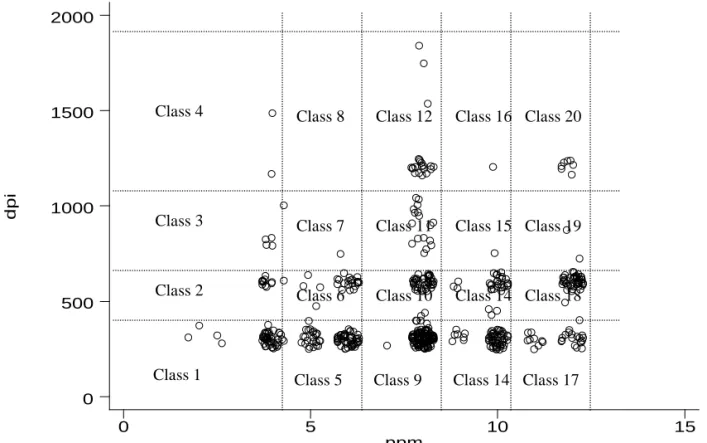
We begin by examining patterns in the data to describe the industry. We consider two dimensions of the product space: speed, measured as the number of pages per minute (PPM), and resolution, measured as the number of dots per inch (DPI). Printers are bunched tightly in groups in the performance space. For example, there are many printers that are 4PPM and 600 DPI. There are a few at 5PPM and 600 DPI, and then there are many at 6PPM and 600 DPI. Figure 4 presents our categorization of 20 discrete product classes (or niches) in terms of these two characteristics, based on the clear grouping of printers. In doing this, we are able to measure the competitive effect of products that are proximate in DPI-PPM space.
5 Given the size of some of the firms (such as IBM, for example), it is also likely that some firms might have patents that cover products other than laser printers. To the extent this is true, it would create noise in the measure, and thus bias the coefficient to zero. Nevertheless, it would likely still be a good measure of innovativeness in imaging technology, which would likely be a good measure of the capability in this domain.
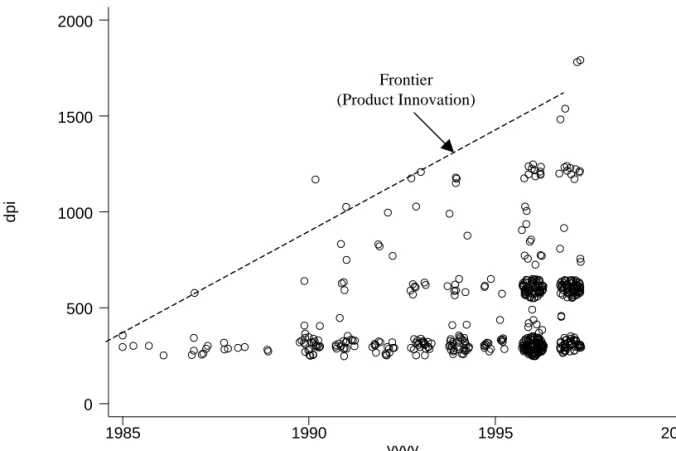
We turn to an analysis of the dynamics of the industry. Figure 5 offers a scatterplot graph where each circle is a printer model. The x-axis is the year, and the y-axis is DPI. Note that over time, newer printers have higher resolution. This is what we will call a single-edged product innovation frontier, on which firms are pushing the envelope on resolution. This is akin to the findings of most studies that examine product improvement (e.g. Christensen 1997, Henderson 1995, Greenstein and Wade 1998).
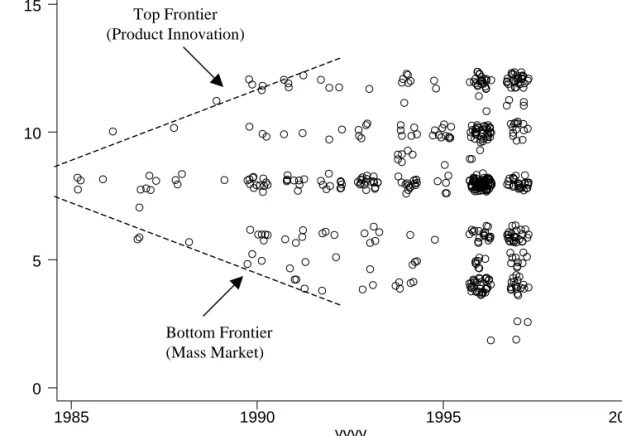
Figure 6 shows the same type of graph for printer speed (PPM). In this time series, we see a different pattern. During this time period, and especially in 1985-1993, firms introduced printers that were faster as well as printers that were slower than those introduced in 1984, the first year the product was developed. The top frontier of faster printers is as one would expect. Namely, firms increase the speed of printers through product innovation. However, the bottom frontier (or double edged frontier) is not found in other academic studies, but likely exists in many industries. Why do we see this?
From our investigation of the industry, it seems that this second frontier is driven by the desire of the manufacturer to reach the mass market.6 To do this, firms must find ways to
produce inexpensive products that are attractive to unsophisticated consumers, yet economical to produce. To achieve this outcome firms engage in a number of activities. First, they eliminate certain product features found on higher end models. Second, they change product design and manufacturing techniques, to be able to produce the printer at lower cost. It is not just process innovation that drives the costs of these printers, but product innovation as well—learning how to design a printer that consumers demand, at a much lower cost. Thus products on the bottom frontier, as well as those as on the top frontier, are the most innovative in this respect. This is discussed further below.
C. VARIABLE DEFINITIONS
We define a product exit as the first year that the product drops out of the dataset. This means that none of the sources reports the printer is being shipped to retailers from the manufacturers, although it may still be available in some retail outlets from inventory. If any one of the sources reports the printer is still being shipped, we record it as still on the market.
One alternative measure of product exit is to register an exit when product sales have ceased. We have collected the best data available from a private company on the quantity of models shipped by manufacturers for seven years (1990-1996), and we found they are incomplete and biased in favor of popular models.7 Our analysis confirms that the data have poor coverage or do not record units sold for low volume models or for models of smaller vendors. We know of no source of data that tracks the quantity over the entire time period for truly all models at the model level. These data do seem to be realistic at the aggregate sales level for individual product niches and for large firms, but its precision may still be suspect. As extensions to the main regressions, we re-estimate our models using the quantity data in Section VI.
The right-hand-side variables are grouped into four categories, and are defined in Table 2. The first category of variable is the product characteristic variables. These include variables like MODEL AGE, DPI, and PPM. The second set of variables measure firm characteristics, such as DOMINANT FIRM, OWN ALL MODELS, PATENTS, and FIRM AWARD. A third set of variables measure the market structure, namely TOTAL MODELS, SAME NICHE, and
6
This double-edged frontier could be driven by consumers, some of whom value speed more than others. 7
SAME DPI/PPM. A final set of variables measures other factors such as the impact of complements and substitutes.
The descriptive statistics are found in Table 3. These statistics provide a rich description of the data. The average product stays on the market for four years, and costs almost $2300. The most prevalent standard is HP-PCL, in 86% of printers, followed by Postscript (a proprietary Adobe standard) in 55% of printers. Although the average printer has increased its resolution, the average speed of the printers has remained constant from the beginning of the industry, consistent with our earlier discussion on the two-edged frontier of innovation. In addition, the average number of products in a given niche is 25.
As a preliminary step in our statistical analysis, we assessed the value of various product features, so we could see if products with valuable features survive longer in the marketplace. In order to measure value, we ran a simple hedonic model. The results are in Table 4. In this model we see that quality adjusted list prices have been dropping at about 10% per year; today, quality adjusted prices are about 12% of their 1986 levels. The regression shows that HP, instead of commanding a brand name premium, actually receives a 14% list price discount relative to other firms, but this not statistically significant.8 The hedonic model also calculates the imputed value of each type of feature. While each additional PPM increases the value of the printer by 7%, each 1% increase in LN(DPI) decreases the value by 30%. This is likely an artifact of the competitive dynamics in the industry, which we discuss later. HP-PCL standards adoption tends to decrease the price of the printer by 11% relative to Postscript. Firm effects are rarely individually statistically significant, and are not jointly significant.
8 Kyle and de Figueiredo (2000) find that dominant firms on the whole had lower prices, but they also entered classes later. When this late entry is accounted for, it seems dominant latecomers charge higher prices than fringe firms that enter with a similar delay. Therefore one explanation for the finding that dominant firms’ products are
D. METHOD
We use an exponential hazard rate specification to examine the determinants of product exit over the product life cycle. The flexibility of this method in accounting for censoring, as well as time variant and time invariant independent variables, makes it attractive to study product failure.
In this specification, the individual model is the unit of analysis. The likelihood function for any given observation, i, can be written as:
φ µ ( )] )[ (t t G Li = i i i
where )Gi(t is the survivor function, µi(t)is the hazard rate, φis a variable that is one for uncensored cases and zero otherwise, and t is the number of periods that product i is in thei
market (Tuma and Hannan 1984). We begin by assuming a constant hazard rate of µ(t)=γ (the exponential distribution). The survivor function is then G(t)=exp[−γt]. The following
specification is used:
where µ(t)is the instantaneous hazard rate for a system at time t and X(t) is a vector of time-varying independent variables. Each exp[X(t)α]can be thought of as multipliers of the hazard rate, and α can be estimated using maximum likelihood techniques (Carroll 1983, Tuma and Hannan 1984). Because we have data from the beginning of the industry, left censoring is not a
less expensive is that fringe products are the most advanced and first to market, while dominant firms follow and enter at lower prices than existing fringe products.
)] ( ) ( exp[ ) (t X t α t µ =
problem. We omit all observations for products that were introduced before 1986 (the first year of the econometrics). The estimation procedure accounts for right censoring.9
E. OPERATIONALIZING THE HYPOTHESES IN THE LASER PRINTER INDUSTRY If we are to understand the micro-foundations of firm behavior, we must test explicit predictions of the theory on why products exit. In particular, is exit due to market conditions (competition from the products of other firms) or managerial choice (competition from the firm’s own products)? Given the four hypotheses stated earlier, we expect to see certain coefficients on the independent variables. We describe the effects here and summarize them in Table 5. The first hypothesis predicts we will see higher product exit rates the higher competition. This suggests that the more product models in the industry, and in the niche, the higher the hazard rate. Thus we expect to see positive coefficients on TOTAL MODELS and SAME NICHE. If there is competition from neighboring niches, we would expect to see SAME PPM and SAME DPI also to have positive coefficients.
The second hypothesis predicts that firms with a lower cost position will have lower probability of product exit. We therefore expect negative coefficients on the variables that measure firm size. Thus DOMINANT FIRM should have a negative coefficient if economies of scale are being exploited. We expect CUMULATIVE DOMINANCE to have a negative
coefficient if learning takes place, as some theories suggest is important. DOMINANT FIRM measures whether the firm has one of the top ten market shares in the industry in a give year.
9
Unfortunately, we do not have the sufficiently detailed price and quantity data to estimate consumer demand at this time. Indeed, our analysis here is not structural. At this early stage in our data collection and analysis we feel it appropriate to rely on reduced form for analysis. Patterns in the data have yet to be established statistically, and structural estimations that are sensitive to specification error and measurement error are likely to pose challenges for data and interpretation. However, we do believe that the development of structural models that are tailored to understanding the demand and cost structures might be a useful path to follow in the future.
Fixed costs spread out over many units (as opposed to few) will result in lower costs per unit and higher survival rates. CUMULATIVE DOMINANCE measures the number of years the firm has been a top ten producer. The literature on the learning curve has generally considered learning to be an increasing function in cumulative output. Thus increased cumulative output is expected to increase learning, decrease unit costs, and result in higher survival rates.
The third hypothesis predicts a product portfolio that cannibalizes the firm’s other products is likely to result in higher product exit rates. This means products that have many same-firm products in the same niche are likely to have a higher probability of product exit. Thus, the coefficients on OWN NICHE MODELS should be positive if the hypothesis is true.
The innovation hypothesis is complex and multipart. If managers take less innovative products off the market before they withdraw more innovative products, as in the traditional model, we should see negative coefficients on PPM and DPI. However, as noted earlier, innovative products will be on both frontiers in the PPM space. Thus the relationship between survival and PPM in this industry (and industries like it) will be nonlinear and nonmonotonic. We expect to see greater survival rates on both frontiers. PPM should have a positive coefficient and PPM-squared should have a negative coefficient if both frontiers have higher survival prospects.10
As a second measure of innovative ability of the firm we use PATENTS. Patents are frequently used in the literature to measure innovative activity (e.g. Silverman 1998, Hoang et al 1999). We have no strong priors about the way firms behave. However, we hope to narrow the
10 Note that many discussions of the product “frontier” allude to this top frontier (Christensen 1997). However, there are very few papers that consider the bottom frontier. de Figueiredo and Teece (1996) do consider a dual frontiered industry, but not in the same way as this paper.
possibilities. If H4a or H4b is true, we should see a positive coefficient on PATENTS; if H4c or H4d is true, we should see a negative or zero coefficient.
Table 5 summarizes the predictions and tests of the hypotheses we have generated from the literature. In addition, we can not only test an integrative theory of product exit examining product-level data, but we can also compare the magnitude of these four main causes of product exit using these methods. While theory does not rule out the possibility that all four effects might be at work , the relative magnitude of these effects has not been systematically examined in a single setting. Our methods allow a comparison.
We also include a number of control variables. In this industry, there are some printers that are from an original equipment manufacturer (OEM) and then rebranded. That is, printers are manufactured by one firm and then just relabeled by another firm. We have some data on rebranding in the industry, and include a variable REBRAND to control for these kinds of printers. Second, some manufacturers of laser printers are backward integrated into laser engine manufacturing. This backward integration may affect their behavior in the downstream printer market. We include a dummy variable, ENGINE MANUFACTURER, to control for such firms. Third, we are concerned about other observed product life cycle effects and outside innovations and markets. We include a time trend variable, ink jet printer prices, and personal computer (PC) sales data by year. Finally, there may be unobserved quality in the products that drive decisions about whether to maintain a product in the market or retire it. We include three variables that proxy for quality. The first two, MODEL AWARD and FIRM AWARD, are designed to control not only for “free marketing”, but also for quality that the researcher today cannot observe, but experts in the field could assess at the time. The last variable, HEDONIC RESIDUAL, is the residual from the hedonic price equation, and is the difference between the
product’s predicted and actual prices. . A high price, for example, could indicate a high cost structure, or unobserved quality that merits a price premium (Stavins 1995).
V. RESULTS
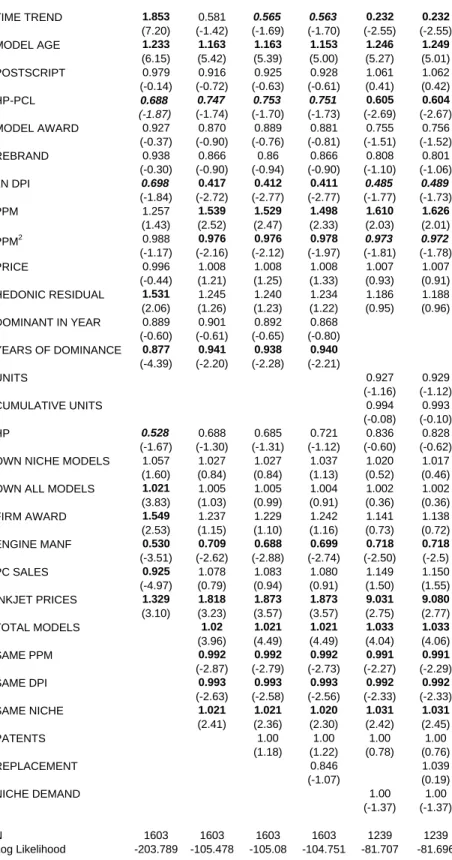
We present six models in Table 6. The first number next to each variable name is the hazard ratio (or multiplier of the hazard rate). A value of less than one indicates that an increase in the variable lowers the hazard rate; a value of more than one indicates that an increase in the variable raises the hazard rate. (In the remainder of the paper, we will sometimes refer the multipliers less than one as “negative coefficients”, and multipliers greater than one as “positive coefficients.”) The asymptotic t-statistics are presented in parentheses below the coefficient estimate. The significance is shown for two-tailed t-tests at the 95% and 90% significance levels.
Model 1 presents the data with the variables related to age (MODEL AGE, TIME TREND), product characteristics (POSTSCRIPT, HP-PCL, MODEL AWARD, DPI, PPM, PPM-squared, PRICE), and firm characteristics (FIRM AWARD, OWN ALL MODELS, OWN NICHE MODELS). Model 2 adds the market structure variables. In Model 3, we include the additional innovation variables. Model 4 adds REPLACEMENT, a variable is equal to 1 if the firm entered a product into the same product niche at the same time it exited a product and 0 otherwise. Given that the entry decision is probably endogenous to the exit decision, we include this specification cautiously, mainly as a discussion point, rather than to provide any structural interpretation of the relationship between entry and exit. Unfortunately, hazard rate models that allow for an endogenous binary variable on the right hand side have not yet been fully
Across the four models, the coefficient estimates are remarkably stable in both their magnitude and statistical significance. A log likelihood ratio test indicates Models 3 and 4 have equivalent explanatory power at the 95% level as Model 2. Model 2 outperforms Model 1. We also see from this analysis the coefficient on many variables, that are statistically significant in Model 1, such as DOMINANT IN YEAR, HP, and OWN NICHE MODELS, change sign or lose their significance once we control for the market competition and innovation explanations for product exit in Models 2-4.
We can now turn to understanding the performance of the four theories in explaining product exit. The first hypothesis predicts competition drives products out of markets. We do find very strong evidence for this hypothesis. The multipliers on both TOTAL and SAME NICHE are greater than 1 and statistically significant. These results suggest that each additional competing product on the market results in a 2% greater probability of exit, and each additional product in the same niche increases the probability of exit by another 2%. Given that on average there are 25 product models in a given niche, the effect of this variable could be large in crowded niches. This is consistent with H1, and its magnitude is relatively large, given the large number of products on the market. Neighboring product niches (SAME PPM, SAME DPI) do not increase the probability of exit, and actually decrease the probability of focal product exit by 0.7% to 0.9%. This interesting result might be because neighboring niches don’t compete with focal niches, but advertising externalities accrue to products in the same speed and resolution niches. Alternatively, the effect of neighboring competition may not be separately identified from total and same niche measures.
The second hypothesis examines whether firms with lower cost position are more likely to have their products survive longer on the market. We bifurcated this test into two parts:
economies of scale and learning. In no model is the coefficient on DOMINANT FIRM
statistically significant, suggesting dominant firms do not have an advantage in product survival rates per se. We are unable to validate hypothesis H2a: if economies of scale are present, they are not reflected in lower hazard rates. This result is stable even including REBRAND, a variable that controls for products that are merely “re-badged.” However, firms that have been dominant for a number of years do have longer-lived products, consistent with the learning hypothesis (H2b). For every additional year that a firm has been a dominant firm, they enjoy a 6% lower hazard rate for their products. We further refine this result in next section, and illustrate its lack of robustness with better measures.
The third hypothesis centers on cannibalization. It predicts that products with many competitors in the same niche manufactured by the same firm have higher probability of exit. The hazard ratio of OWN NICHE MODELS is greater than one, implying an increase in the probability that a given product exits by 2-4%, but is not statistically significant in any specification. .
The final hypothesis concerns innovation. Do more innovative products last on the market longer, or do the forces of creative destruction drive high turnover? As we expect in high technology industries, older products have higher hazard rates. Examining the PPM, PPM2, and DPI variable coefficients, we see that products on frontiers, whether the top frontier or lower frontier, have better survival prospects than products behind the frontier. DPI and PPM-squared have negative coefficients, as predicted, and PPM has a positive coefficient; all the coefficients are statistically significant in Models 2-4. 11 This is consistent with increased survival for
innovative products (H4e), and the results are quite strong. In addition, we have four hypotheses
11
We have also used dummy variables for each PPM Class, and the rank order of the coefficients support the specifications being suggested here.
related to the product exit and entry patterns of innovative firms. The coefficient on PATENTS is small and not statistically significant in any specification.12 This allows us to reject H4a and H4b, which predict shorter lives for innovative products due to “racing” behavior. That is, in this industry, the “innovator” tends to keep its current product portfolio on the market.
Innovative firms do not exit products from markets at higher rates than their less innovative counterparts. In the next section, we examine whether H4c or H4d are more likely outcomes.
In Model 4, we examine REPLACEMENT, subject to earlier caveats. We would like to know if a company pulls a product at the same time it enters a new one. The coefficient on REPLACEMENT is less than one, but not statistically significant, suggesting exit is not more likely when a firm introduces an additional product into the same niche. However, this result, because of the potential endogeneity of the variable, must be viewed cautiously. We discuss this much further in the next section.
Finally, we turn to the control variables. Vertically integrated firms that manufacture both laser printer engines and laser printers have a 31% lower hazard rate for their laser printers. Future research should examine this finding. HP seems to enjoy no statistically significant higher or lower survival rates for its products than do other manufacturers, controlling for other factors. Although higher priced products do not have higher hazard rates, controlling for product and firm observable characteristics, products that incorporate HP-PCL standards (the main standard in the industry) survive longer on the market. The coefficient on the residual from the hedonic pricing equation is not statistically significant, suggesting the unobservable qualities that generate a “high price” are probably due to higher quality, rather than higher cost (in contrast to
12 We have chosen these patent classes because it is our understanding from interviews that most recorded laser printer innovations occur in these patent classes. The coefficient could be insignificant because a) there are software innovations that are not patented, b) laser printer innovations occur in other patent classes that we have missed, c)
Stavins 1995). PC sales have no effect on printer hazard rates. However, increases in inkjet prices are related to much higher exit rates for laser printers. Every $100 increase in the price of inkjet printers results in an 80-88% higher probability that the laser printer will exit the market. While this is the opposite effect one might expect of a substitute product, the price of inkjet printers reflects the advances in that technology that allow ink-jets to compete with low-end laser printers. Our results suggest that substitute products (inkjet printers) play a larger role in this industry than complements (PCs).
Overall we find that competition drives less innovative products out of markets. On the cost side, learning seems to have a larger impact than economies of scale, as measured in this study, in determining product exit. However, innovation is potentially quite important. We explore innovation and learning further in the next section.
VI. REFINEMENTS
In this section, we introduce four refinements to the empirical work that explore the importance of innovation, cannibalization, cost, and competition in determining product survival rates. The first refinement examines demand. It is reasonable to expect that in product niches where there is strong (and perhaps growing) demand, products that have high cost, high price, or poor quality may survive longer than similar products that are in niches with low demand or slowing growth. To examine this possibility, we include in the hazard rate model a variable called NICHE DEMAND, which is the number of units sold in the product niche in that year. Earlier in the paper, we noted the questionable quality of this measure, but we include it in Models 5 and 6 of Table 6 in the hope that even a crude indicator might be useful. This variable
firms do not patent laser printer innovations, d) other technologies, on top of laser printer innovations, appear in these patent classes, or e) patents are a poor measure of innovation in this industry.
is comprehensively available beginning only in 1990. Thus, we are required to drop printers from the dataset that were introduced before 1990. Models 5 and 6 illustrate that the coefficient on NICHE DEMAND is negative, as expected, but statistically significant only at the 83% level, so we are unable to conclude that higher demand increases survival. Better demand data over a longer time series might help us sort out the results.
A second extension is a further examination of the economies of scale and learning hypotheses. In Models 1-4, we use an ordinal measure of market share, and classify a firm as DOMINANT IN YEAR if it is in the top ten of market share in a given year to measure the effects of economies of scale. We then measure cumulative learning through YEARS OF DOMINANCE, which measures the number of years a firm has been a dominant firm. We show that while the former variable has no statistical impact on product exit rates, the latter does. In this section, we shorten the sample from 1990 to 1996 and incorporate firm quantity data in thousands of units. Thus, UNITS is the number of units shipped by a firm in a given year, and CUMULATIVE UNITS is the cumulative units shipped by a firm over time to the present year, inclusive.13 We show in Models 5 and 6 that both result in lower hazard rates as before, but are not statistically significant. Thus, the earlier result supporting the notion of learning in this industry lacks robustness under this better, albeit shorter time-series, measure.
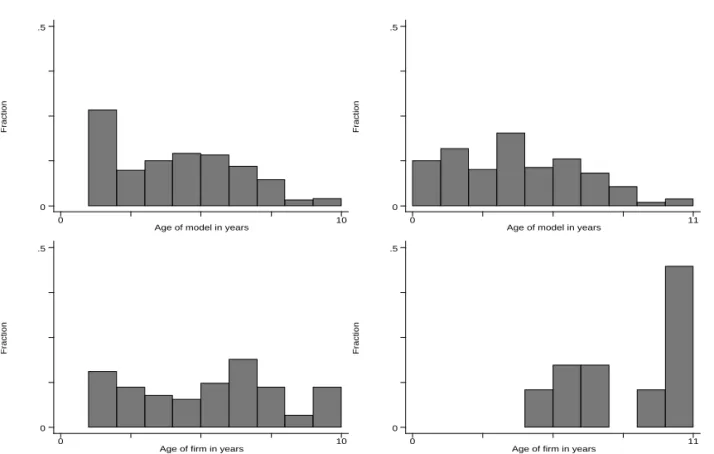
A third extension is an examination of dominant and fringe product survival rates. We show that in some cases dominant firm products have longer survival prospects than fringe firm products. However, it would be interesting to know if this result is a consequence of the fact that dominant firms have longer lives, a type of sample selection. That is, is fringe firm product exit partially due to fringe firm exit? In Figure 7, we create a frequency distribution for fringe
13
product survival and fringe firm survival, and dominant product survival and dominant firm survival. While the fringe firm survival is almost uniformly distributed across the years,
dominant firm survival is severely skewed toward longevity. Thus, it is reasonable to think that firm exit is related to product exit. The relationship between firm and product exit would be an interesting question for future study.
A final extension is a refinement of the innovation hypothesis. In Figure 1, we argued that there were four potential outcomes for innovation. In the hazard rate model, we show that patents have little effect on product exit. This result supports Hypothesis 4c and 4d. However, we would like to distinguish between the two.
To this end, we conduct an analysis of entry. In this analysis, a model or product entry occurs when it first appears in our database. This is normally the first ship date reported by analysts. We count the number of product introductions for each firm for each niche for each year, so each observation is a firm-niche-year observation. Once a firm has entered the market, a firm becomes at risk for entry into any niche, and it remains at risk for all time periods that it has a printer still on the market.14 The dependent variable is the count of products entered by the firm in a given niche-year.
Many of the independent variables to describe market structure are the same as in the previous section, such as the degree of competition in the focal niche and the total number of printers in the same DPI niche and PPM niche. We also use many of the same firm variables, such as awards to the firm and dominant firm status. We include three additional variables. WAGE is the average wage of a Level 4 engineer as defined by the Bureau of Labor Statistics. An entry decision may be affected by the product development cost. One such cost is the labor
14
We have coded the data in this way because we believe that the decision to enter the market at all is fundamentally different than a decision to continue in the marketplace.
of engineers, who are required to design new products, but are less important when the printer is actually in manufacturing. LAG OF ENTRY is the lag of the count of products of a firm’s entry in the niche. DOMINANT POSITION measures whether the firm was in the top ten of market share for two consecutive years.
To estimate these equations, we begin with the assumption that the count variables are Poisson distributed. Unfortunately, specification tests (Cameron and Trivedi 1986) indicate there is overdispersion in the data. Overdispersion occurs when the Poisson model assumption that the conditional mean of the event counts equals the variance is violated. We therefore use estimate the model assuming a negative binomial distribution, which allows for overdispersion.15
It sets the condition mean at E(yi |xi)=ui =exp[xiβ], but allows the variance to take the form
i i
i x u
y
V( | )=(1+α) . 16 Each of the parameters of (exp[xiβ])can be thought of as multipliers of the rate of product introduction.
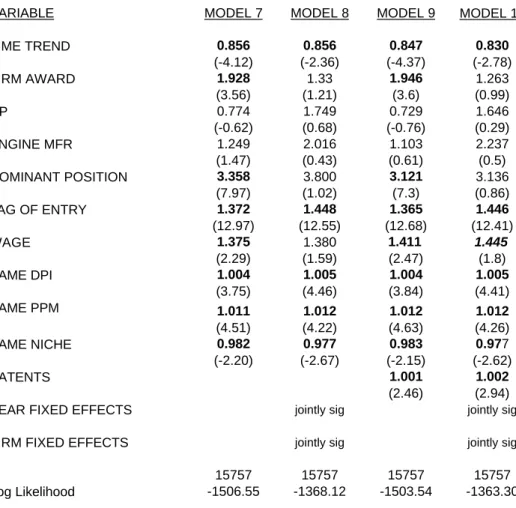
Table 7 displays the entry regressions. Models 7 and 8 present the entry model without the innovation variable, without and with year fixed effects and firm fixed effects. Models 9 and 10 present the entry model with the innovation variable, without and with year fixed effects and firm fixed effects. The incidence ratio or multiplier is presented with its asymptotic t-statistic beneath in parentheses. If the multiplier is more than one, an increase in the variable by one unit is associated with an increase in the number of product introductions; numbers less than one mean fewer product introductions. All coefficients are marked for statistical significance on two tailed asymptotic t-tests.17 All coefficients, except wages, are signed as expected and
15 We have estimated the models using a linear tobit formulation and results are roughly the same. 16
In all of the negative binomial regressions, the estimated value of α is statistically significant. 17
statistically significant at the 95% level of confidence in Models 7 and 9, and most coefficients are statistically significant at the 95% level in Models 8 and 10.
Dominant firms are likely to introduce new products at over three times the rate of fringe firms. Competition (SAME NICHE) results in less entry, as expected. Every additional product in the niche results in 2-3% lower entry rate. Thus competition not only speeds exit, but slows entry, consistent with broader economic theories of product markets.
The innovation variable, PATENTS, which is the focus on the innovation hypothesis, has a positive and statistically significant coefficient in Models 9 and 10. This suggests that firms that are more innovative have higher entry rates. Each 10 new patents in the key patent classes increases the rate of entry by about 1-2%. The product entry rates would be approximately 9%-18% greater for the average innovator with 92 patents than for the non-innovator. This result, along with the results of the hazard rate regressions, is consistent with hypothesis H4d: enter, no exit. That is, innovative firms are not exiting their products more quickly than other firms, but they are entering at higher rates. This result is consistent with an extensive literature on product proliferation in differentiated product space to block entry FIX (e.g. Schmalensee 1978, Scherer 198218) and with the marketing literature on brand extension. Innovators choose to cannibalize their existing portfolio by expanding and improving their product line.
VII. DISCUSSION
Why do products exit markets? Do managers choose to pull products after they introduce more innovative replacements, or are the incumbent products driven out? This paper suggests that managers of innovative companies are careful and strategic. Innovative companies have no greater propensity to pull their older products off the market than do non-innovative companies. Rather, they seem to innovate and enter, and leave their incumbent products on the market to be
forced out by the competition. This strategy may derive its profits through blocking entry,
obtaining market power in the channel, or a host of other reasons not explored here. Competition is quite an important force in determining product exit rates. While learning may advantage some firms, the results are not extremely robust, and substantively have a small impact on product survival. Together, these results suggest managers have developed innovation strategies to take advantage of their competitive environment.
This paper also has some initial findings unrelated to product exit. First, we show that there can be two innovation frontiers for a product, a top frontier which is the traditional “make it better, faster” product innovation frontier, and a bottom frontier which is the “make it cheaper, accessible” frontier. We demonstrate that products on either frontier have better survival
prospects. These kind of dual frontiers probably exist in a number of industries, such as personal computers (with the Celeron), DVD players, and digital TVs, to name just a few. It would be interesting to document the frontiers in other industries, and examine in more detail what happens on the bottom frontier. Second, we have shown the importance of fringe firms in the marketplace. Nearly 50% of product introductions in the desktop laser printer industry are by fringe firms. They represent 80% of all firms in the industry. Future studies should attempt to examine these firms in greater detail, as they can have a big impact on the results of strategic interaction and competition. Third, we have illustrated the relationship between firm survival and product survival rates (see Figure 7). Investigating the micro-foundations of survival at the product level would deepen the understanding of firm survival provided by numerous earlier studies.
REFERENCES
Abernathy, W. and J. Utterback (1978). “Pattern of Industrial Innovation,” Technology Review 80:40-47.
Cameron, A, and P. Trivedi (1986). “Econometric Models Based on Count Data: Comparisons and Applications of Some Estimators and Tests,” Journal of Applied Econometrics 1: 29-53. Carroll, Glenn R. (1983). “Dynamic Analysis of Discrete Dependent Variables: A Didactic Essay,” Quality and Quantity 17: 425-460.
Carroll, Glenn R. (1985). “Concentration and Specialization: Dynamics of Niche Width in Populations of Organizations,” American Journal of Sociology, 90(6): 1262-1283.
Christensen, Clayton M. (1997). The Innovator’s Dilemma. (Boston: Harvard Business School Press).
Christensen Clayton M., Suarez Fernando F., and Utterback James M. (1998). “Strategies for survival in fast-changing industries,” Management Science 44(12): S207-220.
de Figueiredo, John M., and David J. Teece (1996). "Mitigating Procurement Hazards in the Context of Innovation," Industrial and Corporate Change 5(2): 537-559.
Ghemawat, Pankaj, and Nalebuff, Barry (1985). “Exit,” Rand Journal of Economics 16(2): 184-94.
Gort, Michael, and Steven Klepper (1982). “Time Paths in the Diffusion of Product Innovations,” Economic Journal 92(367): 630-53.
Greenstein, Shane M., and James B. Wade (1998). “The Product Life Cycle in the Commerical Mainframe Computer Market, 1968-1982,” The Rand Journal of Economics 29(4): 772-789. Hannan, Michael T., and Glenn R. Carroll (1993). Dynamics of Organizational Populations. New York: Oxford University Press.
Henderson, Rebecca (1995). “Of Life Cycles Real and Imaginary: The Unexpectedly Long Old Age of Optical Lithography,” Research Policy 24: 631-643.
Hoang, Ha, Toby E. Stuart and Ralph Hybels "Interorganizational Endorsements and the Performance of Entrepreneurial Ventures", Administrative Science Quarterly, 44 (1999), 315-349.
Jovanovic, Boyan (1982). “Selection and the Evolution of Industry,” Econometrica 50: 649-670. Jovanovic, Boyan, and G.M. MacDonald (1994). “The Life Cycle of a Competitive Industry,” Journal of Political Economy 102: 322-347.
Jovanovic, Boyan, and Saul Lach (1989). “Entry and Exit with Learning by Doing,” American Economic Review 79: 690-699.
Judd, Kenneth (1985). "Credible Spatial Preemption," RAND Journal of Economics, 16 pp. 153-66.
Klepper, Steve (1997). “Entry, Exit, Growth, and Innovation over the Product Life Cycle,” American Economic Review 86: 562-583.
Kyle, Margaret K., and John M. de Figueiredo (2000). “What Happens When a Dominant Firm Enters A Product Niche With Fringe Firms?” MIT Working Paper.
Levinthal, Daniel (1997). “Adaptation on rugged landscapes,” Management Science 43(7): 934-950.
Mowery, David, Joanne E. Oxley, and Brian S. Silverman (1996). "Strategic Alliances and Interfirm Knowledge Transfer," Strategic Management Journal 17: 77-91.
Scherer, Frederick M. (1982). “The Breakfast Cereal Industry,” in The Structure of American Industry (6th ed.), W. Adams, ed. (New York: Macmillan).
Schmalensee, Richard (1978). “Entry Deterrence in the Ready-to-Eat Breakfast Cereal Industry,” Bell Journal of Economics 9(2): 305-27.
Schumpeter, Joseph (1942). Capitalism, Socialism, and Democracy. (New York: Harper). Shaked, Avner, and John Sutton (1987). “Product Differentiation and Industrial Structure,” Journal of Industrial Economics, 36(2): 131-146.
Silverman, Brian S. (1999). “Technological Resources and the Direction of Corporate
Diversification: An Integration of the Resource-Based View and Transaction Costs Economics,” Management Science 45: 1109-1124.
Stavins, Joanna (1995). “Model Entry and Exit in a Differentiated-Product Industry: The Personal Computer Market,” Review of Economics and Statistics 74: 571-584.
Stigler, George J. (1968). The Organization of Industry. (Homewood, IL: Richard D. Irwin).
Teece, David, and Gary Pisano (1994). “Dynamic Capabilities of Firms,” Industrial and Corporate Change, 3:537-556.
Tushman, M., and P. Anderson (1986). “Technological Discontinuities and organizational environments,” Administrative Science Quarterly 31: 439-465.
Figure 1: Hypotheses 4a-d
Hold
Enter
Exit
No Exit
New
Prod
uct
Old Product
π
D= profit of both products in market together
π
N= profit of new product when alone in market
π
O= profit of old product when alone in market
H4a:
0 >
π
D,
π
N,
π
OH4b:
π
N>
π
D,
π
OH4c:
π
O>
π
D,
π
NH4d:
π
D>
π
N,
π
OFigure 2: Number of Firms and Products in Marketplace
Number of
Models
Number of Products and Firms
Year Number of Firms Models Firms 1984 1986 1988 1990 1992 1994 1996 1 633 1 230
Figure 3: Product Entry and Exit
Number of
New Models
Entry and Exit, 1984-1996
yyyy Number of E x it ing Models Entry Exit 1984 1986 1988 1990 1992 1994 1996 0 20 40 60 80 100 120 140 160 180 200 0 20 40 60 80 100 120 140 160 180 200
dpi ppm 0 5 10 15 0 500 1000 1500 2000
Figure 4: Product Distribution and Classes
Class 1 Class 2 Class 3 Class 4 Class 5 Class 6 Class 7 Class 8 Class 9 Class 10 Class 11 Class 12 Class 14 Class 14 Class 15 Class 16 Class 17 Class 18 Class 19 Class 20
Figure 5: DPI by Model
dpi yyyy 1985 1990 1995 2000 0 500 1000 1500 2000 Frontier (Product Innovation)Figure 6: PPM by model
ppm yyyy 1985 1990 1995 2000 0 5 10 15 Bottom Frontier (Mass Market) Top Frontier (Product Innovation)Figure 7: Printer and Firm Survival Rates
Fringe Product and Firm Survival Rates Dominant Product and Firm Survival Rates
F
rac
ti
on
Age of model in years
0 10 0 .5 F rac ti on
Age of model in years
0 11 0 .5 F rac ti on
Age of firm in years
0 10 0 .5 F rac ti on
Age of firm in years
0 11
0 .5
TABLE 1A: CONCENTRATION RATIOS TABLE 1B: NUMBER OF YEARS IN AND TOTAL SHIPMENTS TOP TEN IN SHIPMENTS
Year Hewlett Packard C5 Ratio C10 Ratio
Total Estimated
Shipments Firm Years
1987 58.12% 87.83% 100.00% 411,845 HEWLETT-PACKARD_COMPANY 9 1988 61.66% 87.31% 99.28% 646,097 IBM/LEXMARK 9 1989 49.68% 87.48% 98.47% 991,331 DIGITAL_EQUIPMENT_CORP 8 1990 54.89% 78.39% 87.44% 1,925,152 PANASONIC/MATSUSHITA 8 1991 48.80% 76.59% 90.13% 2,687,110 APPLE_COMPUTER_CO 7 1992 50.58% 80.17% 92.89% 2,303,355 OKIDATA_CORP 7 1993 57.08% 82.36% 92.92% 2,303,990 TEXAS_INSTRUMENTS_INC 7 1994 55.88% 80.49% 94.42% 2,795,232 EPSON_AMERICA_INC 6 1995 60.53% 85.95% 99.62% 2,814,688 NEC_TECHNOLOGIES_INC 6 KYOCERA_UNISON 5 CANON 4 QMS_INC 4 XEROX_CORP 3 BROTHER_INTERNATIONAL_CORP 2 C-TECH_ELECTRONICS_INC 1 FUJITSU_AMERICA_INC 1 GCC_TECHNOLOGIES_INC 1 SUN_MICROSYSTEMS 1 TANDY_CORP 1
YEAR Time trend variable to the beginning of the industry.
MODEL AGE The age of the product measured as the number of years since introduction. HP-PCL, POSTSCRIPT,
DIABLO, and EPSON
Dummy variables for printing standards.
MODEL AWARD and FIRM AWARD
One measure of product quality is to examine whether the printer has won an award for price and performance. Every year, PC Magazine announces 4-10 printer awards for printers that they judge to be particularly good value across the spectrum of printers available, based on features and predicted reliability. MODEL AWARD equals one if the particular model won an award. FIRM AWARD equals one for all models manufactured by a firm if any of its models won an award in the prior two years.
REBRAND Dummy variable equalling one if the product is made by another firm and then just rebranded. DPI The resolution of the printer measured in dots per inch, measured as log(100dpi).
PPM The speed of the printer measured in pages per minute. PPM-squared Speed of printer, measured in pages per minute, squared. PRICE List price of the printer.
HEDONIC RESIDUAL The value of the residual from the hedonic regression.
DOMINANT FIRM A dummy variable equaling one if the vendor was one of the top ten producers in terms of market share for the given year, zero otherwise.
CUMULATIVE DOMINANCE
A count variable equaling the number of years the producers is in the top ten producers, up to the given year.
UNITS Number of units shipped in the given year by the firm.
CUMULATIVE UNITS Total number of units shipped by the firm during the previous and given year.
HP Dummy variable for HP.
OWN ALL MODELS The number of total models the focal vendor currently has in the desktop printer market. OWN NICHE MODELS The number of models the focal vendor currently has in the focal class.
ENGINE MANF Dummy variable for engine manufacturer.
TOTAL MODELS The number of total models in the desktop laser printer market at the time. SAME DPI and SAME
PPM:
The number of products that are at the same DPI (all classes covering the same DPI), and the number of products that are at the same PPM (all classes covering the same PPM).
SAME NICHE The number of products competing in the same local PPM-DPI class as the product under consideration.
INK JET PRICE The average price of ink jet printers.
PC SALES The number of personal computers sold in the United States in millions.
PATENTS The number of new patents issued, by application year, in patent classes 271, 355, 359, and 395.
REPLACEMENT Dummy variable = 1 if the firm entered a new printer model in the class in the given year. NICHE DEMAND Number of units shipped in a given niche in a given year.
ENGINEERING WAGE The average wage of a Level 4 engineer as defined by the Bureau of Labor Statistics DOMINANT POSITION Dummy variable = 1 if the firm was in the top ten of marketshare for two years LAG OF ENTRY The lag of the count of products of a firm’s entry in the class
VARIABLE MEAN STD. DEV. TIME TREND 8.432 2.173 AGE 3.036 1.857 POSTSCRIPT 0.545 0.499 HP-PCL 0.864 0.343 MODEL AWARD 0.102 0.303 REBRAND 0.093 0.291 LN DPI 6.097 0.459 PPM 7.946 2.573 PRICE 22.508 17.568 HEDONIC RESIDUAL 0.000 0.335 REPLACEMENT 0.392 0.488 SAME PPM 71.605 35.584 SAME DPI 176.463 101.647 SAME NICHE 25.359 16.014 DOMINANT IN YEAR 0.169 0.378 YEARS OF DOMINANCE 1.559 2.944 HP 0.017 0.130 OWN IN NICHE 1.864 1.514 OWN MODELS 11.610 12.605 FIRM AWARD 0.153 0.363 ENGINE MFR 0.220 0.418 PATENTS 52.203 138.867
PPM 0.076 (6.85) DPI -0.308 (-3.51) LN STD MEMORY 0.418 (13.29) HP-PCL -0.114 (-1.19) DIABLO 0.059 (0.66) EPSON 0.020 (0.23) OTHER STANDARD 0.431 (2.94) HP -0.148 (-0.35) 1987 -1.011 (-2.33) 1988 -0.473 (-1.04) 1989 -1.111 (-2.69) 1990 -1.178 (-2.90) 1991 -1.322 (-3.27) 1992 -1.573 (-3.86) 1993 -1.750 (-4.33) 1994 -1.824 (-4.46) 1995 -1.868 (-4.52) 1996 -1.969 (-4.71) 1997 -2.116 (-3.41)
Firm Fixed Effects Not sig
N 354
R-Squared 0.7443
Note: Dependent Variable is Ln(ListPrice). T-statistics beneath estimated coefficients. Bolded coefficients are significant at 95% level. Postscript is the omitted standard.
Hypothesis Variable Expected Sign Actual Sign Substantive Impact H1: Competition TOTAL MODELS + + Large
SAME NICHE + + Large
H2a: Fixed Cost DOMINANT FIRM - 0
H2b: Learning CUMULATIVE DOMINANCE - - Small
H3: Cannibalization OWN NICHE + 0
H4: INNOVATION
H4a: Hold, Exit PATENTS + 0
H4b: Enter, Exit PATENTS + 0
H4c: Hold, No Exit PATENTS 0 0
PATENTS IN ENTRY 0 +
H4d: Enter, No Exit PATENTS 0 0 Moderate PATENTS IN ENTRY + + Large H4e: Innovative Products PPM + + Large PPM-SQUARED - - Moderate
DPI - - Large
Note: Bolded hypotheses are broadly confirmed by the data. Actual sign is based on sign and significance level for Models 1-6. Substantive impact is subjective based on magnitude of coefficients.
Results TABLE 5: OPERATIONALIZATION AND OUTCOMES OF TESTS OF HYPOTHESES
TABLE 6: HAZARD RATE MODELS FOR PRODUCT EXIT
VARIABLE MODEL 1 MODEL 2 MODEL 3 MODEL 4 MODEL 5 MODEL 6
TIME TREND 1.853 (7.20) 0.581 (-1.42) 0.565 (-1.69) 0.563 (-1.70) 0.232 (-2.55) 0.232 (-2.55) MODEL AGE 1.233 (6.15) 1.163 (5.42) 1.163 (5.39) 1.153 (5.00) 1.246 (5.27) 1.249 (5.01) POSTSCRIPT 0.979 (-0.14) 0.916 (-0.72) 0.925 (-0.63) 0.928 (-0.61) 1.061 (0.41) 1.062 (0.42) HP-PCL 0.688 (-1.87) 0.747 (-1.74) 0.753 (-1.70) 0.751 (-1.73) 0.605 (-2.69) 0.604 (-2.67) MODEL AWARD 0.927 (-0.37) 0.870 (-0.90) 0.889 (-0.76) 0.881 (-0.81) 0.755 (-1.51) 0.756 (-1.52) REBRAND 0.938 (-0.30) 0.866 (-0.90) 0.86 (-0.94) 0.866 (-0.90) 0.808 (-1.10) 0.801 (-1.06) LN DPI 0.698 (-1.84) 0.417 (-2.72) 0.412 (-2.77) 0.411 (-2.77) 0.485 (-1.77) 0.489 (-1.73) PPM 1.257 (1.43) 1.539 (2.52) 1.529 (2.47) 1.498 (2.33) 1.610 (2.03) 1.626 (2.01) PPM2 0.988 (-1.17) 0.976 (-2.16) 0.976 (-2.12) 0.978 (-1.97) 0.973 (-1.81) 0.972 (-1.78) PRICE 0.996 (-0.44) 1.008 (1.21) 1.008 (1.25) 1.008 (1.33) 1.007 (0.93) 1.007 (0.91) HEDONIC RESIDUAL 1.531 (2.06) 1.245 (1.26) 1.240 (1.23) 1.234 (1.22) 1.186 (0.95) 1.188 (0.96) DOMINANT IN YEAR 0.889 (-0.60) 0.901 (-0.61) 0.892 (-0.65) 0.868 (-0.80) YEARS OF DOMINANCE 0.877 (-4.39) 0.941 (-2.20) 0.938 (-2.28) 0.940 (-2.21) UNITS 0.927 (-1.16) 0.929 (-1.12) CUMULATIVE UNITS 0.994 (-0.08) 0.993 (-0.10) HP 0.528 (-1.67) 0.688 (-1.30) 0.685 (-1.31) 0.721 (-1.12) 0.836 (-0.60) 0.828 (-0.62)
OWN NICHE MODELS 1.057
(1.60) 1.027 (0.84) 1.027 (0.84) 1.037 (1.13) 1.020 (0.52) 1.017 (0.46)
OWN ALL MODELS 1.021
(3.83) 1.005 (1.03) 1.005 (0.99) 1.004 (0.91) 1.002 (0.36) 1.002 (0.36) FIRM AWARD 1.549 (2.53) 1.237 (1.15) 1.229 (1.10) 1.242 (1.16) 1.141 (0.73) 1.138 (0.72) ENGINE MANF 0.530 (-3.51) 0.709 (-2.62) 0.688 (-2.88) 0.699 (-2.74) 0.718 (-2.50) 0.718 (-2.5) PC SALES 0.925 (-4.97) 1.078 (0.79) 1.083 (0.94) 1.080 (0.91) 1.149 (1.50) 1.150 (1.55) INKJET PRICES 1.329 (3.10) 1.818 (3.23) 1.873 (3.57) 1.873 (3.57) 9.031 (2.75) 9.080 (2.77) TOTAL MODELS 1.02 (3.96) 1.021 (4.49) 1.021 (4.49) 1.033 (4.04) 1.033 (4.06) SAME PPM 0.992 (-2.87) 0.992 (-2.79) 0.992 (-2.73) 0.991 (-2.27) 0.991 (-2.29) SAME DPI 0.993 (-2.63) 0.993 (-2.58) 0.993 (-2.56) 0.992 (-2.33) 0.992 (-2.33) SAME NICHE 1.021 (2.41) 1.021 (2.36) 1.020 (2.30) 1.031 (2.42) 1.031 (2.45) PATENTS 1.00 (1.18) 1.00 (1.22) 1.00 (0.78) 1.00 (0.76) REPLACEMENT 0.846 (-1.07) 1.039 (0.19) NICHE DEMAND 1.00 (-1.37) 1.00 (-1.37) N 1603 1603 1603 1603 1239 1239 Log Likelihood -203.789 -105.478 -105.08 -104.751 -81.707 -81.696
Note: All coefficients are hazard ratios. T-statistics are in parentheses below the hazard ratio.
TABLE 7: NEGATIVE BINOMIAL FOR ENTRY
VARIABLE MODEL 7 MODEL 8 MODEL 9 MODEL 10
TIME TREND 0.856 (-4.12) 0.856 (-2.36) 0.847 (-4.37) 0.830 (-2.78) FIRM AWARD 1.928 (3.56) 1.33 (1.21) 1.946 (3.6) 1.263 (0.99) HP 0.774 (-0.62) 1.749 (0.68) 0.729 (-0.76) 1.646 (0.29) ENGINE MFR 1.249 (1.47) 2.016 (0.43) 1.103 (0.61) 2.237 (0.5) DOMINANT POSITION 3.358 (7.97) 3.800 (1.02) 3.121 (7.3) 3.136 (0.86) LAG OF ENTRY 1.372 (12.97) 1.448 (12.55) 1.365 (12.68) 1.446 (12.41) WAGE 1.375 (2.29) 1.380 (1.59) 1.411 (2.47) 1.445 (1.8) SAME DPI 1.004 (3.75) 1.005 (4.46) 1.004 (3.84) 1.005 (4.41) SAME PPM 1.011 (4.51) 1.012 (4.22) 1.012 (4.63) 1.012 (4.26) SAME NICHE 0.982 (-2.20) 0.977 (-2.67) 0.983 (-2.15) 0.977 (-2.62) PATENTS 1.001 (2.46) 1.002 (2.94)
YEAR FIXED EFFECTS jointly sig jointly sig
FIRM FIXED EFFECTS jointly sig jointly sig
N 15757 15757 15757 15757
Log Likelihood -1506.55 -1368.12 -1503.54 -1363.30
Note: The dependent variable is count of model entry in each class by each firm.
Bolded coefficients are significant at the 95% level; bolded and italicized are significant at the 90% level. All coefficients are presented as incidence ratios; the t-statistics are below the coefficients in parentheses.