HAL Id: hal-01582082
https://hal.archives-ouvertes.fr/hal-01582082
Submitted on 6 Sep 2017HAL is a multi-disciplinary open access archive for the deposit and dissemination of sci-entific research documents, whether they are pub-lished or not. The documents may come from teaching and research institutions in France or abroad, or from public or private research centers.
L’archive ouverte pluridisciplinaire HAL, est destinée au dépôt et à la diffusion de documents scientifiques de niveau recherche, publiés ou non, émanant des établissements d’enseignement et de recherche français ou étrangers, des laboratoires publics ou privés.
coefficients of zirconium-doped congruent lithium
niobate crystals
Mustapha Abarkan, Anush Danielyan, Ninel Kokanyan, Michel Aillerie,
Sergey Kostritskii, Edvard Kokanyan
To cite this version:
Mustapha Abarkan, Anush Danielyan, Ninel Kokanyan, Michel Aillerie, Sergey Kostritskii, et al.. The clamped and unclamped effective electro-optic coefficients of zirconium-doped congruent lithium niobate crystals. Journal of Physics: Conference Series, IOP Publishing, 2017, 879, pp.012004. �10.1088/1742-6596/879/1/012004�. �hal-01582082�
This content has been downloaded from IOPscience. Please scroll down to see the full text.
Download details:
IP Address: 84.103.125.210
This content was downloaded on 02/09/2017 at 22:19
Please note that terms and conditions apply.
The clamped and unclamped effective electro-optic coefficients of zirconium-doped congruent
lithium niobate crystals
View the table of contents for this issue, or go to the journal homepage for more 2017 J. Phys.: Conf. Ser. 879 012004
(http://iopscience.iop.org/1742-6596/879/1/012004)
Home Search Collections Journals About Contact us My IOPscience
You may also be interested in:
The r22 electro-optic coefficients in indium-doped congruent lithium–niobate crystals Mustapha Abarkan, Anush Danielyan, Sasha Sewastianow et al.
The r33 electro-optic coefficient of Er:LiNbO3 A Petris, S Heidari Bateni, V I Vlad et al.
Pyroelectric and Optical Properties of Potassium Lithium Niobate Tatsuya Nagai and Takuro Ikeda
Electron probe microanalysis of the dopant concentrations in complex perovskite ferroelectrics Z Samardžija
Poled Silica/DR1 Films with Thermally Stability and LargeElectro-Optic Coefficient Applying in External Probe Tip
Liu Hong-Fei, Hou A-Lin, Liu Yun-Tao et al.
The Electro-Optic Light Scanner Masakatsu Okada and Shogo Ieiri
Self-confined beams in erbium-doped lithium niobate M Alonzo, F Pettazzi, M Bazzan et al.
1
Content from this work may be used under the terms of theCreative Commons Attribution 3.0 licence. Any further distribution of this work must maintain attribution to the author(s) and the title of the work, journal citation and DOI.
Published under licence by IOP Publishing Ltd
The clamped and unclamped effective electro-optic
coefficients of zirconium-doped congruent lithium niobate
crystals
Mustapha Abarkan1,2,3,* , Anush Danielyan2,3,4 , Ninel Kokanyan2,3 , Michel Aillerie2,3 , Sergey Kostritskii5 , Edvard Kokanyan4,61LSI, Faculté Polydisciplinaire de Taza, Université Sidi Mohammed Ben Abdallah de
Fès, BP 1223 Taza-Gare, Morrocco
2
Université de Lorraine, LMOPS, EA 4423, 57070 Metz, France
3CentraleSupélec, LMOPS, 57070 Metz, France. 4
Institute for Physical Researches, National Academy of Sciences of Armenia, Ashtarak-2, Armenia.
5
RPC Optolink, Sosnovaya al. 6, bd.5, Zelenograd, 124489, Moscow, Russia.
6
Armenian State Pedagogical University, Yerevan, Tigran Mets Ave., 17, Armenia. E-mail: mustapha.abarkan@usmba.ac.ma, aillerie@metz.supelec.fr
Abstract: All coefficients of the unclamped and clamped electro-optic tensor of
zirconium-doped congruent LiNbO3 single crystals are determined as function of the dopant concentration at room temperature. With a distribution coefficient of zirconium closer to one in the considered range, the dopant concentration is in the range up to 2.5 mol% of ZrO2. The electro-optic coefficients are measured by direct techniques based on interferometric and Sénarmont optical arrangements at the wavelength of 633 nm. It is found that all the unclamped and clamped effective electro-optic coefficients are relatively constant, except for the sample grown with 2 mol% of zirconium. The electro-optic behavior of LN:Zr as function of the dopant concentration was confirmed by dielectric characterizations. The concentration equal 2 mol% of ZrO2 can be considered to a threshold concentration for various physical and optical properties.
1. Introduction
Zr-doped LiNbO3 (LN) is a promising substrate material for nonlinear integrated optics as it combines excellent electro-optic (EO), acousto-optic, and nonlinear optical properties [1, 2]. Indeed, even based on pure composition, Lithium niobate (LN) crystals have good optical quality and uniformity, an excellent electro-optic, piezoelectric, acoustic and nonlinear optical properties. Generally, LN crystals with the molar ratio R= [Li]/[Nb]= 0.946 corresponding to the congruent composition, are used in a lot of optical and acoustic devices due to their physical properties but also due to their high optical quality and growth facilities. However, these devises suffer from serious photorefractive effect, as the main drawback of congruent LN is its relatively low optical damage resistance compared to other competing oxide crystals such as LiTaO3 (LT) or BaB2O4 (BBO) [2, 3]. The photorefractive effect in LN is mainly linked to the presence in congruent LN crystals of intrinsic defects due to the presence of Nb ions on antisites, i.e. on Li sites (noted NbLi) [4, 5]. Different approaches have been developed to enhance or to reduce the photorefractive sensitivity in LN as function of the type of desired applications. In the first case, when an increase of the photorefractive properties is expected as
2
1234567890
NAMES'16 IOP Publishing
IOP Conf. Series: Journal of Physics: Conf. Series 879 (2017) 012004 doi :10.1088/1742-6596/879/1/012004
involved for holographic applications, LN can be doped with metallic ions as chromium or iron ions. It was shown that the large dependence of the EO coefficients on the Cr concentration is the signature of a significant change in the structure of defect centers in the LN host lattice [6-8]. It was also pointed out by Chah et al. that the diminution of the EO properties caused by the addition of even a small amount of Fe to LN is due to the indirect iron doping effect, which modifies the crystal composition, mainly by changing the intrinsic defects content [9]. In the second case, when a decrease of the photorefractive properties, i.e. an increase of the damage threshold is expected as involved for laser applications (for example EO Q-switch applications), various approaches are currently considered. One of them consists of decreasing the number of intrinsic defects by growing LN crystals with the ratio R closer to the one corresponding to the stoichiometric composition [10, 11]. The second approach consists in doping congruent LN crystals by appropriate ions on lithium site, removing the antisites NbLi to their natural sites. It is currently well-known that doping LN crystals by divalent ions such as Mg2+ [12, 13] and Zn2+ [14, 15] can effectively suppress the photorefractive effect. Especially, a significant reduction of optical damage was observed in doped samples with a threshold of about 5.5 mol% MgO [16, 17], 7 mol% ZnO [18, 19], respectively. Same observations were also established for LN doped crystals by trivalent ions such as Sc3+ and In3+, with the threshold about 1.5 mol% for both ions [20, 21]. Some years ago, the group of Kokanyan et al proposed a new set of non-photorefractive ions [22, 23]. It was shown that a reduction of the photorefractive sensitivity in LN crystals doped with tetravalent ions such as Hf4+ and Zr4+ could be achieved with more than 2 times lower impurity ions concentration than in the case of divalent ions. Moreover, this advantage is also associated to a distribution coefficient of these impurities at that concentration closer to one interesting during the growth process [24-28].
Among other optical and physical properties and closely linked in crystals of the LN family to the optical damage effect, the electro-optic properties are also mainly influenced by photorefractive-resistant impurities or dopants [19]. In previous contributions, we have shown that electro-optic properties of LN crystals doped with Zn or Mg ions present a huge oscillation with the concentration [13, 18]. By opposition, it seems that no significant dependence of the electro-optic properties on the doping concentration was observed in LN crystals doped with tetravalent ions as in hafnium doped LN crystals [29] or similarly, in zirconium doped LN crystals. In these crystals, the constant-stress electro-optic coefficients r222 and rc of zirconium-doped LN crystals appears only to be slightly influence on Zr [27, 28].
In the present work, we focalized on the electro-optic properties of zirconium-doped congruent LN crystals, hereafter noted LN:Zr. We provide a determination of the values for all unclamped (noted rT) and clamped (noted rS) effective electro-optic coefficients n
o3r113, ne3r133, no3r222, and ne3rc of a series of congruent LN:Zr crystals, with concentration from 0 up to 2.5 mol% ZrO2. Samples were grown from the same charge, thus we emphasize that they have the same amount of unintended impurity trace. Our experiments lead to conclude that an effective and relatively abrupt kink in the electro-optical properties exists for crystals around 2 mol% ZrO2 that is in full accordance with the threshold observed in optical damage. This behavior exists for all the unclamped and clamped coefficients of the third column of the electro-optic tensor, while the acoustic contribution remains constant in the studied concentration range.
2. Experimental 2.1 Sample preparation
Based on the Czochralski technique, a growth set-up using a single platinum crucible with rf heating element in air atmosphere was used to grow a set of Zr-doped lithium niobate crystals. In order to obtain directly during the growth process single-domain crystals, a dc electric current with a density of about 12 A/m2 passed through the crystal-melt system. The starting materials used for sintering the lithium niobate charges of congruent composition were high purity Nb2O5 and LiCO3 compounds from Johnson-Mattey and Merck. ZrO2 was introduced into the melt with concentration equals to 0.625, 0.75, 0.875, 1.00, 1.25, 1.50, 2.00 and 2.50 mol%, respectively. In this range, the distribution coefficient of zirconium is closer to one and we considered the same concentration in melts than in crystals. Finally, samples were shaped in a parallelepiped shape with about x, y, z = 5, 10, 5 mm dimensions and were optically polished on all the surfaces.
3
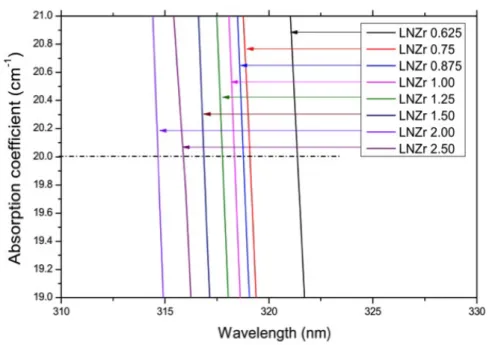
The record of the UV-Visible-NIR optical transmission spectra reveals the optical qualification of the samples. Transmission spectra were recorded at room temperature with an un-polarized light using a Perkin Elmer Lamda 900 spectrometer. Samples were placed with their polished faces at normal incidence, with the c (z) axis parallel to the k vector of the incident light. The transmission spectra recorded in all crystals present same behaviors with a flat transparency response in the whole visible range and an absorption edge appearing in the UV. The fundamental absorption edges of the crystals were measured at the absorption coefficient of 20 cm-1. Additionally to the good transparency without absorption parasitic peaks observed in all samples, these spectra bring interesting information on the role and influence of the dopant in lithium niobate crystals [30]. This point will be discussed further. However, we have plotted the interesting part for the present work of the absorption coefficient spectra and the absorption edges for the various samples, presented in figure 1. We observe a clear displacement of the absorption edge to UV when the concentration increases in the crystals up to 2 mol% of zirconium. Whereas for crystal doped with higher concentration, the displacement of the absorption edge is to the visible wavelengths. The zirconium concentration of 2 mol% in congruent LN crystal, which corresponds to the minimum observed in the absorption edge position, can be considered as a threshold concentration.
Figure 1. Absorption edge versus Zr concentration in congruent LN doped crystals
evaluated from absorption spectra.
2.2 Electro-optic measurements
The measurements are performed using both a Mach-Zehnder type interferometric and the one-beam Sénarmont type ellipsometric techniques both for light propagation along the x-axis. With the first technique, with an applied electric field parallel to the z-axis of the crystal, we have investigated the electro-optic coefficients r113 and r133. With the second technique, with an applied electric field parallel to the y-axis of the crystal we have investigated the electro-optic coefficient r222 and with an applied electric field parallel to the z-axis of the crystal, the combined coefficient rc. All measurements were performed at room temperature and using a He-Ne laser (633 nm).
For the determination of the unclamped electro-optic coefficients 𝑟!""! , we used a method called the “Modulation Depth Method” (MDM) [31]. This method consists in the measurement of the amplitude of the modulated beam induced by an ac-voltage applied on the sample under test. In the present study, we performed measurements with an ac-voltage of up to peak-to-peak amplitude equal to 250 V at 1 kHz. For the determination of the clamped (i.e. constant strain) electro-optic coefficients𝑟!""! , we used a method called the “Time Response Method” (TRM), which consists in the measurement of the time response of the EO crystal to a fast step voltage [32]. This method also alloys the determination
4
1234567890
NAMES'16 IOP Publishing
IOP Conf. Series: Journal of Physics: Conf. Series 879 (2017) 012004 doi :10.1088/1742-6596/879/1/012004
of the unclamped EO coefficients when the long time range contribution is considered in the EO response. We performed measurements with a pulse voltage of amplitude 300 V having a rise time equal to 5 ns and a repetition rate equal to 10 µs. It is to be of note that the unclamped coefficients can be determined by both methods MDM and TRM allowing the validation of the experimental results. In the same manner, we can note that the combined EO coefficients can be directly measured by the Sénarmont arrangement, offering a high accuracy and verified by its determination from the direct EO coefficients as measured by the interferometric setup.
Under the above-mentioned conditions, within both MDM and TRM methods, the absolute value of the effective EO coefficient 𝑟!"" can be determined within an equation having the form [30, 32]
n3r eff(ν) = A λ D π (Imax− Imin) L Δi(ν) ΔV(ν) (1)
where A = 2 or 1 for interferometric or Sénarmont measurements, respectively. In this equation, D is the inter-electrode distance, L the length of the crystal along the beam-propagation direction, λ is the vacuum wavelength, n the refractive index seen by the eigen-wave propagating in the crystal, 𝐼!"# and 𝐼!"# the maximum and minimum of the transmitted intensity and Δ𝐼! is the peak-to-peak amplitude of the sinusoidal (in MDM method) Δ𝑉 is the corresponding amplitude of the modulated voltage applied to the crystal.
For TRM technique we measure the instantaneous variation of the transmitted beam intensity Δi(t) induced by the applied voltage ΔV(t) which is given by:
Δi(t) =π L (Imax− Imin)
A λ D n
3r
eff(t)⊗ΔV(t) (2)
where ⊗ is the convolution operator and reff(t) is the instantaneous value of the EO coefficient.
In this technique, we display and measure with the help of an oscilloscope, the time signals Δi(t) and ΔV(t).
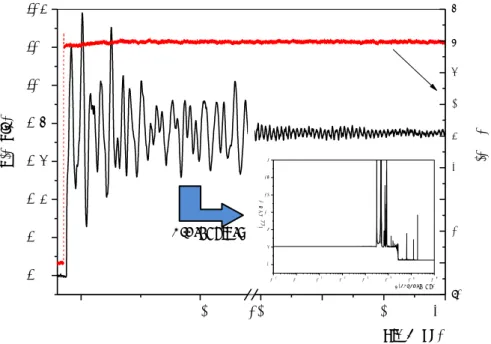
Figure 2. Time and frequency responses of the r222 EO coefficient. Response Δi(t) to one step voltage ΔV(t) and the frequency dependence obtained by the Z-transform (the insert) in the case of the EO coefficient r222 in 0.8%-Zr-doped LN single crystal. Measurements were performed at the wavelength of 633nm.
0 25 150 200 250 300 0,00 0,02 0,04 0,06 0,08 0,10 0,12 0,14 Δ V( t) ( V) 1 01 102 1 03 104 105 1 06 107 108 3 6 9 1 2 1 5 1 8 2 1 r 22 ( p m /V )
F req uen c y (H z )
Δ i( t) ( a. u ) T ime (µs ) Z -T ra ns form -100 0 100 200 300 400 500 600 700 800
5
As example of obtained results, figure 2 shows the recording of both the applied voltage and the optical signal measured in the 0.8 mol%-Zr doped LN sample at different time within the TRM method in the case of r222 EO coefficient. In the long-time range, the optical signal oscillates with periods corresponding to the main piezo-electric frequency resonances. For time shorter than 350 ns the oscillations do not exist since the acoustic waves need more time to propagate across the crystal. The value of the intensity corresponding to the plateau appearing for time below 350 ns is much smaller than this obtained for time larger than 200 µs, which indicates a large acoustic contribution. After the Z-transform of the two time dependent signals, Δi(t) and ΔV(t), the frequency dispersion of the EO coefficients is calculated from the ratio of Δi(ν) and ΔV(ν) according to Eq. 1, as it is the case with the MDM method [33]. We report in the insert of figure 2 the frequency dependence of the EO coefficient r222 in 0.8%-Zr-doped LN single crystal. We can observed that the answer is flat and quite at the same level on both sides of the piezoelectric resonances.
The measurements of all studied EO coefficients were performed for all crystals under investigation. All crystals in the r222 opto-geometric configuration, present the same behavior with frequency as that of the 0.8%-Zr-doped LN single crystal reported in figure 2. By cons, in the r113 and r333 configuration, the contribution of the piezo-optic effect was observed smaller that the accuracy of the methods for all the crystals under studies. Thus, we can experimentally consider that when the electric field is applied onto samples in the z direction, r!!"= r!!"! = r!!"! , with xx =11 or 33.
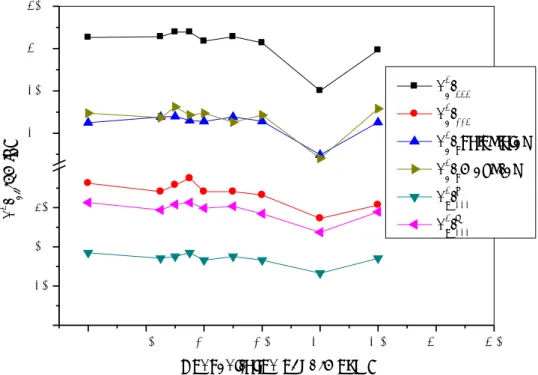
The dependence of all clamped and unclamped EO coefficients, on the molar Zirconium concentration is shown in figure 3 and presented in Table 1 and Table 2. The coefficients obtained experimentally are given within accuracy better than 10% with the different methods used in this study.
In these results, the effective EO coefficient n!!r! defined by
n!!r! = n!!r!!! – n!!r!!" (3)
is obtained by direct measurements using the Sénarmont set-up and, also calculated by equation 3, allowing the check of the methods and the results.
The curves in figure 3 highlight the quasi-constant values, within the associated error-bars for all the electro-optic coefficients with dopant concentration except for the sample doped with 2 mol% of zirconium where a kink exists, which corresponds to a lower value of the coefficients presenting a change greater than the amplitude of the experimental uncertainty. This concentration of 2 mol% zirconium in LN crystal can be considered as the threshold concentration and could suggest the existence of a doping-induced lattice reorganization.
In ferroelectric inorganic materials, it was established that the EO properties are linked to the linear dielectric properties and their temperature or frequency dependence reproduced the behavior of the dielectric permittivity ε [34]. This relationship between EO coefficients and permittivity also exist in their dependence on crystal composition or dopant concentration [35]. It is for this reason that we have experimentally measured the dielectric permittivity for all samples in the studied zirconium doped series. These measurements were done in a large frequency range up to 1 GHz by means of the impedance analyzers HP4151 and HP4191A. We can note that the behavior of the dielectric permittivity is the same observed in the case of the effective EO coefficients with frequency for all samples for as well.
However, contrary to rc coefficient, where the difference between rcT et rcS is smaller than the accuracy of the methods, the difference ∆𝜀!! between the dielectric permittivities ε33T and ε33Sgives a delta epsilon
equal to 5. This variation has to be found in the electromechanical process mainly originate from the elastic stiffness contribution.
6
1234567890
NAMES'16 IOP Publishing
IOP Conf. Series: Journal of Physics: Conf. Series 879 (2017) 012004 doi :10.1088/1742-6596/879/1/012004
Figure 3. High and low frequency effective EO coefficients n3r
eff versus Zr concentration in congruent LN.
Figure 4. Dielectric constants versus Zr concentration in congruent LN.
Results for the unclamped and clamped dielectric constants obtained for all crystals are plotted in figure 4 and reported in Table 1 and Table 2.
0,0 0,5 1,0 1,5 2,0 2,5 3,0 3,5 0 25 50 75 200 250 300 350 n 3 r eff (p m /V )
C oncentra tion of Z r (m ol % )
n3er333 n3er113 n3ercca lcula ted n3ercm es ured n3orS222 n3orT222 0,0 0,5 1,0 1,5 2,0 2,5 3,0 20 30 50 60 70 80 90 ε
C oncentra tion of Z r (m ol% )
ε33Τ
ε33S
ε22T
7
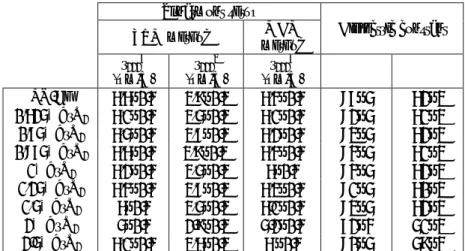
Table 1. Absolute values of the r222 EO coefficient and related parameters of LN:Zr crystals as function of zirconium concentration: The EO coefficient r222 is obtained when the beam propagates along the c-axis of the sample and an external electric field was applied along the a-axis (or equivalently the b-axis). The EO coefficients at constant stress (rT) were obtained by both MDM and TRM methods and at constant strain (rS) by the TRM method, at 633 nm and at room temperature. The dielectric permittivities ε22T and ε22S were measured at room temperature.
Sénarmont setup Dielectric constant TRM method method MDM r222T (pm/V) r222 S (pm/V) r222 T (pm/V) 𝜀!!! 𝜀!!! LN-Cg 6,6±0.4 3,9±0.3 6,4±0.4 87±5 62±3 0,625%ZrO2 6,1±0.4 3,5±0.3 6,1±0.4 82±5 61±3 0,75%ZrO2 6,5±0.4 3,7±0.3 6,2±0.4 83±5 62±3 0,875%ZrO2 6,6±0.4 3,9±0.3 6,4±0.4 84±5 61±3 1%ZrO2 6,2±0.4 3,5±0.3 6±0.4 84±5 62±3 1,25%ZrO2 6,4±0.4 3,7±0.3 6,3±0.4 81±5 60±3 1,5%ZrO2 6±0.4 3,5±0.3 6.1±0.4 83±5 62±3 2%ZrO2 5±0.4 2.9±0.3 5.2±0.4 72±4 51±3 2.5%ZrO2 6,1±0.4 3,6±0.3 6 ±0.4 80±5 59±3
Table 2. Absolute values of the third column of the electro-optic tensor r113 and r333 EO coefficients of LN:Zr crystals as function of zirconium concentration measured by interferometric setup at 633 nm. Configuration obtained when a light propagation along the axis (b axis) and an external electric field was applied along the c-axis. The combined coefficient rc is measured by Sénarmont setup is compared with the calculated values given b y Eq. 3. The dielectric permittivities ε33T and ε33S were measured at room temperature.
Interferometric setup Sénarmont setup
Dielectric constant
TRM method TRM method MDM
method 𝑟!!"!,! 𝑟
!!!!,! 𝑟!!,! (calc.) 𝑟!!,! (meas.) 𝑟!! (meas.) 𝜀!!! 𝜀!!!
LN-Cg 8.5±0.6 29.4±2 20±2 21±1 20.7±1 35±2 30±2 0,625%ZrO2 8±0.6 29.5±2 20.6±2 20.5±1 20.3±1 34.5±2 29.8±2 0,75%ZrO2 8.4±0.6 30±2 20.7±2 21.7±1 21.3±1 35.5±2 30.3±2 0,875%ZrO2 8.8±0.6 30±2 20.2±2 20.8±1 20.8±1 34.7±2 30±2 1%ZrO2 8±0.6 29±2 20.1±2 21±1 21.2±1 35±2 30±2 1,25%ZrO2 8±0.6 29.5±2 20.6±2 20±1 20.3±1 34.5±2 30±2 1,5%ZrO2 7.8±0.6 28.8±2 20.1±2 20.8±1 20.6±1 33.3±2 29.5±2 2%ZrO2 6.4±0.4 23.5±2 16.4±2 16±1 16.2±1 29±2 25±2 2.5%ZrO2 7.2±0.5 28±2 20±2 21.5±1 21.2 ±1 36±2 30.5±2
We have demonstrated in our experiments that both the unclamped and clamped effective EO coefficients and the dielectric permittivity present a kink at a threshold zirconium concentration of around 2 mol%. We can note that this concentration corresponds to the threshold concentration determined in absorption measurements. However, Kovacs et al. have shown that the absorption edge is affected by the [Li]/[Nb] ratio [31]. Therefore, below the threshold concentration, the reduction in the absorption edge can be attributed to the increase of the [Li]/[Nb] ratio due to the substitution by Zr ions of Nb ions on lithium site, i.e. on antisite NbLi. The increase of the absorption edge for higher
8
1234567890
NAMES'16 IOP Publishing
IOP Conf. Series: Journal of Physics: Conf. Series 879 (2017) 012004 doi :10.1088/1742-6596/879/1/012004
concentration, above the threshold concentration, is linked to the disorder induces by zirconium incorporation on both Li and Nb sites and to the necessary charge compensation process. Thus, the threshold concentration can be explained by the existence of doping-induced lattice reorganization. The threshold observed in the EO and optical properties is in coincidence with the photorefractive concentration threshold observed by straightforward photorefractive measurements in Ref. [36].
Conclusion
We have determined the unclamped and clamped electro-optic (EO) coefficients of zirconium doped lithium niobate crystals, for two opto-geometric configurations of samples. Two optical arrangements, Mach-Zehnder and Sénarmont were used for the determination of all coefficients of the electro-optic tensor of the LN:Zr crystal series from pure congruent to zirconium doped with 2.5 mol% of ZrO2 in the crystal considering a distribution coefficient of zirconium closer to one. The first configuration, with an electric field parallel to the crystallographic c axis involves r113 and r333 direct coefficients, determined with the interferometric setup, and rc combined coefficient measured with the Sénarmont arrangement. The second configuration, with an electric field parallel to the crystallographic a or b axis allows the determination of the r222 coefficient with the Sénarmont setup.
Experimental results clearly highlight a specific zirconium concentration that can be considered as a threshold concentration where the EO properties decrease of about 20% in all opto-geometric configurations. This threshold appears in crystal doped with 2 mol% of zirconium.
The EO results were analyzed by the consideration of the dielectric properties of the crystals, which are also characterized in this work. The experiments show that the low and high frequencies dielectric coefficients, present also a kink at the concentration 2 mol%. The presented analysis corroborates the existence of a doping-induced reorganization of the lattice in the doped LN crystal appearing at a zirconium concentration of 2 mol%. This concentration value corresponds to a threshold for numerous physical properties.
The present study confirms the interest for electro-optic applications of all zirconium-doped LN crystals and, when considering also the photorefractive sensitivity, for laser applications with the crystal doped at the concentration threshold value equal to 2 mol% of zirconium.
References
[1] Räuber A, 1978 in E. Kaldis E (Ed.), Current Topics in Material Sciences, North-Holland
Publishing, Amsterdam, 481.
[2] Krätzig E, Schirmer O F, 1988 in P. Gunter, J.-P. Huignard (Eds.), Photorefractive Materials
and Their Applications I, Springer, Berlin – Heidelberg, 131.
[3] Volk T, Wöhlecke M 1998 Ferroelectr. Rev. B 195.
[4] Volk T, Wöhlecke M 2008 Springer Series in Material Science 115. [5] Kostritskii S M, Aillerie M 2012 J. Appl. Phys.111 013519
[6] Chah K, Aillerie M, Fontana M D, Malovichko G, Kokanyan E 1996 Ferroelectrics 186 13-16. [7] Chah K, Aillerie M, Fontana M D, Malovichko G, Betzler K, Kokanyan E 1997 Opt. Comm.
136 231-234.
[8] Chah K, Fontana M D, Aillerie M, Bourson P, Malovichko G Appl. Phys. B: Optics and Lasers
67 65-71.
[9] Chah K, Aillerie M, Fontana M D, Malovichko G 2000 Opt. Comm. 176 261-265.
[10] Malovichko G I, Grachev V G, Kokanyan E P, Schirmer O P, Betzler K, Gather B, Jermann F, Klauer S, Schlarb U, Wohlecke M1993 Appl. Phys. A. Solids and Surfaces 56 103.
[11] Abdi F, Aillerie M, Bourson P, Fontana M D, Polgar K 1986 J. Appl. Phys. 84(4) 2251. [12] Abdi F, Aillerie M, Bourson P, Fontana M D J. of Appl. Phys. 2009 106(3) 033519. [13] Polgár K, Kovács L, Földvári I, Cravero I 1986 Solid State Comm. 59(6) 375.
[14] Aillerie M, Bourson P, Mostefa M, Abdi F, Fontana M D 2013 J. Physics 416 012001. [15] Volk T, Pryalkin V, Rubinina N 1990 Opt. Lett.15 996.
[16] Aillerie M, Bourson P, Mostefa M, Abdi F, Fontana M D 2013 J. Phys. 416 012002. [17] Schlarb U, Betzler K 1994 Phys. Rev. B 50 751.
9
[18] Iyi N, Kitamura K, Yajima Y, Kimura S, Furukawa Y, Sato M 1995 J. Solid State Chem.118(1) 148.
[19] Volk T, Maximov B, Sulyanov S, Rubinina N, Abdi F, Aillerie M, Bourson P, Fontana M D 1999 OSA Trends in Optics and Photonics 27 145.
[20] Abdi F, Aillerie M, Fontana M D, Bourson P, Volk T, Maximov B, Sulyanov S, Rubinia N, Wöhlecke M 1999 Appl.Phys. B 68 795.
[21] Kong Y, Wen J, Wang H 1995 Appl. Phys. Lett. 66 280.
[22] Yamamoto J.K.,. Kitamura K, Iyi N., Kimura S., Furukawa Y., Sato M. 1992 Appl.
Phys. Lett. 61, 2156.
[23] Petrosyan A M, Hovsepyan R K, Kokanyan E P, Feigelson R S 2000 Proc. SPIE 4060 106 [24] Kokanyan E P, Razzari L, Cristiani I, Degiorgio V., Gruber J., 2004 Appl. Phys. Lett. 84 1880 [25] Li S, Liu S, Kong Y, Deng D, Gao G, Li Y, Gao H, Zhang L, Hang Z, Chen S, Xu J 2006 J.
Phys. Condens. Matter 18 3527.
[26] Minzioni P, Cristiani I, Yu J, Parravicini J, Kokanyan E P, Degiorgio V 2007 Opt. Express 15 14171.
[27] Aillerie M, Abarkan M, Kostritskii S M, Kokanyan E P 2014 Opt. Mat. 36(7) 1238.
[28] Abarkan M, Aillerie M, Kokanyan N, Teyssandier C, Kokanyan EP 2014 Opt. Mat. Express
4(1) 179.
[29] Argiolas N., Bazzan M., Ciampolillo M.V., Pozzobon P., Sada C., Saoner L., Zaltron A.M., Bacci L., Minzioni P., Nava G., Parravicini J., Yan W., Cristiani I.,.Degiorgio V. 2010 J. Appl.
Phys. 108, 093508.
[30] Abarkan M, Aillerie M, Salvestrini J P, Fontana M D, Kokanyan E P 2008 Appl. Phys B 92 603. [31] Kovacs L, Ruschhaupt G, Polgar K, Corradi G, Wohlecke M 1997Appl. Phys. Lett. 70(21)
2801.
[32] Aillerie M, Theofanous N, Fontana M D 2000 Appl. Phys. B. 70 317.
[33] Abarkan M, Salvestrini J P, Fontana M D, Aillerie M 2003 Appl. Phys. B 76 765. [34] Salvestrini J P, Fontana M D, Wyncke B, Brehat F 1997 Nonlinear Optics 17 271. [35] Kaminow I P 1974 An Introduction to Electro-Optic Devices Academic Press.
[36] Nava G, Minzioni P, Yan W, Parravicini J, Grando D, Musso E, Cristiani I, Argiolas N, Bazzan M, Ciampolillo M V, Zaltron A, Sada C, Degiorgio V 2011 Opt. Mater. Express 1(2) 270.