HAL Id: hal-01885363
https://hal.archives-ouvertes.fr/hal-01885363
Submitted on 1 Oct 2018
HAL is a multi-disciplinary open access
archive for the deposit and dissemination of
sci-entific research documents, whether they are
pub-lished or not. The documents may come from
teaching and research institutions in France or
abroad, or from public or private research centers.
L’archive ouverte pluridisciplinaire HAL, est
destinée au dépôt et à la diffusion de documents
scientifiques de niveau recherche, publiés ou non,
émanant des établissements d’enseignement et de
recherche français ou étrangers, des laboratoires
publics ou privés.
Standards Influences Interlaboratory Comparison of BK
Virus DNA Load Measurement
Morgane Solis, Mariam Meddeb, Charlotte Sueur, Pilar Domingo-Calap, Eric
Soulier, Angeline Chabaud, Peggy Perrin, Bruno Moulin, Seiamak Bahram,
Francoise Stoll-Keller, et al.
To cite this version:
Morgane Solis, Mariam Meddeb, Charlotte Sueur, Pilar Domingo-Calap, Eric Soulier, et al.. Sequence
Variation in Amplification Target Genes and Standards Influences Interlaboratory Comparison of BK
Virus DNA Load Measurement. Journal of Clinical Microbiology, American Society for Microbiology,
2015, 53 (12), pp.3842-3852. �10.1128/jcm.02145-15�. �hal-01885363�
Sequence Variation in Amplification Target Genes and Standards
Influences Interlaboratory Comparison of BK Virus DNA Load
Measurement
Morgane Solis,a,bMariam Meddeb,aCharlotte Sueur,a,bPilar Domingo-Calap,bEric Soulier,bAngeline Chabaud,aPeggy Perrin,c Bruno Moulin,b,cSeiamak Bahram,bFrançoise Stoll-Keller,a,bSophie Caillard,b,cHeidi Barth,a,bSamira Fafi-Kremera,bon behalf of the French BKV Study Group
Laboratoire de Virologie, Hôpitaux Universitaires de Strasbourg, Strasbourg, Francea; Inserm UMR S1109, LabEx Transplantex, Fédération de Médecine Translationnelle de
Strasbourg (FMTS), Université de Strasbourg, Strasbourg, Franceb; Département de Néphrologie-Transplantation, Hôpitaux Universitaires de Strasbourg, Strasbourg,
Francec
International guidelines define a BK virus (BKV) load of >4 log10copies/ml as presumptive of BKV-associated nephropathy
(BKVN) and a cutoff for therapeutic intervention. To investigate whether BKV DNA loads (BKVL) are comparable between lab-oratories, 2 panels of 15 and 8 clinical specimens (urine, whole blood, and plasma) harboring different BKV genotypes were dis-tributed to 20 and 27 French hospital centers in 2013 and 2014, respectively. Although 68% of the reported results fell within the
acceptable range of the expected resultⴞ0.5 log10, the interlaboratory variation ranged from 1.32 to 5.55 log10. Polymorphisms
specific to BKV genotypes II and IV, namely, the number and position of mutations in amplification target genes and/or deletion in standards, arose as major sources of interlaboratory disagreements. The diversity of DNA purification methods also contrib-uted to the interlaboratory variability, in particular for urine samples. Our data strongly suggest that (i) commercial external quality controls for BKVL assessment should include all major BKV genotypes to allow a correct evaluation of BKV assays, and (ii) the BKV sequence of commercial standards should be provided to users to verify the absence of mismatches with the primers and probes of their BKV assays. Finally, the optimization of primer and probe design and standardization of DNA extraction methods may substantially decrease interlaboratory variability and allow interinstitutional studies to define a universal cutoff for presumptive BKVN and, ultimately, ensure adequate patient care.
T
he emergence of BK virus-associated nephropathy (BKVN) as a major cause of graft dysfunction and loss in kidney trans-plant recipients (KTR) arises from the use of highly potent immu-nosuppressive drugs (1–3). This is a growing medical problem as the population of transplant recipients continues to increase. In Europe and the United States, the number of kidney transplanta-tions has increased up to 50% in the last 20 years (www.kidney .niddk.nih.gov andhttp://www.era-edta.org). BKV reactivation or reinfection occurs in 40 to 50% of KTR, followed by BKVN in 6.6% of KTR at 5 years posttransplant, ultimately leading to graft dysfunction and loss in up to 50% of cases (4). The diagnosis of BKVN is based on the documentation of viral cytopathic effects observed in tubular epithelial cells accompanied by inflammatory cell infiltration after renal biopsy (5,6). Immunohistochemistry with SV40 staining is the gold standard for diagnosing definitive BKVN (7). Nevertheless, in the early stages of BKVN, kidney allo-graft biopsy results may be falsely negative at an estimated rate of 10 to 30% (8). Prospective studies showed that high BKV viruria usually precedes viremia by 4 to 12 weeks, with a sustained BKV viremia above the threshold of 4 log10copies/ml defined aspre-sumptive of BKVN, with a positive predictive value of⬎80% (9,
10). These studies showed that BKVN can be effectively and safely prevented using a preemptive reduction in immunosuppression (11, 12). Therefore, European and Kidney Disease Improving Global Outcomes (KDIGO) guidelines recommend monthly KTR screening for BKV replication in urine and plasma specimens in the first 6 months posttransplant and then every 3 months until 2 years posttransplant (13,14) to guide therapeutic intervention for KTR with presumptive BKVN.
Monitoring of BKV replication has been improved by the de-velopment of real-time quantitative PCR (qPCR) assays showing high sensitivity and specificity (15). However, the wide variety of available qPCR assays and the lack of international standards limit interlaboratory comparison (16,17).
The distribution of proficiency panels constitutes a relevant approach to assess the variability of BK virus DNA load (BKVL) and to compare interlaboratory results, as shown for other oppor-tunistic viruses, such as cytomegalovirus (CMV) and Epstein-Barr virus (EBV) (18,19). High interlaboratory variability prompted international collaboration groups to establish WHO reference standards for these viruses (20,21).
Received 7 August 2015 Returned for modification 11 September 2015 Accepted 6 October 2015
Accepted manuscript posted online 14 October 2015
Citation Solis M, Meddeb M, Sueur C, Domingo-Calap P, Soulier E, Chabaud A, Perrin P, Moulin B, Bahram S, Stoll-Keller F, Caillard S, Barth H, Fafi-Kremer S, on behalf of the French BKV Study Group. 2015. Sequence variation in amplification target genes and standards influences interlaboratory comparison of BK virus DNA load measurement. J Clin Microbiol 53:3842–3852.
doi:10.1128/JCM.02145-15. Editor: M. J. Loeffelholz
Address correspondence to Samira Fafi-Kremer, samira.fafi-kremer@unistra.fr. M.S., M.M., and C.S. contributed equally to this work.
Supplemental material for this article may be found athttp://dx.doi.org/10.1128 /JCM.02145-15.
Copyright © 2015, American Society for Microbiology. All Rights Reserved.
on October 1, 2018 by guest
http://jcm.asm.org/
In this study, we assessed BKVL variability in several French hospital centers that conduct nearly 90% of the kidney transplan-tation activity in France. Two panels of clinical samples, including BKV genotype II and IV for the first time, were distributed to compare the performances of individual laboratories and analyze factors that may influence interlaboratory comparison (22). MATERIALS AND METHODS
Panel constitution and preparation. The 2013 panel consisted of 15
clin-ical samples, including 5 urine (BKV13-01 to BKV13-05), 5 whole blood (WB) (BKV13-06 to BKV13-10), and 5 plasma (BKV13-11 to BKV13-15) specimens. Positive samples were collected from 20 patients, including 14 kidney, 4 lung, and 2 hematopoietic stem cell transplant recipients. The 2014 panel included 4 urine (BKV14-01, BKV14-03 [a replicate of 01], 02, and 04), 2 WB (05 and BKV14-06), and 2 plasma (BKV14-07 and BKV14-08) specimens. Positive sam-ples in the 2014 panel were collected from 4 kidney transplant recipients and 1 hematopoietic stem cell transplant patient. Clinical samples of the same matrix and with equivalent DNA viral loads were pooled to prepare adequate volumes of panel samples. The samples were homogenized be-fore and after pooling by gentle mixing using a tube rotator for 20 min. Samples with mixed genotypes were obtained by mixing 2 to 3 single-genotype samples. As shown inTable 1, 11 BKV-positive samples harbor-ing a sharbor-ingle BKV genotype and 8 samples harborharbor-ing multiple BKV geno-types were chosen to represent a wide range of BKV DNA concentrations. The negative samples (BKV13-08, BKV13-11, BKV14-06, and BKV14-07) were prepared from plasma and WB specimens collected from KTR who tested negative for BKV DNAⱖ3 months before and 3 months after the collection date.
The panel samples were aliquoted, coded, and frozen at⫺80°C until shipment to the participating laboratories. Aliquots from the same panel were prepared the same day by a single technician using 1 calibrated pi-pette to minimize any variation and possible errors in preparations. Urine and blood samples were collected at the Strasbourg University Hospital (Strasbourg, France) and previously tested for BKV by our routine diag-nostic testing with the CE-marked BK virus R-gene kit (bioMérieux, Marcy l’Etoile, France). The performance of our routine test is evaluated annually by the Quality Control for Molecular Diagnostics (QCMD) (23). This study was approved by the institutional review board of Strasbourg University Hospital.
Study participants. Twenty and 27 French hospital laboratories
per-forming diagnostic testing of BKVL were invited and agreed to participate in this study in 2013 and 2014, respectively. Each participant completed a questionnaire detailing the procedure employed for BKV testing. Panel samples were shipped by a laboratory-specialized courier. The partici-pants were asked to test the samples as if they were routine diagnostic specimens and to return the results within 10 weeks.
BKV genome sequencing. Amplification of the small T-antigen gene
(StAg) and the BKV capsid viral protein 1 gene (VP1) was performed, as previously described (23). The large T-antigen gene (LTAg) was sequenced using primers BK6F (5=-GCCATTCCTTGCAGTACAGG-3= [positions 4859 to 4878]) and BK6R (5=-GAGCTCATGGACCTTTTAGGC-3= [positions 5120 to 5100]). BKV genotyping was performed as previously described (24).
Results analysis and statistics. For qualitative analysis of the data
sets, results reported as negative, undetectable, or below the limit of detection were considered negative, while positive values reported with an absolute quantification or above the limit of detection were considered positive. False-positive and false-negative results and
re-TABLE 1 Quantitative results of the 2013 and 2014 BKV panelsa
Sample no. by source
BKV genotype(s)
Quantitative results (log10copies/ml) for:
All data sets (maximum n⫽ 28)
Commercial assays (maximum
n⫽ 23) In-house assays (maximum n⫽ 5)
GM⫾ SD Spread (range) GM⫾ SD Spread (range) GM⫾ SD Spread (range)
Urine BKV13-01 I 4.79⫾ 0.64 2.23 (3.92–6.15) 4.68⫾ 0.53 2.12 (4.03–6.15) 5.11⫾ 0.84 1.99 (3.92–5.91) BKV13-02 I 6.14⫾ 0.45 1.89 (5.34–7.23) 5.97⫾ 0.28 1.05 (5.34–6.39) 6.65⫾ 0.49 1.12 (6.11–7.23) BKV13-03 I, IV 6.98⫾ 0.71 3.20 (5.28–8.48) 6.80⫾ 0.65 2.20 (5.28–7.48) 7.52⫾ 0.63 1.62 (6.86–8.48) BKV13-04 II, IV 8.81⫾ 0.67 2.60 (7.72–10.32) 8.80⫾ 0.41 1.23 (8.18–9.41) 8.85⫾ 1.18 2.60 (7.72–10.32) BKV13-05 I 9.32⫾ 0.65 2.32 (8.12–10.44) 9.23⫾ 0.48 1.50 (8.45–9.95) 9.55⫾ 0.96 2.32 (8.12–10.44) BKV14-01 IV 7.37⫾ 0.66 3.30 (5.32–8.62) 7.47⫾ 0.53 2.00 (6.62–8.62) 6.90⫾ 1.03 2.63 (5.32–7.95) BKV14-02 I 9.85⫾ 0.47 2.10 (8.54–10.64) 9.87⫾ 0.49 2.10 (8.54–10.64) 9.75⫾ 0.39 0.97 (9.33–10.30) BKV14-03 IV 7.28⫾ 0.64 2.98 (5.36–8.34) 7.37⫾ 0.54 2.06 (6.28–8.34) 6.89⫾ 0.99 2.63 (5.36–7.99) BKV14-04 II 8.58⫾ 1.07 5.55 (4.58–10.13) 8.91⫾ 0.31 1.38 (8.12–9.50) 7.25⫾ 2.29 5.55 (4.58–10.13) WBb BKV13-06 I, II, IV 3.69⫾ 0.84 3.43 (1.85–5.28) 3.52⫾ 0.78 3.18 (1.85–5.03) 4.30⫾ 0.89 2.00 (3.28–5.28) BKV13-07 I, IV 4.91⫾ 0.50 1.98 (4.21–6.19) 4.75⫾ 0.35 1.10 (4.21–5.31) 5.39⫾ 0.57 1.61 (4.58–6.19) BKV13-09 I, II 4.96⫾ 0.61 4.91 (3.72–6.61) 4.74⫾ 0.44 1.72 (3.72–5.44) 5.63⫾ 0.57 1.39 (5.22–6.61) BKV13-10 I, IV 3.72⫾ 0.72 2.67 (2.51–5.18) 3.54⫾ 0.65 2.44 (2.51–4.95) 4.24⫾ 0.71 1.84 (3.34–5.18) BKV14-05 I 3.99⫾ 0.52 2.60 (2.23–4.83) 3.88⫾ 0.52 2.60 (2.23–4.83) 4.50⫾ 0.14 0.36 (4.25–4.61) Plasma BKV13-12 I 4.99⫾ 0.63 2.81 (4.35–7.16) 4.75⫾ 0.26 1.03 (4.35–5.38) 5.71⫾ 0.83 2.03 (5.13–7.16) BKV13-13 I 4.26⫾ 0.48 1.88 (3.52–5.40) 4.07⫾ 0.32 1.32 (3.52–4.84) 4.85⫾ 0.38 1.03 (4.37–5.40) BKV13-14 I, IV 6.34⫾ 0.45 1.73 (5.79–7.52) 6.14⫾ 0.24 0.97 (5.79–6.76) 6.93⫾ 0.39 0.95 (6.57–7.52) BKV13-15 I, IV 6.07⫾ 0.52 2.12 (5.23–7.35) 5.91⫾ 0.41 1.67 (5.23–6.90) 6.55⫾ 0.55 1.47 (5.88–7.35) BKV14-08 I 6.27⫾ 0.33 1.32 (5.47–6.79) 6.20⫾ 0.31 1.30 (5.47–6.77) 6.61⫾ 0.17 0.37 (6.42–6.79)
aGeometric mean (GM), SD, and spread were calculated with quantitative positive results reported from all participants. Results reported as negative or under or over the limit of
quantification were excluded. BKV genotypes constituting each panel sample are reported.
bWB, whole blood.
on October 1, 2018 by guest
http://jcm.asm.org/
sults reported outside the limits of quantification were excluded from the quantitative analysis.
For each sample, the expected viral load to which all results were com-pared was defined as the geometric mean of the positive quantitative re-sults reported by all participating laboratories. Variability according to viral load, matrix, and genotype was compared based on the standard deviations within each group, as previously described (25). Nonparamet-ric tests (Mann-Whitney and Kruskal-Wallis tests) were used, and pair-wise multiple comparisons between groups were analyzed using Dunn’s multiple-comparison test. All statistical analyses were performed using the GraphPad Prism 6 software (San Diego, CA, USA).
RESULTS
Characteristics of participating laboratories and utilized assays.
Twenty-seven French hospital laboratories were sent the 2014
8-sample study panel, including the 20 laboratories that partici-pated in the 2013 15-sample study. Two laboratories performing different assays were sent⬎1 panel. Nineteen (95%) and 25 (93%) laboratories returned results in 2013 and 2014, respectively. A total of 47 data sets were used for the final analysis, including 19 from 19 laboratories in 2013 and 28 from 25 laboratories in 2014. Marked variability was observed in terms of techniques, target genes, matrix used for the blood compartment, and DNA extrac-tion methods (Fig. 1). Most laboratories (81%) used commercial assays (Fig. 1A), including the BK virus R-gene kit (n⫽ 15) (bio-Mérieux, Marcy l’Etoile, France), the RealStar BKV PCR kit (n⫽ 3) (Altona Diagnostics/Eurobio, Courtaboeuf, France), the Light-Mix polyomaviruses JC and BK kit (n⫽ 2) (TibMolBiol, Berlin,
FIG 1 Diversity of diagnostic conditions among the participants. Participating laboratories were asked to describe the type (A) and target (B) of the qPCR assay
routinely used for BK viral load quantification, the matrix routinely tested in the blood compartment (C), and the extraction methods used for DNA purification (D). For laboratories using different extraction methods for urine and blood samples, both techniques were considered in our analysis. The percentages of participants are indicated for each pie chart.
Solis et al.
on October 1, 2018 by guest
http://jcm.asm.org/
Germany), the artus BK virus RG PCR kit (n⫽ 2) (Qiagen GmbH, Hilden, Germany), and the BKV ELITe MGB kit (n ⫽ 1) (ELITechGroup Molecular Diagnostics, Puteaux, France). Four in-house assays, including 2 previously published in the literature (26,27) and one adapted from Hoffman et al. (17) were used by 5 (19%) laboratories. The unpublished assay (S. Rogez, S. Hantz, and S. Alain) targeted the VP1 gene using the primer set forward (5=-TTTGGGACTTTCACAGGAGG-3=) (positions 2227 to 2246, Dunlop sequence]) and reverse (5=-GCCTCTCCACTGTTGTGT TCC-3= [positions 2409 to 2389, Dunlop sequence]), and the probe (5=-TGTTTCAGCTGCTGATATTTGTGGCC-3= [posi-tions 2346 to 2371, Dunlop sequence]). Most of the assays tar-geted the StAg or LTAg gene (Fig. 1B). The 5 laboratories perform-ing in-house assays used different standard materials: BKV strain MM quantitated DNA control (Advanced Biotechnologies, tebu-bio, Le Perray-en-Yvelines, France) (ABI control) (n⫽ 2), which is a whole BKV genome linearized at the BamHI site in the StAg gene; the AmpliRun BK virus DNA control (Vircell S.L, Granada, Spain) (Vircell control) (n⫽ 2), which is also a whole viral ge-nome; or serial dilutions of qPCR amplification product cloned into a vector (n⫽ 1). Each commercial kit contained its own standard material, the composition of which is proprietary.
Amplicon sizes varied from 75 to 274 bp (see Table S1 in the supplemental material). All participating laboratories routinely performed BKVL assays with urine samples, whereas 62% of the laboratories used WB samples, and 38% used plasma samples for viral load determination in the peripheral blood compartment (Fig. 1C). Nine different automated DNA extraction platforms, 89% of which were based on a magnetic bead method, were used (Fig. 1D). Seventy-seven percent of the laboratories used the same extraction method for urine and peripheral blood matrices, while the remaining 23% used different extraction platforms depending on the matrix, hindering normalization of the results (see Table S2 in the supplemental material). Regarding the urine samples, most laboratories used resuspended or vortexed material, and no pellet concentrates were used.
Among the 25 participants that returned results, 22 (88%) par-ticipate annually in the QCMD program, including those using in-house assays.
High concordance of qualitative results. Data from both
pan-els were pooled for qualitative analysis; only 4 out of 509 reported results were incorrect. All samples with an expected BKVL of⬎4.0 log10copies/ml were detected as positive by all participants. One
false-negative result was reported by 1 laboratory using an in-house qPCR assay targeting the VP1 gene (positions 2227 to 2409) for a sample with an expected BKVL of 3.69⫾ 0.84 log10copies/
ml. Three laboratories reported false-positive results for BKV13-08, BKV13-11, and BKV14-07, respectively; the 3 participants used different commercial qPCR assays targeting StAg or LTAg.
Important variability of quantitative results. The
quantita-tive results are summarized inTable 1andFig. 2. The geometric mean BKVL ranged from 3.69 to 9.85 log10copies/ml. The
differ-ence between the highest and the lowest viral loads reported by all participants varied from 1.32 to 5.55 log10, with a mean value of
2.61 log10. The BKVL standard deviation (SD) ranged from 0.45 to
1.07 log10copies/ml. The greatest SD was observed for the BKV
genotype II sample.
Technical variability of⬍0.5 log10is considered acceptable (18,
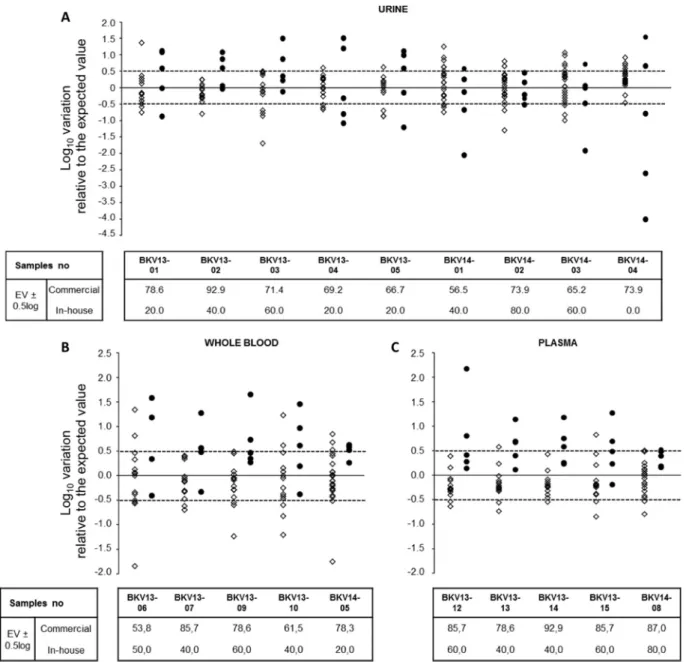
28) and of low clinical relevance (29). Thus, we compared labora-tory performance by calculating the percentage of results falling
within the acceptable variation of⫾0.5 log10relative to the
ex-pected value. Sixty-eight percent of the reported results fell within the acceptable range (Fig. 3). Interestingly, for a plasma sample (BKV genotype I) approaching the cutoff for therapeutic inter-vention (BKV13-13, with an expected value of 4.26 log10copies/
ml), 74% of laboratories reported a BKVL ofⱖ4 log10copies/ml
(range, 4.00 to 5.40 log10copies/ml), while only 26% reported
BKVL of⬍4 log10copies/ml (range, 3.52 to 3.98 log10copies/ml).
The variability of BKVL in the 3 matrices (urine, WB, and plasma) was not statistically different (P⫽ 0.08, Kruskal-Wallis test) (Fig. 4). Intralaboratory variability investigated by the sample replicated in the 2014 panel (BKV14-01/03) was significantly lower than the interlaboratory variability (SD, 0.10 versus 0.65;
P⫽ 0.02, Mann-Whitney test).
Number and position of BKV polymorphisms impact BKVL quantification. Several factors, including commercialized
prim-ers and probes, DNA extraction methods, amplification target genes, and standard materials, were previously associated with changes in viral load measurement (17,30).
In our study, commercial assays demonstrated less variabil-ity and better performance according to the above-mentioned criterion, with 76% of the results falling within the acceptable range versus 44% for in-house assays (P ⬍ 0.0001, Mann-Whitney test). We further compared the results of the 2014 panel (which included 8 data sets of commercial assays other than the R-gene kit). The expected values obtained by labora-tories using other commercial assays were not statistically dif-ferent from those of laboratories using the R-gene kit, suggest-ing that the better performance of commercial assays was not biased by the high representativeness of the R-gene kit in our study (see Fig. S1 in the supplemental material). Interestingly, in a comparison of the results reported by laboratories using the same qPCR assay, we still observed differences up to 2 log10,
suggesting that pre-qPCR steps, i.e., DNA purification, may influence interlaboratory variability.
Three DNA extraction instruments, NucliSENS easyMAG (bioMérieux, Marcy l’Etoile, France) (37%), QIAsymphony SP (Qiagen GmbH, Hilden, Germany) (19%), and MagNA Pure LC 2.0 (Roche Diagnostics, France) (15%), were predomi-nantly used by the participants. The results obtained from 12 and 15 users of the R-gene qPCR assay in 2013 and 2014, re-spectively, were analyzed depending on the extraction method. The performance of DNA extraction was significantly different between the 3 platforms (P⬍ 0.001, Kruskal-Wallis test). The MagNA Pure LC showed lower performance for DNA extrac-tion in urine samples than that with both QIAsymphony and easyMAG extractors (P ⫽ 0.02 and ⬍0.001, respectively, Dunn’s multiple-comparison test) and for DNA extraction in plasma samples compared to QIAsymphony (P⫽ 0.03, Dunn’s multiple-comparison test). The QIAsymphony seemed to show a higher performance than the easyMAG extractor for WB sam-ple DNA extraction; however, this difference was at the limit of statistical significance (P⫽ 0.06, Dunn’s multiple-comparison test) (see Fig. S2 in the supplemental material).
To investigate whether polymorphisms in amplification target genes might lead to inaccurate BKVL measurement, the StAg,
LTAg, and VP1 gene sequences from samples harboring a single
genotype were aligned with the primers and probes of the in-house assays. One mismatch was detected in the probe-annealing site of the assay targeting LTAg (positions 4392 to 4567) (26) for
on October 1, 2018 by guest
http://jcm.asm.org/
samples 01/03, 01/02, 01/04, and BKV14-01/08, with no noticeable effect observed on BKVL measurement. In contrast, the assay targeting VP1 (positions 2227 to 2409) un-derestimated BKVL values by 1.98 and 0.79 log10for BKV14-01/03
(genotype IV) and BKV14-04 (genotype II) samples, respectively. Alignment of the VP1 primers and probe with VP1 sequence within the BKV14-01/03 sample revealed 5 mismatches, including 3 (G-T, T-T, and T-T) in the center of the forward primer, 1 (T-C) in the center of the reverse primer, and 1 mismatch (C-T) in the probe. Four mismatches were detected within the BKV14-04 sample, including 2 in the center of the forward primer, 1 at the 3= end of reverse primer, and 1 in the probe. In the assay tar-geting StAg (positions 4811 to 4895) (27), a sequence analysis of the BKV14-04 sample (genotype II) revealed 1 (G-T) and 2 (C-A and C-A) mismatches at the 3= ends of the forward and reverse primers, respectively, and an additional mutation
(A-T) at the 5= end of the probe. These mismatches are likely to significantly hinder annealing of the primers and amplification of the target DNA, and they led to BKVL underestimation by 2.61 log10.
Interestingly, 1 laboratory provided results close to the ex-pected values for all but 1 sample of the 2014 panel. The BKV load for BKV14-04 (genotype II) was indeed overestimated by 1.55 log10. This participant used an assay adapted from Hoffman et al.
(17) that was composed of a mixture of primers and probes tar-geting VP1 (V3A) (positions 2458 to 2525) and StAg (T3A) (po-sitions 4673 to 4770) simultaneously, in which the StAg primers and probe were slightly modified to improve amplification of BKV genotype II/III. As a reference material, this in-house assay used the ABI control corresponding to the BKV MM strain (GenBank accession no.V01109). Sequence analysis found no mutation in the VP1 target gene, while 2 mutations (C4724G and A4726G)
FIG 2 Histograms of reported quantitative values for the positive samples from both panels. BK viral loads are represented in 0.5-log10copies/ml intervals. Each
rectangle refers to the result of one data set. Each color represents a different technique. The results obtained using commercial techniques are shown in blue and green, whereas results from in-house methods are colored in orange, red, and purple. The expected value is determined for each sample by calculating the geometric mean of all reported data set values. Results were obtained for urine (A), whole-blood (B), and plasma (C) specimens.
Solis et al.
on October 1, 2018 by guest
http://jcm.asm.org/
were detected in the center of the probe of the StAg target gene for genotype I and IV samples. Sequence analysis of the ABI control found a deletion of 271 bp, including the StAg target gene. Hence, the VP1 primers and probe perfectly match genotype I samples, genotype IV samples, and the ABI control, while mismatches in
these samples and the deletion in the ABI control hinder StAg primers and probe annealing. In contrast, both VP1 and StAg target genes match the genotype II sample, leading to an overesti-mation of the BKVL. It should be noted that an erroneous infor-mation is reported for the ABI control sequence in the supplier’s
FIG 2 continued
on October 1, 2018 by guest
http://jcm.asm.org/
instructions online (tebu-bio, Le Perray-en-Yvelines, France). In-deed, the BKV MM plasmid is linearized in the StAg gene and not the VP1 gene.
Infection with multiple BKV genotypes was previously de-scribed for KTR (31,32). To further investigate whether this might impact BKVL quantification, variability between samples harbor-ing a sharbor-ingle genotype and those harborharbor-ing multiple genotypes was analyzed by comparing their respective SD (Table 1). No signifi-cant difference was observed between the 2 groups (P⫽ 0.11, Mann-Whitney test).
As several standard materials were used, there were not suffi-cient numbers in each group to allow any statistical comparison for all the data sets. In particular, each commercial kit used by the study participants contains its own standard material, the
compo-sition of which is proprietary. Nevertheless, we were able in our laboratory to test both panels by 4 out of the 5 commercial assays used in this study. For this intralaboratory comparison of com-mercial kits, assays were strictly conducted according to the man-ufacturers’ recommendations. In particular, the calibration of each assay was performed using the standard material included in the kit. DNA was purified using a single extraction platform. The standard materials included in the commercial kits did not require DNA extraction. The percentage of results within the acceptable range increased from 75% when the assays were performed in different laboratories to 100% when they were tested by the same laboratory (see Fig. S3 in the supplemental material), suggesting that pre-qPCR steps significantly contribute to interlaboratory variability, more so than standard materials.
FIG 3 Comparison of reported results using in-house and commercial assays. The log10variation in the reported results relative to the expected value (EV) was
calculated for each positive sample of the panel. The results for commercial and in-house assays are depicted by open diamonds and filled circles, respectively. The dashed lines indicate a difference of⫾0.5 log10relative to the EV. The tables specify the percentages of results in the interval EV⫾ 0.5 log10for commercial and
in-house assays. Results were obtained for urine (A), whole-blood (B), and plasma (C) specimens.
Solis et al.
on October 1, 2018 by guest
http://jcm.asm.org/
Analysis of the BKVL SD did not show any significant differ-ence between the 3 matrices (P⫽ 0.08, Kruskal-Wallis test). More specifically, no significant difference was observed between the 2 blood matrices, plasma and WB (P⫽ 0.11, Mann-Whitney test) (Table 1andFig. 4). Last, it has been suggested that levels of viral DNA, as measured by qPCR, may be dependent on the amplicon size (19,33). However, there were no sufficient data in each group to allow any statistical comparison.
DISCUSSION
BKVL quantification needs to be reproducible and comparable across time and techniques to ensure appropriate patient care. In this work, we demonstrate important interlaboratory variability for the monitoring of BKVL. We believe that this variability limits interinstitutional comparison and may lead to inadequate BKV infection monitoring and BKVN diagnosis and management.
The leading event of BKVN seems to be viral replication start-ing in tubular epithelial cells, followed by urothelial amplification and cross-feeding back to the tubular compartment (34). The urine loads of BKV measured in renal allograft recipients result more from urothelial replication (⬎95%) than from tubular epi-thelial replication (34). When viral replication can be controlled by BKV-specific cytotoxic T cells, intragraft inflammation re-mains limited, and no progression to BKVN ensues (35). BKVL measured in the blood illustrates persistent viral replication due to inefficient BKV-specific immunity and persistent inflammation, which lead to continued tubular epithelial damage. Thus, BKVL monitoring plays a substantial role in the early detection of BKV replication in immunocompromised patients and in improve-ment of the outcome of BKVN.
In this study, we elected to use urine and blood samples with different BKV genotypes (mono- and multiple infections) for in-terlaboratory BKVL comparison to mimic the clinical practice.
The qualitative results were overall satisfactory. The only sam-ple with a false-negative result by a laboratory using an in-house assay was a WB specimen with a low expected BKVL. Point mu-tations were detected in the primers and probe, suggesting their impact on BKV detection. Three laboratories reported false-pos-itive results for 3 different blood samples. These laboratories used different commercial qPCR kits and DNA extraction techniques. However, they performed DNA extraction of both urine and
blood samples on the same platform. A major concern when ex-tracting nucleic acids for use in amplification reactions is the risk of cross-contamination, especially when extracting BKV-strongly positive urine samples interspersed with BKV-negative samples. The urine samples within our panels harbor high BKVL, suggest-ing that intersample contamination occurred in the 3 laboratories. Quantitative results showed important variability, although 68% of the reported results fell within the acceptable range. Com-pared to other opportunistic viruses in transplant recipients, such as CMV and EBV (18,19,22), it is actually encouraging that two-thirds of the reported results in our study fell within the acceptable range. This may be explained by the high number of commercial assays used in our study that had received approval in Europe. As the development of BKV assays is more recent, we believe it has benefited from important progress made in qPCR techniques in the last decade. This is illustrated by the significant difference in performance when commercial and in-house assays were com-pared (76% versus 44%, P⬍ 0.0001).
The differences between the highest and the lowest reported BKVL averaged 2.61 log10and reached 5.55 log10. BKV genetic
polymorphisms have been described as the most significant source of error between qPCR assays (17,22,30). The composi-tion of our panels, including different BKV genotypes and the multiplicity of evaluated qPCR assays, provided a unique oppor-tunity to define for the first time the effects of mutation frequency and position on BKVL measurement. All positive samples were sequenced, and sequences were aligned with the primers and probes of the in-house assays. Mismatches were found at the primer and/or the probe annealing-sites in VP1 (positions 2227 to 2409), and LTAg (26), and StAg (27), while the amplification tar-get region VP1 (positions 2458 to 2532) (17) was highly conserved in the GenBank database and in our KTR cohort (data not shown). The number of mismatches in the primers and/or probes and their distance from the 3= end of the primer highly impacted BKVL measurement. For example, 3 mismatches at the 3= end position of primers led to BKVL underestimation by 2.61 log10, while 3 other
primer mismatches (1 at the 3= end position and 2 locatedⱖ8 bp from it) led to BKVL underestimation by 0.79 log10.
Further-more, no specific effect was observed with a single mismatch in the probe or at the 5=-end position of the primers. A
compar-FIG 4 Distribution of the standard deviations according to the expected BKVL. Standard deviations (SD) are represented by black diamonds for urine samples,
gray triangles for plasma samples, and open circles for the whole-blood samples. The SD ranged from 0.33 to 1.07 log10copies/ml. No difference in variability was
found across the analytical measuring range. The variability of BKVL in the 3 matrices (urine, WB, and plasma) was not statistically different (P⫽ 0.08, Kruskal-Wallis test). The greatest SD (⬎1 log10) was observed for the BKV genotype II sample.
on October 1, 2018 by guest
http://jcm.asm.org/
ison of the BKV sequences of our panel samples with sequences from the GenBank database and from our local KTR cohort revealed that these mutations were genotype specific (66 to 100% for genotype II/III and 100% for genotype IV) (data not shown). BKV genotype III is not represented in our study, since none of our patients were infected by BKV genotype III (geno-type III represents⬍1% of the BKV isolates in Europe). How-ever, several studies using phylogenetic and single-polymor-phism analyses of BKV DNA sequences suggest that BKV genotypes II and III may belong to the same genotype, since only a few nucleotides differ between them (36–38). Further-more, a comparison of the BKV sequences of our panel samples with sequences from the GenBank database revealed that all the mutations observed in the genotype II samples were specific not only to this genotype but also to genotype III strains.
Our BKV sequence analyses suggest that the primers and probes of most in-house assays were designed solely against geno-type I, while commercial assays allow the amplification of the ma-jor BKV genotypes, as claimed by the manufacturers. Due to the proprietary nature of commercial reagents, we could not analyze the presence of mutations in the amplification target genes of commercial assays that may impact qPCR amplification. How-ever, the high performance of commercial assays does not support the presence of such mutations. Altogether, our data suggest that commercial external quality controls for BKVL assessment should include all the major BKV genotypes to allow correct evaluation of BKV assays.
BKVL quantification may also be influenced by polymor-phisms in standard materials. Henriksen et al. (39) recently reported the presence of point mutations in the plasmid pBKV Dunlop (ATCC 45025) in comparison to the published se-quence and indicated that these mutations may alter BKVL quantification, since pBKV is used as a positive control in many qPCR assays (39). In our study, we demonstrate the impact of the sequence variation of a BKV control used as a standard material for quantification. Due to a deletion in this plasmid, BKVL was overestimated up to 1.55 log10. Our data strongly
suggest that the sequence of BKV commercial standards should be provided to users to verify the absence of mismatches with the primers and probes of their BKV assays. Alternatively, vi-rologists should sequence the commercialized control they in-tend to use as standard material.
The standard material used to establish the calibration curves in qPCR is an important source of interlaboratory disagreements (23). We recently demonstrated that recalibration with a common standard material significantly reduced the bias between a com-mercial assay and an in-house assay (23). Here, by retesting BKV panels by 4 commercial assays in a single laboratory, we show that commercial standard materials are equivalent, suggesting that this factor only poorly contributes to interlaboratory variability, at least for commercial assays. Moreover, the development of the WHO international standard will probably decrease the impact of this interlaboratory variability factor, provided the publication of the nucleotide sequence will occur to allow each laboratory and commercial assay supplier to verify the absence of mismatches with the primers and probes of their BKV qPCR assays.
The use of plasma or WB for viral load monitoring is still de-bated, although WB remains the preferred clinical sample type for detecting CMV and EBV in numerous diagnostic laboratories (40,
41). We recently demonstrated that the BKVL measured in plasma
and WB are highly correlated (23). In the present multisite study, we further show that the variability within each matrix is not sig-nificantly different. We thus provide evidence of equivalence be-tween plasma and WB as suitable matrices for BKV detection and quantification in peripheral blood. In the case of CMV and EBV, viral loads measured in WB reflect both free DNA and leukocyte-associated DNA (18,19). In contrast, BKV viremia mostly reflects free DNA, although BKV DNA has been detected in peripheral blood mononuclear cells (42).
Every year, more than 3,000 patients undergo kidney trans-plantation in France, and most of them (⬃90%) are routinely screened for BKV (more than 45,000 tests/year) in the laboratories participating in this study. These laboratories use a variety of ex-traction techniques and qPCR assays, whether published in house (26,27) or as commercial assays. We therefore believe that the results of this study are representative of the current status of BKV monitoring in Europe and the United States.
In summary, the results of this comparative study demonstrate that significant interlaboratory variability in BKVL quantification exists and may significantly impact patient care. Genotype II- and IV-specific polymorphisms and a range of DNA purification methods arose as major sources of interlaboratory disagreement. The optimization of primer and probe design and the standard-ization of DNA extraction methods may substantially decrease interlaboratory variability and allow interinstitutional studies to define a universal cutoff for presumptive BKVN and, ultimately, to ensure adequate patient care.
ACKNOWLEDGMENTS
The French BKV Study Group is composed of Sophie Alain, Véronique Avettand Fenoel, Adeline Baron, Agnès Beby-Defaux, Geneviève Billaud, David Boutolleau, Céline Bressollette, Sonia Burrel, Antoine Chaillon, Isabelle Cannavo, Dominique Challine, Anny Dewilde, Julia Dina, Alex-andra Ducancelle, Diane Descamps, Samira Fafi-Kremer, Nadira Fidouh, Vincent Foulongne, Slim Fourati, Isabelle Garrigue, Raphaële Germi, Valérie Giordanengo, Catherine Graffin, Sébastien Hantz, Cécile Hen-quell, Jacques Izopet, Marie-Edith Lafon, Gisèle Lagathu, Jérome le Goff, Marie-Christine Legrand Quillien, Marianne Leruez, Jean-Michel Man-suy, Marie-Christine Mazeron, Catherine Mengelle, Audrey Mirand, Pa-trice Morand, Christopher Payan, Sylvie Pillet, Bruno Pozzeto, Sylvie Rogez, Evelyne Schvoerer, Catherine Scieux, Morgane Solis, Françoise Stoll-Keller, Charlotte Sueur, Pascale Trimoulet, Astrid Vabret, Véro-nique Venard, and Christine Zandotti.
This work is published under the framework of the LABEX
TRANSPLANTEX (grant ANR-11-LABX-0070_TRANSPLANTEX),
which benefits from funding from the French Government; funds man-aged by the French National Research Agency (ANR) as part of the Invest-ments for the Future program and the INSERM UMR_S 1109.
We thank Rachel Freitag, Fiorella Nourreddine, Marie-Marie Manu-ello, and Anne-Laure Pierson for their excellent technical assistance. We thank Laurent Andréoletti, Fanny Renois, and Lea Pilorgé for their par-ticipation in the study. We also thank Come Barranger and Mathieu Vi-gnoles for their helpful discussion.
We declare no conflicts of interest.
All authors, including the French BKV Study Group, approved the final version of the manuscript.
REFERENCES
1. Borni-Duval C, Caillard S, Olagne J, Perrin P, Braun-Parvez L, Heibel
F, Moulin B. 2013. Risk factors for BK virus infection in the era of
ther-apeutic drug monitoring. Transplantation 95:1498 –1505.http://dx.doi .org/10.1097/TP.0b013e3182921995.
2. Hirsch HH, Knowles W, Dickenmann M, Passweg J, Klimkait T,
Mi-Solis et al.
on October 1, 2018 by guest
http://jcm.asm.org/
hatsch MJ, Steiger J. 2002. Prospective study of polyomavirus type BK
replication and nephropathy in renal-transplant recipients. N Engl J Med
347:488 – 496.http://dx.doi.org/10.1056/NEJMoa020439.
3. Hirsch HH, Vincenti F, Friman S, Tuncer M, Citterio F, Wiecek A,
Scheuermann EH, Klinger M, Russ G, Pescovitz MD, Prestele H. 2013.
Polyomavirus BK replication in de novo kidney transplant patients receiving tacrolimus or cyclosporine: a prospective, randomized, multicenter study. Am J Transplant 13:136 –145. http://dx.doi.org/10.1111/j.1600-6143.2012 .04320.x.
4. Kuypers DR. 2012. Management of polyomavirus-associated nephropa-thy in renal transplant recipients. Nat Rev Nephrol 8:390 – 402.http://dx .doi.org/10.1038/nrneph.2012.64.
5. Drachenberg RC, Drachenberg CB, PapadimitriouC J, Ramos E, Fink
JC, Wali R, Weir MR, Cangro CB, Klassen DK, Khaled A, Cunningham R, Bartlett ST. 2001. Morphological spectrum of polyoma virus disease in
renal allografts: diagnostic accuracy of urine cytology. Am J Transplant
1:373–381.http://dx.doi.org/10.1034/j.1600-6143.2001.10414.x. 6. Hirsch HH, Randhawa P. 2009. BK virus in solid organ transplant
recip-ients. Am J Transplant 9(Suppl 4):S136 –S146.
7. Adam B, Randhawa P, Chan S, Zeng G, Regele H, Kushner YB, Colvin
RB, Reeve J, Mengel M. 2014. Banff Initiative for Quality Assurance in
Transplantation (BIFQUIT): reproducibility of polyomavirus immuno-histochemistry in kidney allografts. Am J Transplant 14:2137–2147.http: //dx.doi.org/10.1111/ajt.12794.
8. Drachenberg CB, PapadimitriouC J, Hirsch HH, Wali R, Crowder C,
Nogueira J, Cangro CB, Mendley S, Mian A, Ramos E. 2004.
Histolog-ical patterns of polyomavirus nephropathy: correlation with graft out-come and viral load. Am J Transplant 4:2082–2092.http://dx.doi.org/10 .1046/j.1600-6143.2004.00603.x.
9. Bonvoisin C, Weekers L, Xhignesse P, Grosch S, Milicevic M, Krzesinski JM. 2008. Polyomavirus in renal transplantation: a hot problem. Transplantation 85: S42–48.http://dx.doi.org/10.1097/TP.0b013e318169c794.
10. Nickeleit V, Klimkait T, Binet IF, Dalquen P, Del Zenero V, Thiel G,
Mihatsch MJ, Hirsch HH. 2000. Testing for polyomavirus type BK DNA in
plasma to identify renal-allograft recipients with viral nephropathy. N Engl J Med 342:1309 –1315.http://dx.doi.org/10.1056/NEJM200005043421802. 11. Ginevri F, Azzi A, Hirsch HH, Basso S, Fontana I, Cioni M, Bodaghi S,
Salotti V, Rinieri A, Botti G, Perfumo F, Locatelli F, Comoli P. 2007.
Prospective monitoring of polyomavirus BK replication and impact of pre-emptive intervention in pediatric kidney recipients. Am J Transplant
7:2727–2735.http://dx.doi.org/10.1111/j.1600-6143.2007.01984.x. 12. Menter T, Mayr M, Schaub S, Mihatsch MJ, Hirsch HH, Hopfer H.
2013. Pathology of resolving polyomavirus-associated nephropathy. Am J Transplant 13:1474 –1483.http://dx.doi.org/10.1111/ajt.12218. 13. Hirsch HH, Babel N, Comoli P, Friman V, Ginevri F, Jardine A,
Lautenschlager I, Legendre C, Midtvedt K, Munoz P, Randhawa P, Rinaldo CH, Wieszek A, ESCMID Study Group of Infection in Com-promised Hosts (ESGICH). 2014. European perspective on human
polyomavirus infection, replication, and disease in solid organ transplan-tation. Clin Microbiol Infect 20:74 – 88.
14. Kasiske BL, Zeier MG, ChapmanR J, Craig JC, Ekberg H, Garvey CA,
Green MD, Jha V, Josephson MA, Kiberd BA, Kreis HA, McDonald RA, Newmann JM, Obrador GT, Vincenti FG, Cheung M, Earley A, Raman G, Abariga S, Wagner M, Balk EM, Kidney Disease: Improving Global Outcomes. 2010. KDIGO clinical practice guideline for the care of kidney
transplant recipients: a summary. Kidney Int 77:299 –311.http://dx.doi .org/10.1038/ki.2009.377.
15. Smith F, Panek R, Kiberd BA. 2009. Screening to prevent polyoma virus nephropathy in kidney transplantation: a cost analysis. Am J Transplant
9:2177–2179.http://dx.doi.org/10.1111/j.1600-6143.2009.02729.x. 16. Hassan S, Mittal C, Amer S, Khalid F, Patel A, Delbusto R, Samuel L,
Alangaden G, Ramesh M. 2014. Currently recommended BK virus (BKV)
plasma viral load cutoff ofⱖ4 log10/ml underestimates the diagnosis of BKV-associated nephropathy: a single transplant center experience. Transpl Infect Dis 16:55– 60.http://dx.doi.org/10.1111/tid.12164. 17. Hoffman NG, Cook L, Atienza EE, Limaye AP, Jerome KR. 2008.
Marked variability of BK virus load measurement using quantitative real-time PCR among commonly used assays. J Clin Microbiol 46:2671–2680. http://dx.doi.org/10.1128/JCM.00258-08.
18. Pang XL, FoxD J, Fenton JM, Miller GG, Caliendo AM, Preiksaitis JK,
American Society of Transplantation Infectious Diseases Community of Practice, Canadian Society of Transplantation. 2009. Interlaboratory
comparison of cytomegalovirus viral load assays. Am J Transplant 9:258 – 268.http://dx.doi.org/10.1111/j.1600-6143.2008.02513.x.
19. Preiksaitis JK, Pang XL, FoxD J, Fenton JM, Caliendo AM, Miller GG,
American Society of Transplantation Infectious Diseases Community of Practice. 2009. Interlaboratory comparison of Epstein-Barr virus viral
load assays. Am J Transplant 9:269 –279.http://dx.doi.org/10.1111/j.1600 -6143.2008.02514.x.
20. Fryer JF, Heath AB, Wilkinson DE, Minor PD, Collaborative Study
Group. 2011. Collaborative study to evaluate the proposed 1st WHO
international standard for Epstein-Barr virus (EBV) for nucleic acid am-plification technology (NAT)-based assays. WHO/BS/2011.2172. Expert Committee on Biological Standardization, World Health Organization, Geneva, Switzerland. http://apps.who.int/iris/bitstream/10665/70781/1 /WHO_BS_2011.2172_eng.pdf.
21. Fryer JF, Heath AB, Anderson R, Minor PD, Collaborative Study
Group. 2010. Collaborative study to evaluate the proposed. 1st WHO
international standard for human cytomegalovirus (HCMV) for nucleic acid amplification (NAT)-based assays. WHO/BS/10.2138. Expert Com-mittee on Biological Standardization, World Health Organization, Ge-neva, Switzerland.http://www.nibsc.org/PDF/HCMV_IS.pdf.
22. Hayden RT, Yan X, Wick MT, Rodriguez AB, Xiong X, Ginocchio CC,
Mitchell MJ, Caliendo AM, College of American Pathologists Microbi-ology Resource Committee. 2012. Factors contributing to variability of
quantitative viral PCR results in proficiency testing samples: a multivariate analysis. J Clin Microbiol 50:337–345. http://dx.doi.org/10.1128/JCM .01287-11.
23. Sueur C, Solis M, Meddeb M, Soulier E, Domingo-Calap P, Lepiller Q,
Freitag R, Bahram S, Caillard S, Barth H, Stoll-Keller F, Fafi-Kremer S.
2014. Toward standardization of BK virus monitoring: evaluation of the BK virus R-gene kit for quantification of BK viral load in urine, whole blood and plasma specimens. J Clin Microbiol 52:4298 – 4304.http://dx .doi.org/10.1128/JCM.02031-14.
24. Schmitt C, Raggub L, Linnenweber-Held S, Adams O, Schwarz A, Heim
A. 2014. Donor origin of BKV replication after kidney transplantation. J
Clin Virol 59:120 –125.http://dx.doi.org/10.1016/j.jcv.2013.11.009. 25. Grys TE. 2011. Developing a quality system for quantitative
laboratory-developed tests. Clin Microbiol Newslett 33:179 –185.http://dx.doi.org /10.1016/j.clinmicnews.2011.11.001.
26. Arthur RR, Dagostin S, Shah KV. 1989. Detection of BK virus and JC virus in urine and brain tissue by the polymerase chain reaction. J Clin Microbiol 27:1174 –1179.
27. Bressollette-Bodin C, Coste-Burel M, Hourmant M, Sebille V,
Andre-Garnier E, Imbert-Marcille BM. 2005. A prospective longitudinal study
of BK virus infection in 104 renal transplant recipients. Am J Transplant
5:1926 –1933.http://dx.doi.org/10.1111/j.1600-6143.2005.00934.x. 28. Senechal B, James VL. 2012. Ten years of external quality assessment of
human immunodeficiency virus type 1 RNA quantification. J Clin Micro-biol 50:3614 –3619.http://dx.doi.org/10.1128/JCM.01221-12.
29. Schirm J, van Loon AM, Valentine-Thon E, Klapper PE, Reid J, Cleator
GM. 2002. External quality assessment program for qualitative and
quan-titative detection of hepatitis C virus RNA in diagnostic virology. J Clin Microbiol 40:2973–2980.http://dx.doi.org/10.1128/JCM.40.8.2973-2980 .2002.
30. Randhawa P, Kant J, Shapiro R, Tan H, Basu A, Luo C. 2011. Impact of genomic sequence variability on quantitative PCR assays for diagnosis of polyomavirus BK infection. J Clin Microbiol 49:4072– 4076.http://dx.doi .org/10.1128/JCM.01230-11.
31. Luo C, Hirsch HH, Kant J, Randhawa P. 2012. VP-1 quasispecies in human infection with polyomavirus BK. J Med Virol 84:152–161.http: //dx.doi.org/10.1002/jmv.22147.
32. Pastrana DV, Ray U, Magaldi TG, Schowalter RM, Cuburu N, Buck CB. 2013. BK polyomavirus genotypes represent distinct serotypes with dis-tinct entry tropism. J Virol 87:10105–10113.http://dx.doi.org/10.1128 /JVI.01189-13.
33. Boom R, Sol CJ, Schuurman T, Van Breda A, WeelF J, Beld M, Ten
Berge IJ, Wertheim-Van Dillen PM, De Jong MD. 2002. Human
cyto-megalovirus DNA in plasma and serum specimens of renal transplant recipients is highly fragmented. J Clin Microbiol 40:4105– 4113.http://dx .doi.org/10.1128/JCM.40.11.4105-4113.2002.
34. Funk GA, Gosert R, Comoli P, Ginevri F, Hirsch HH. 2008. Polyoma-virus BK replication dynamics in vivo and in silico to predict cytopathology and viral clearance in kidney transplants. Am J Transplant 8:2368 –2377. http://dx.doi.org/10.1111/j.1600-6143.2008.02402.x.
on October 1, 2018 by guest
http://jcm.asm.org/
35. Babel N, Volk HD, Reinke P. 2011. BK polyomavirus infection and nephropathy: the virus-immune system interplay. Nat Rev Nephrol
7:399 – 406.http://dx.doi.org/10.1038/nrneph.2011.59.
36. Zheng HY, Nishimoto Y, Chen Q, Hasegawa M, Zhong S, Ikegaya H,
Ohno N, Sugimoto C, Takasaka T, Kitamura T, Yogo Y. 2007.
Rela-tionships between BK virus lineages and human populations. Microbes Infect 9:204 –213.http://dx.doi.org/10.1016/j.micinf.2006.11.008. 37. Chehadeh W, Nampoory MR. 2013. Genotypic diversity of
polyomavi-ruses circulating among kidney transplant recipients in Kuwait. J Med Virol 85:1624 –1631.http://dx.doi.org/10.1002/jmv.23639.
38. Luo C, Bueno M, Kant J, Martinson J, Randhawa P. 2009. Genotyping schemes for polyomavirus BK, using gene-specific phylogenetic trees and single nucleotide polymorphism analysis. J Virol 83:2285–2297.http://dx .doi.org/10.1128/JVI.02180-08.
39. Henriksen S, Mittelholzer C, Gosert R, Hirsch HH, Rinaldo CH. 2015. Human BK polyomavirus plasmid pBKV (34-2) (Dunlop)
con-tains mutations not found in the originally published sequences. Ge-nome Announc 3(2):e00046 –15.http://dx.doi.org/10.1128/genomeA .00046-15.
40. Fafi-Kremer S, Brengel-Pesce K, Bargues G, Bourgeat MJ, Genoulaz O,
SeigneurinM J, Morand P. 2004. Assessment of automated DNA
extrac-tion coupled with real-time PCR for measuring Epstein-Barr virus load in whole blood, peripheral mononuclear cells and plasma. J Clin Virol 30: 157–164.http://dx.doi.org/10.1016/j.jcv.2003.10.002.
41. Stevens SJ, Pronk I, Middeldorp JM. 2001. Toward standardization of Epstein-Barr virus DNA load monitoring: unfractionated whole blood as preferred clinical specimen. J Clin Microbiol 39:1211–1216.http://dx.doi .org/10.1128/JCM.39.4.1211-1216.2001.
42. Chatterjee M, Weyandt TB, Frisque RJ. 2000. Identification of archetype and rearranged forms of BK virus in leukocytes from healthy individuals. J Med Virol 60:353–362.
Solis et al.