Publisher’s version / Version de l'éditeur:
Journal of Clinical Investigation, 2016-08-8
READ THESE TERMS AND CONDITIONS CAREFULLY BEFORE USING THIS WEBSITE. https://nrc-publications.canada.ca/eng/copyright
Vous avez des questions? Nous pouvons vous aider. Pour communiquer directement avec un auteur, consultez la première page de la revue dans laquelle son article a été publié afin de trouver ses coordonnées. Si vous n’arrivez pas à les repérer, communiquez avec nous à [email protected].
Questions? Contact the NRC Publications Archive team at
[email protected]. If you wish to email the authors directly, please see the first page of the publication for their contact information.
NRC Publications Archive
Archives des publications du CNRC
This publication could be one of several versions: author’s original, accepted manuscript or the publisher’s version. / La version de cette publication peut être l’une des suivantes : la version prépublication de l’auteur, la version acceptée du manuscrit ou la version de l’éditeur.
For the publisher’s version, please access the DOI link below./ Pour consulter la version de l’éditeur, utilisez le lien DOI ci-dessous.
https://doi.org/10.1172/JCI80711
Access and use of this website and the material on it are subject to the Terms and Conditions set forth at
BRPF1 is essential for development of fetal hematopoietic stem cells
You, Linya; Li, Lin; Zou, Jinfeng; Yan, Kezhi; Belle, Jad; Nijnik, Anastasia;
Wang, Edwin; Yang, Xiang-Jiao
https://publications-cnrc.canada.ca/fra/droits
L’accès à ce site Web et l’utilisation de son contenu sont assujettis aux conditions présentées dans le site LISEZ CES CONDITIONS ATTENTIVEMENT AVANT D’UTILISER CE SITE WEB.
NRC Publications Record / Notice d'Archives des publications de CNRC:
https://nrc-publications.canada.ca/eng/view/object/?id=9cacff12-f201-4009-9908-4fce5f32af9a
https://publications-cnrc.canada.ca/fra/voir/objet/?id=9cacff12-f201-4009-9908-4fce5f32af9a
Introduction
Hematopoietic stem cells (HSCs) lie at the hierarchical apex of definitive hematopoiesis and form a life-long reservoir for all blood cell types in vertebrates (1–4). These stem cells regulate development (5, 6) and undergo important changes during aging (7). Upon transplantation, HSCs hold the promise to treat vari-ous diseases, including lysosomal storage disorders (8), immu-nodeficiency (9–11), neurological disorders (8, 12), hematologi-cal malignancies, and other types of cancer (13). Thus, HSCs are of broad research and clinical interest. Mechanistically, specific gene expression programs ensure HSC generation, self-renewal, homing, quiescence, proliferation, and differentiation (1, 14, 15). Identification and characterization of DNA-binding transcrip-tion factors and cytoplasmic signaling molecules have yielded insights into regulatory networks important for HSC homeo-stasis (1, 14–16). Numerous chromatin regulators have been identified in the past 2 decades (17–19). As a key mechanism of chromatin regulation, histone modifications interplay with DNA methylation and demethylation to form signaling platforms that are essential for governing the identity of differentiated cells and stem cells (20–22). Hundreds of chromatin regulators utilize structural modules to interpret signals conferred by chromatin modifications (23–25), so an important question is how such reg-ulators play a role in HSC homeostasis.
Bromodomain- and PHD finger–containing protein 1 (BRPF1) is a multivalent chromatin regulator composed of multiple his-tone-recognizing modules, including double PHD fingers, a bromodomain, and a PWWP domain (26–28). The PHD fingers recognize the N-terminal tail of histone H3 (28–30), the bromodo-main has acetyllysine-binding ability (31), and the PWWP dobromodo-main forms a specific pocket for trimethylated histone H3 (32, 33). In addition, BRPF1 possesses motifs for interaction with the acetyl-transferases MOZ, MORF, and HBO1, which are also known as lysine acetyltransferase 6A (KAT6A), KAT6B, and KAT7, respec-tively (26–28). As a scaffold, BRPF1 promotes quartet-complex formation of these enzymes with other subunits, stimulates the catalytic activity of these enzymes, and governs their substrate specificity (26–28). Molecular and cell-based findings suggest that BRPF1 has an important role in vivo. Moreover, it remains possible that BRPF1 functions independently of these 3 enzymes in vivo. To delineate its biological functions at the tissue and organismal levels, we have recently taken a genetic approach to disrupt the mouse gene and uncovered that BRPF1 is crucial for embryogen-esis and forebrain development (34–37). Here we identify it as a key regulator of fetal HSCs and progenitors, thereby highlighting its importance in definitive hematopoiesis.
Results
Hematopoietic-specific Brpf1 loss results in early lethality and aplastic anemia. Important roles of MOZ and MORF in leukemia (38–42) prompted us to investigate whether BRPF1 has a role in hemato-poiesis. As Brpf1 expression in the bone marrow remains relatively unclear (34), we sorted different populations of hematopoietic cells by fluorescence-activated multicolor flow cytometry (43, 44) Hematopoietic stem cells (HSCs) serve as a life-long reservoir for all blood cell types and are clinically useful for a variety of
HSC transplantation-based therapies. Understanding the role of chromatin organization and regulation in HSC homeostasis may provide important insights into HSC development. Bromodomain- and PHD finger–containing protein 1 (BRPF1) is a multivalent chromatin regulator that possesses 4 nucleosome-binding domains and activates 3 lysine acetyltransferases (KAT6A, KAT6B, and KAT7), suggesting that this protein has the potential to stimulate crosstalk between different chromatin modifications. Here, we investigated the function of BRPF1 in hematopoiesis by selectively deleting its gene in murine blood cells. Brpf1-deficient pups experienced early lethality due to acute bone marrow failure and aplastic anemia. The mutant bone marrow and fetal liver exhibited severe deficiency in HSCs and hematopoietic progenitors, along with elevated reactive oxygen species, senescence, and apoptosis. BRPF1 deficiency also reduced the expression of multipotency genes, including Slamf1, Mecom, Hoxa9, Hlf, Gfi1, Egr, and Gata3. Furthermore, BRPF1 was required for acetylation of histone H3 at lysine 23, a highly abundant but not well-characterized epigenetic mark. These results identify an essential role of the multivalent chromatin regulator BRPF1 in definitive hematopoiesis and illuminate a potentially new avenue for studying epigenetic networks that govern HSC ontogeny.
BRPF1 is essential for development of fetal
hematopoietic stem cells
Linya You,1,2 Lin Li,1,2 Jinfeng Zou,3 Kezhi Yan,1,2 Jad Belle,4 Anastasia Nijnik,4 Edwin Wang,3 and Xiang-Jiao Yang1,2,5,6
1Rosalind and Morris Goodman Cancer Research Center and 2Department of Medicine, McGill University, Montreal, Quebec, Canada. 3National Research Council Canada, Montreal, Quebec, Canada. 4Department of Physiology and 5Department of Biochemistry, McGill University, Montreal, Quebec, Canada. 6McGill University Health Center, Montreal, Quebec, Canada.
Authorship note: L. You and L. Li are co-first authors. A. Nijnik and E. Wang contributed
equally to this work.
Conflict of interest: The authors have declared that no conflict of interest exists. Submitted: December 29, 2014; Accepted: June 16, 2016.
The Journal of Clinical Investigation
R E S E A R C H A R T I C L Efor HSCs (45), so the results suggest a potential role for BRPF1 in HSCs and hematopoiesis.
To investigate this exciting possibility, we generated specific knockouts by mating Brpf1fl/fl mice (34) with the Vav1-iCre strain,
which is known to confer hematopoietic-specific iCre expression (46). To verify the knockout efficiency, we examined Brpf1 mRNA in control and homozygous mutant pups. Compared with that in the control, Brpf1 mRNA was low in the mutant spleen, thymus, and bone marrow of Brpf1fl/fl Vav1-iCre (referred to as vKO
hereaf-ter) pups (Supplemental Figure 2, A and B), whereas there were no effects on the Brpf1 transcript in the mutant testis (Supplemental Figure 2A) and much less effect in the mutant kidney (Supplemen-tal Figure 2B). We also sorted different hematopoietic lineages from wild-type and mutant bone marrows and E12.5 fetal livers. As shown in Supplemental Figure 2, C and D, the knockout effi-ciency was generally high in different hematopoietic lineages. and determined Brpf1 expression in isolated cell populations by
quantitative reverse transcription-PCR (RT-qPCR). As shown in Supplemental Figure 1A (supplemental material available online with this article; doi:10.1172/JCI80711DS1), the transcript was detectable in multiple hematopoietic lineages and Lin–Sca1+cKit+
(LSK) cells from the bone marrow at postnatal day 11 (P11). Simi-larly, RT-qPCR showed that Brpf1 mRNA is present in CD34–Flt3–
and CD34+Flt3– fractions of LSK cells (enriched for long-term and
short-term HSCs, respectively), as well as in 3 lineage-committed progenitors in the bone marrow (Supplemental Figure 1B). In addi-tion, we sorted different hematopoietic populations from the fetal liver at embryonic day 12.5 (E12.5). At this stage, Brpf1 mRNA was detectable in different hematopoietic cell lineages (Supplemental Figure 1C). Interestingly, when compared with other hematopoi-etic cells, the transcript level was strikingly high in CD48–CD150+
LSK cells (Supplemental Figure 1C). This population is enriched
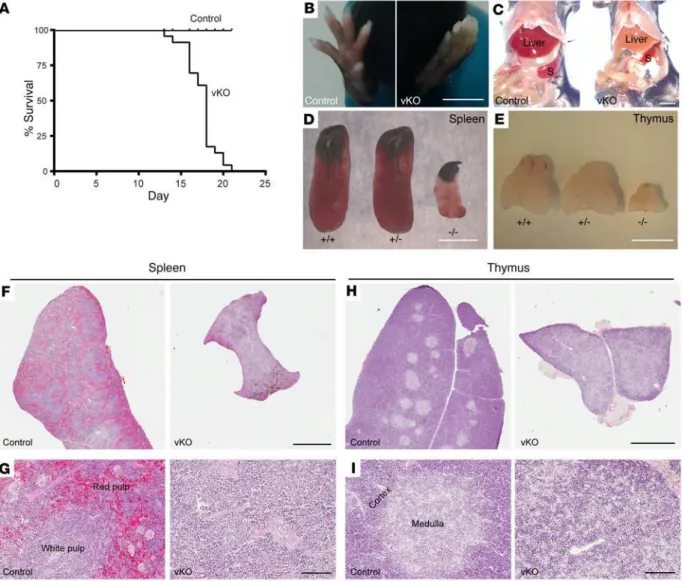
Figure 1. Brpf1-deficient mice display postnatal lethality and severe hematopoietic hypoplasia. (A) Kaplan-Meier survival curve. Twenty-four pairs of
control and Brpf1fl/fl Vav1-iCre (vKO) mice were monitored for survival. Mutant mice were alive for a maximum of 21 days with median mortality at P18. (B–E) Unlike the control, mutant mice exhibited pale extremities (B) and pale liver (C), along with small spleen (D) and thymus (E) at week 3 after birth. Three pairs were examined and images for 1 representative pair of P19 control and mutant mice are shown. S, spleen. (F and H) H&E staining of P19 spleen (F) and thy-mus (H) paraffin sections. (G and I) Magnified images taken from F and H, respectively. Note abnormal histological organizations in mutant sections. Scale bars: B–E, 5 mm; F and H, 1 mm; G and I, 100 μm.
control, so complete blood counts were carried out. The results indicated pancytopenia in the peripheral blood from mutant pups: the 3 lineages (red blood cells, white blood cells, and platelets) were all severely diminished compared to their control counterparts (Supplemental Table 2). Complete blood counts were also performed at P12. As shown in Supplemental Table 3, leukocytes and platelets decreased significantly while erythrocytes were relatively normal in the mutant, indicating that cytopenia occurs progressively from week 2 to 3.
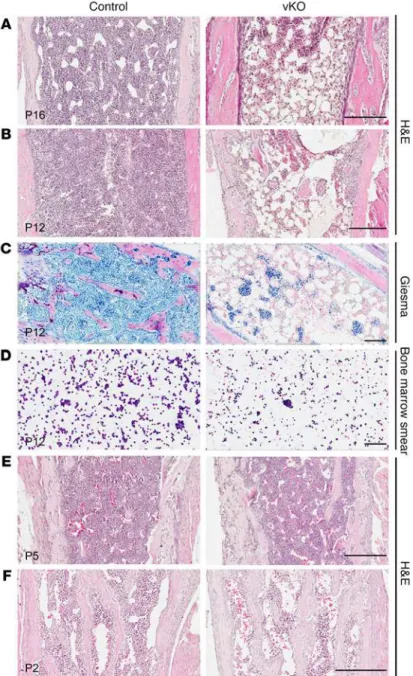
In light of this, we performed histological analysis on paraffin bone sections. H&E staining revealed that at P16, the mutant bone marrow was aplastic and filled with large adipocytes (Figure 2A). A similar difference was observed in the mutant bone marrow at P12 (Figure 2B). Giemsa staining on sections and smear preparations confirmed that aplastic bone marrow occurs as early as P12 (Figure 2, C and D). To trace the developmental origin of the abnor-mality, we analyzed paraffin sections of long bones from neonates at P2 and P5. As shown in Figure 2, E and F, the mutant and control bone marrow structures were relative-ly comparable at the histological level. Thus, Brpf1 dele-tion in the hematopoietic system leads to bone marrow failure starting at postnatal week 2.
Brpf1 disruption reduces HSC and progenitor popula-tions in the bone marrow. The bone marrow contains stem cells and progenitors for all blood lineages. To identify causes for the bone marrow failure, we investigated how Brpf1 deletion may affect different cell types. For this, we harvested bone marrow cells from control and mutant neonates for immunophenotyping by multicolor flow cytometry (43, 44). Because a minimal difference between 1-week-old control and mutant bone marrow structures was observed at the histological level (Figure 2, E and F), this age was chosen for flow cytometry to minimize secondary or nonautonomous effects resulting from bone marrow failure. As shown in Supplemental Figure 3A, the total number of nucleated cells decreased in the mutant bone marrow. Cell viability was also reduced (Supplemental Figure 3B). Interestingly, the LSK population disappeared in the mutant bone marrow (Figure 3, A and C), as did the IL-7Rα– LSK fraction
(Figure 3, B and D), which is enriched for HSCs. Moreover, dra-matic reduction was observed in myeloid progenitors (MPs; Lin–
Sca1–cKit+) (Figure 3A). This population was further gated into 3
lineage-committed progenitors: common myeloid progenitors (CMPs; Lin–Sca1–cKit+CD34+CD16/32–); granulocyte/macrophage
progenitors (GMPs; Lin–Sca1–cKit+CD34+CD16/32+); and
mega-Thus, Brpf1 disruption was efficient and specific. In terms of survival, Brpf1fl/+ Vav1-iCre mice were indistinguishable from the
wild-type, but the homozygous mutant mice exhibited an interest-ing phenotype (Supplemental Table 1). The vKO newborns were grossly normal, but could not survive beyond the weaning stage (Supplemental Table 1 and Figure 1A). Extensive genotyping of over 400 pups indicated that most of them died in postnatal week 3 (Supplemental Table 1). Therefore, hematopoietic-specific dis-ruption of the Brpf1 gene causes acute preweaning lethality.
In their last days of life, mutant pups appeared pale in their extremities (Figure 1B), and necropsy revealed pale liver (Figure 1C) and severe hypoplasia in the spleen and thymus (Figure 1, D and E). Histologically, the mutant spleen was pale and lacked clear distinction between red and white pulps (Figure 1, F and G). Simi-larly, the mutant thymus was poorly organized and lacked a clear medulla (Figure 1, H and I). We noticed that at P17 the peripheral blood from the mutant pups was much lighter than that of the
Figure 2. Brpf1 deletion leads to acute bone marrow failure. (A
and B) H&E staining of long-bone sections from representative control and Brpf1fl/fl Vav1-iCre (vKO) pups at P16 and P12. (C and
D) Giemsa staining of long-bone sections (C) and bone marrow
smears (D) from P12 control and mutant pups, confirming low cellularity in the mutant. (E and F) H&E staining of long-bone sections from control and mutant pups at P2 and P5. At each time point, 3 pairs from 3 different litters were examined and images from 1 representative pair are shown here. Scale bars: 200 μm in A, B, E, and F; 100 μm in C and D.
The Journal of Clinical Investigation
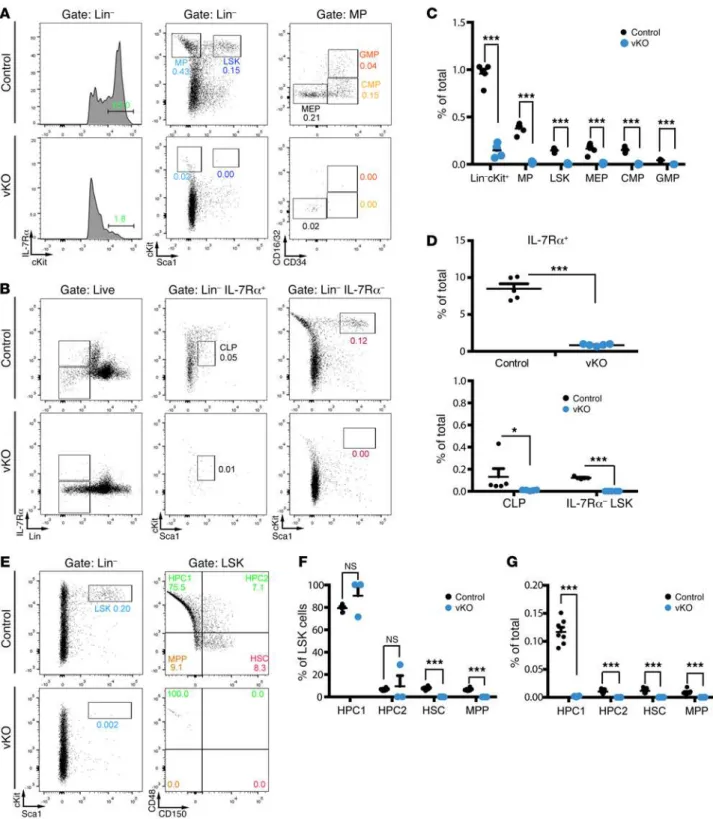
R E S E A R C H A R T I C L EFigure 3. Depleted HSC and hematopoietic progenitor populations in the mutant bone marrow. (A and B) Representative cytometric analysis of LSK
cells, myeloid progenitors, and common lymphoid progenitors in control and Brpf1fl/fl Vav1-iCre (vKO) bone marrow. P6 bone marrow cells were stained with fluorophore-conjugated monoclonal antibodies for cytometric detection of the following populations of stem cell or progenitor populations: MP (myeloid progenitor), LSK, MEP (megakaryocyte/erythroid progenitor), CMP (common myeloid progenitor), GMP (granulocyte/macrophage progenitor), common lymphoid progenitor (CLP), and IL-7Rα– LSK (enriched for HSCs). (C and D) Percentage values of different populations detected in A and B. n = 5 for each
genotype. (E) Representative cytometric analysis of bone marrow HSCs, MPPs (multipotent progenitors), and HPCs (hematopoietic progenitor cells) gated according to expression of the SLAM (signaling lymphocytic activation molecule) cell surface markers CD48 and CD150. (F and G) Within LSK cells, HPC ratios were not altered in the mutant (F). Because the percentage of LSK cells was much lower in the mutant bone marrow (B), all 4 populations decreased dramatically in the mutant (G). n = 7 for wild-type and n = 3 for vKO pups. No significant difference was observed between wild-type and heterozygous LSK cell numbers: 0.18% ± 0.01% (wild-type, n = 4) vs. 0.22% ± 0.02% (heterozygous, n = 4). *P < 0.05, ***P < 0.001. For statistical analysis, unpaired 2-tailed Student’s t tests were performed and average values are shown as the mean + SEM in C, D, F, and G.
Figure 4D) and histologically, the mutant red and white pulps were disorganized (Supplemental Figure 4E), indicating that BRPF1 is also important for development of the spleen per se.
As the mutant thymus was hypoplastic at P19 (Figure 1E), we traced the defect to an earlier time point. At P5, the mutant thy-mus was smaller than that of control (Supplemental Figure 5A). The total number of thymocytes was significantly reduced (Sup-plemental Figure 5B). Primitive thymocytes in the thymus do not express CD4 or CD8, and are thus double negative (CD4–CD8–). As
development proceeds, they become double positive (CD4+CD8+)
and then mature into single-positive (CD4+CD8– or CD4–CD8+)
thymocytes for release to the peripheral system. As shown in Sup-plemental Figure 5, C and D, the percentage of CD4+CD8+
thymo-cytes was similar between the control and mutant (Supplemental Figure 5, C and D). Also, none of these 4 populations was affected, indicating grossly normal thymocyte differentiation despite a reduced total number of T cells in the mutant thymus (Supple-mental Figure 5, C and D). Notably, expression of some cell cycle regulators was altered in the thymus (Supplemental Figure 5E). Thus, BRPF1 is also important for thymus development.
BRPF1 is essential for long-term reconstitution capacity of bone marrow cells. The above immunophenotyping results (Figure 3) suggest that dramatic reduction of HSC and progenitor popula-tions contribute to the bone marrow failure in mutant pups (Fig-ure 2). One remaining question is whether residual HSCs and progenitors are functional. To investigate this possibility, we per-formed methylcellulose colony formation assays. When cultured in a methylcellulose medium containing IL-6, IL-3, stem cell fac-tor, and erythropoietin (Methocult M3434), the number of colo-nies formed by mutant bone marrow cells was reduced compared to the control (Figure 4, A and B), indicating that there are fewer functional myeloid and erythroid progenitor cells in the mutant. Moreover, the mutant colonies were smaller, suggesting a prolifer-ative defect. We then examined pre-B progenitors using a methyl-cellulose medium containing IL-7. As shown in Figure 4C, the number of colonies from mutant bone marrow cells was reduced compared to the control. These results indicate that BRPF1 is essential for hematopoietic progenitor functions in vitro.
To assess the impact of Brpf1 inactivation on long-term hema-topoietic reconstitution capacity in vivo, we performed competi-tive bone marrow transplantation by injecting CD45.2+ wild-type
(or mutant) bone marrow cells, mixed with wild-type CD45.1+
cells, into γ-irradiated CD45.1+ recipient mice. As shown in Figure
4D, at 4 to 16 weeks after transplantation, flow cytometry revealed that the mutant bone marrow cells were unable to repopulate in the recipient peripheral blood, whereas the control bone marrow cells succeeded in contributing about 60%–80% cells to the recip-ient blood. At week 16, virtually no contribution of the mutant bone marrow cells to multiple lineages in the peripheral blood of the recipients was found (Figure 4, E and F). Furthermore, no contribution to stem/progenitors cells and differentiated lineages in the recipients’ bone marrow was detected (Figure 4F). These results indicate that BRPF1 is required for short-term and long-term repopulating activities of bone marrow cells.
Upon transplantation, HSCs and progenitors migrate to recipi-ents’ bone marrow and subsequently home to proper niches. The failure of the mutant bone marrow cells to reconstitute the recipi-karyocyte/erythroid progenitors (MEPs; Lin–Sca1–cKit+CD34–
CD16/32–). As shown in Figure 3, A and C, reduction was found in
all 3 fractions. The IL-7 receptor IL-7Rα also serves as a receptor for thymic stromal lymphopoietin (TSLP), which is important for B and T cell development (47). In the mutant bone marrow, IL-7Rα+
cells were depleted (Figure 3, B and D) and common lymphoid progenitors (CLPs; Lin–IL-7Rα+Sca1locKitlo) disappeared (Figure 3,
B and D). We also analyzed different progenitors and stem cells within the LSK population according to expression of 2 signaling lymphocytic activation molecules (SLAMs), CD48 and CD150, as cell-surface markers (45). CD48–CD150+ LSK cells are relatively
enriched for HSCs (45) and will thus be referred to as HSCs here-after to describe related immunophenotyping results. Within the LSK population, HSCs and multipotent progenitors (MPPs; CD48–
CD150– LSKs) were depleted in the mutant bone marrow, whereas
ratios of hematopoietic progenitor cell (HPC) populations were unaltered (Figure 3, E and F). However, because LSK cells were much lower in the mutant bone marrow (Figure 3C), all 4 popu-lations decreased dramatically in the mutant (Figure 3G). Thus, Brpf1 is required for proper development and/or maintenance of HSCs and progenitor cells in the bone marrow.
We next assessed how Brpf1 deletion might affect hemato-poietic differentiation, by examining B lymphopoiesis, myelo-poiesis, and erythropoiesis in the bone marrow. For this purpose, total bone marrow cells were stained with fluorophore-conjugat-ed monoclonal antibodies against the B lineage marker CD19, the myeloid lineage markers Gr1 and Mac1, and the erythrocyte markers Ter119 and CD71. For B cell lineages, the CD19+ cell
population was depleted in the mutant (Supplemental Figure 3, C and D). For myelopoiesis, the mutant contained slightly more Mac1+Gr1– and Mac1–Gr1+ granulocytes but fewer Mac1–Gr1– cells
than the control (Supplemental Figure 3, E and F). For erythropoi-esis, proerythroblasts are Ter119–CD71+ and maturation proceeds
through Ter119+CD71+ early erythroblasts to Ter119+CD71–
late-stage erythroblasts. In the mutant, the number of Ter119–CD71+
proerythroblasts and Ter119+CD71+ early erythroblasts increased,
but the Ter119+CD71– late-stage erythroblast population remained
normal (Supplemental Figure 3, G and H), indicating that BRPF1 does not dramatically affect erythrocyte maturation. These results indicate that, except for the B cell lineage, the impact on myeloid and erythroid differentiation programs (Supplemental Figure 3) is much less dramatic than that on the stem cell and progenitor compartments (Figure 3). Therefore, BRPF1 appears to be a crucial and specific regulator of HSCs and hematopoietic progenitors in the bone marrow.
BRPF1 regulates spleen and thymus development. In addition to the bone marrow, multiple peripheral organs are important for hematopoiesis. In neonates, the spleen is a major peripheral hema-topoietic site. At P6, the control and mutant spleen weights were similar (Supplemental Figure 4A), although there were fewer viable cells in the mutant spleen (Supplemental Figure 4B). Although the proportions of B (B220+) and T (CD3+) lymphocytes in total splenic
cells were similar in control and mutant spleens (Supplemental Figure 4B), the LSK and HPC populations were virtually missing in the mutant spleen (Supplemental Figure 4C). These results further support the important role of BRPF1 in HSCs and progenitors. In severe cases at P6, the mutant spleen was smaller (Supplemental
The Journal of Clinical Investigation
R E S E A R C H A R T I C L Eents’ blood system might be due to a homing defect. To test this, CD45.2+ mutant or control bone marrow cells harvested from pups
at P6 were injected via tail vein into γ-irradiated CD45.1+ recipient
mice. At 40 hours after transplantation, bone marrow cells from recipient mice were collected and analyzed by flow cytometry.
The results show that the number of control donor-derived cells in the bone marrow of recipient mice was similar to that of mutant donor-derived cells (Supplemental Figure 6), indicating that the mutant bone marrow cells are normal in homing to the bone mar-row of the host.
Figure 4. Brpf1 disruption impairs colony formation and bone marrow reconstitution activities in the neonatal bone marrow. (A) Myeloid progenitor
cell colony formation. Bone marrow cells (6 × 10⁴) isolated from control and Brpf1fl/fl Vav1-iCre (vKO) pups at P6 were plated and cultured in MethoCult M3434 and colonies were analyzed on days 8–10. Representative images of the plates are shown. (B) Myeloid progenitor cell colony formation assays were performed as in A. Three different types of colonies, burst-forming unit-erythroid (BFU-E), colony-forming unit-granulocyte/monocyte (CFU-GM), and colony-forming unit-granulocyte/erythrocyte/monocyte/megakaryocyte (CFU-GEMM), were enumerated on days 8–10. Average values were calculated from 3 pairs of control and vKO pups. (C) B cell progenitor colony formation. Bone marrow cells (1.5 × 10⁵) from control and vKO pups at P6 were cultured
in MethoCult M3630 (see Supplemental Methods) and pre-B cell colonies were counted on days 8–10. Average values from 3 pairs of control and vKO pups are shown. (D) Long-term hematopoietic reconstitution was impaired in the mutant bone marrow. Contribution of donor (CD45.2+) cells in the recipients’
peripheral blood was determined at 4 to 16 weeks after transplantation. (E) At week 16 after transplantation, multilineage engraftment in the peripheral blood was analyzed. Note the robust contribution of the control but not the mutant CD45.2+ bone marrow cells to formation of B cells (B220+), myeloid
cells (Gr1+Mac1+), and T cells (CD4+ or CD8+). (F) Fractions of donor-derived cells in HSCs, progenitors, and lineage cells in the recipient bone marrow at week
16 after transplantation. For D–F, n = 6 for each group; ***P < 0.001. Unpaired 2-tailed Student’s t tests were performed and average values are shown as the mean + SEM in B–F. LT-HSC, long-term HSC; ST-HSC, short-term HSC.
Brpf1 deletion reduces HSC and progenitor populations in the fetal liver. To identify the reasons for the HSC and progenitor defects (Figures 3 and 4), we traced the developmental origins. Definitive hematopoiesis initiates at the aorta-gonad-mesonephros (AGM) region, colonizes the fetal liver, and eventually migrates to the thymus, spleen, and bone marrow (5, 6). Defective HSCs and pro-genitors in the mutant bone marrow (Figures 3 and 4) raised the
question of whether similar defects are present in the mutant fetal liver, a major site of definitive hematopoiesis in the fetus (5, 6). To investigate this, we performed flow cytometry with hemato-poietic cells from the fetal liver. At E12.5, the total cellularity and cell number of the LSK population in the mutant fetal liver were similar to those in the control (Figure 5, A and B). Upon separa-tion of LSK cells into 4 different populasepara-tions, an interesting picture
Figure 5. Brpf1 deletion reduces HSC and B cell populations in the fetal liver. (A–D) Total cellularity (A), LSK cells (B), and 4 stem/progenitor
popula-tions (HPC1, HPC2, HSC, and MPP; C and D) in the fetal liver of control vs. Brpf1fl/fl Vav1-iCre (vKO) mice at E12.5. (E) Percentage values of LSK cells, myeloid progenitor, and different fractions (CMP, GMP, and MEP) in the E14.5 fetal liver. Numbers of CMPs and GMPs, but not LSK cells, MPs, or MEPs, decreased in the mutant. (F) Percentage values of the 4 fractions gated according to expression of CD48 and CD150. Despite the similar cell number of LSKs (E), the HSC fraction declined, whereas the HPC1 fraction slightly increased in the mutant. (G–I) B lymphoid (G), myeloid (H), and erythroid cells (I) were compared between control and vKO fetal livers at E14.5. Percentage values of Gr1+ cells, CD19+ B lineage cells, Mac1+Gr1lo monocytes, Mac1+Gr1hi
granulocytes, and 4 erythroid fractions are shown. B lineage cells disappeared but myelopoiesis showed a mild increase in the mutant. (J–L) Proliferation and apoptosis of LSK cells in the E14.5 fetal liver. n = 8 for control and n = 4 for vKO in A–D; n = 7 for control and n = 3 for vKO in E–I; n = 8 for control and n = 5 for vKO in J–L; *P < 0.05, **P < 0.01, ***P < 0.001. For statistical analysis, unpaired 2-tailed Student’s t tests were performed and average values are presented here as the mean + SEM.
The Journal of Clinical Investigation
R E S E A R C H A R T I C L E(Figure 6C). Unlike the wild-type, the mutant fetal liver cells yield-ed few colony-forming units in the spleen (CFU-S) at day 12 (Figure 6D), suggesting that at the fetal stage, Brpf1 loss impairs functions of fetal short-term hematopoietic stem/progenitor cells in vivo.
To assess the long-term repopulating potential, we performed competitive bone marrow transplantation by injecting wild-type (or mutant) CD45.2+ fetal liver cells, premixed with CD45.1+ liver
fetal cells, into γ-irradiated CD45.1+ recipient mice. As shown in
Figure 6E, at 4 to 16 weeks after the bone marrow transplantation, cytometric analysis revealed that the mutant fetal liver cells were unable to contribute to multiple lineages in the recipients’ periph-eral blood, whereas the control contributed 10% to 80% of the cells in the recipients’ blood. At week 22, almost no contribution of the mutant fetal liver cells to different stem/progenitors cells and differentiated lineages in the recipients’ bone marrow was detected (Figure 6F). These results indicate that Brpf1 is essential for long-term repopulating activities of fetal liver cells.
BRPF1 regulates fetal HSC signature gene expression. To eluci-date the underlying cellular mechanisms, we investigated whether Brpf1 deletion alters proliferation of LSK cells. Simultaneous stain-ing of cell surface markers and the intracellular nuclear protein Ki67 was performed for subsequent quantification by flow cytom-etry. At P6, the proportion of Ki67+ cells in the mutant LSK
popu-lation was significantly lower (Figure 7, A and B), indicating that there are fewer cycling LSK cells in the mutant bone marrow. By contrast, the proliferation index was normal in LSK cells from the mutant fetal liver (Figure 5, J and K). Related to this, the cell cycle profile was not affected (Supplemental Figure 7). These results suggest no obvious alteration of cell cycle progression at least in a majority of LSK cells from the mutant fetal liver.
We also examined survival of LSK cells by annexin V staining and cytometric analysis. As shown in Figure 7C, the LSK popula-tion in the mutant bone marrow displayed apoptosis as indicated by a significantly elevated amount of annexin V+ cells. Apoptosis
also slightly increased in the fetal liver (Figure 5L), but it was much less severe than that in the bone marrow (Figure 7C). Moreover, increased levels of ROS (Figure 7D and Supplemental Figure 8A) and cellular senescence (Figure 7E and Supplemental Figure 8B) were also detected in LSK cells from the mutant bone marrow. A similar increase was present in HSC-containing CD150+ LSK cells
(Figure 7, D and E). This population also showed some increase in the ROS level in the mutant fetal liver at E14.5 (Supplemental Figure 8C). These results support that elevated ROS and senescence are 2 cellular mechanisms contributing to defects in mutant LSK cells.
To understand the molecular mechanism underlying the func-tional defects in mutant HSCs and progenitors, we sorted LSK cells from the wild-type or mutant fetal liver at E14.5 for RNA iso-lation, oligo(dT)–primed reverse transcription, and deep sequenc-ing. Two independent sets of RNA-Seq results revealed that mul-tiple genes important for HSC stemness were downregulated in the mutant LSK cells (Table 1, Supplemental Figure 9, and Supple-mental Table 4). These genes include Slamf1, Evi1, Mds1, Sox17, Hoxa9, Hoxa7, Meis1, Hlf, Gfi1, Rora, and Gata3. Among them, Slamf1 encodes CD150, which has been frequently used as an HSC surface marker (48). The Mds1 and Evi1 complex locus (also known as Mecom) encodes MDS1, EVI1, and their fusion protein, and is important for long-term HSC function (49, 50). SOX17 is an HMG-emerged. While the HPC1 population slightly expanded, a
signifi-cant decrease was found with the HPC2, HSC, and MPP fractions (Figure 5, C and D). At E14.5, the mutant MP, LSK, and MEP popu-lations were comparable with those from the control fetal liver, whereas the mutant CMP and GMP fractions were compromised (Figure 5E). As found for E12.5 (Figure 5D), the HPC1 fraction slightly expanded, but a significant decrease was found with the remaining 3 fractions (Figure 5F). At E14.5, B cell differentiation was compromised, whereas myelopoiesis increased (Figure 5, G and H). By contrast, erythropoiesis appeared largely normal in the mutant fetal liver (Figure 5I). Thus, BRPF1 is required for early stages of definitive hematopoiesis in the fetal liver.
BRPF1 is required for the bone marrow reconstitution poten-tial of fetal liver cells. The immunophenotyping results from flow cytometry (Figure 5) suggest that deficiency in HSCs and some progenitors in the fetal liver is the cause for the eventual bone marrow failure after birth (Figures 1 and 2). One remaining ques-tion is whether residual HSCs and progenitor populaques-tions are still functional. To investigate this, we performed methylcellulose colony formation assays. When cultured in Methocult M3434, the number of colonies formed by the mutant fetal liver cells was much smaller than that from the control (Figure 6, A and B), indi-cating fewer functional myeloid and erythroid progenitor cells in the mutant fetal liver. Thus, Brpf1 is critical for functions of fetal hematopoietic progenitors in vitro.
To determine short-term repopulating potential, we transplant-ed X-ray–irradiattransplant-ed C57BL/6.SJL young mice with wild-type or mutant fetal liver cells. The wild-type, but not the mutant, fetal liver cells conferred survival advantage over the irradiated control mice, which received the same dose of radiation but no transplantation
Figure 6. Brpf1 inactivation impairs colony formation and bone marrow repopulating activities in the fetal liver. (A) Myeloid progenitor cell colony
formation of fetal liver cells (6 × 10⁴) from control and Brpf1fl/fl Vav1-iCre (vKO) embryos at E15.5. Colonies were examined at day 9, and average numbers of burst-forming erythroid (BFU-E), colony-forming unit-granulocyte/monocyte (CFU-GM), and colony-forming unit-granulocyte/ erythrocyte/monocyte/megakaryocyte (CFU-GEMM) colonies are pre-sented. n = 4 for each group. (B) Morphology of representative individual colonies formed from control and vKO fetal liver cells. Images were obtained with an AxioCam HRc digital camera and a 20× objective on an AXIO Zoom.V16 microscope. Scale bar: 1 mm. (C) Survival curves of irradi-ated C57BL/6 mice without transplantation (dashed line) or transplanted with 2 × 10⁵ control (solid black line) or vKO (solid red line) fetal liver cells
at E14.5. n = 13 for the group without transplantation and n = 9 for each transplanted group. (D) CFU-S analysis at day 12. Images of spleens are shown on the left and the colony numbers are presented in the graph on the right. n = 5 for each group. Scale bar: 5 mm. (E and F) Brpf1 inactiva-tion impairs long-term hematopoietic reconstituinactiva-tion potential in the fetal liver. Fetal liver cells were collected for tail-vein injection into irradiated C57BL/6.SJL mice. Flow cytometric analysis of the contribution of donor (CD45.2+) cells and multilineage engraftment in the recipients’ peripheral
blood at 4 to 16 weeks after transplantation is shown in E, whereas frac-tions of donor-derived cells in specific cell populafrac-tions in the recipients’ bone marrow at 22 weeks are presented in F. E12.5 and E15.5 mutant fetal liver cells showed similar defects in hematopoietic reconstitution, and the data are from 6 pairs of wild-type and mutant embryos (3 pairs at E12.5 and 3 pairs at E15.5). **P < 0.01, ***P < 0.001. For A, D (right), E, and F, unpaired 2-tailed Student’s t tests were performed and average values are shown as the mean + SEM.
The Journal of Clinical Investigation
R E S E A R C H A R T I C L Einteracting histone acetyltransferases (MOZ, MORF, and HBO1) (26–28) were unaltered in mutant fetal liver LSK cells at E14.5 (Supplemental Table 4) and in mutant fetal liver HSCs at E12.5 (Supplemental Figure 10A), indicating that the defects are not due to the lack of these BRPF1-related or -interacting proteins. Consistent with minimal effects on the cell cycle pro-file at E14.5 (Supplemental Figure 7), no changes were detected in tran-scripts of multiple cell cycle regulators (Supplemental Table 4).
Immunophenotyping and func-tional analysis revealed that HSC and progenitor defects are evident at E12.5 (Figures 5 and 6), raising the question of whether molecular defects are also present at this developmental stage. To investigate this, we performed RT-qPCR to analyze RNA from wild-type and mutant fetal liver LSK cells at E12.5. As shown in Table 1 and Sup-plemental Figure 9, transcriptional defects were already severe at E12.5. These results indicate that Brpf1 loss results in developmental abnormal-ity of HSCs and progenitors starting at E12.5. Thus, BRPF1 is a chromatin regulator with an essential role in ear-ly HSC development.
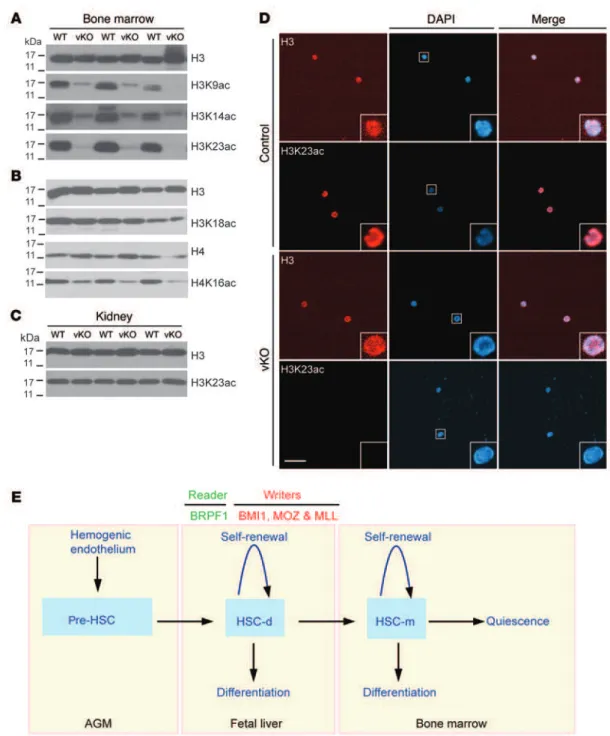
BRPF1 is essential for hematopoietic histone H3 acetylation. Molecular and cell-based studies have established that BRPF1 stimulates activities of the histone acetyltransferases MOZ, MORF, and HBO1 towards histone H3 in vitro (26, 28, 61), so we investigated how Brpf1 loss might affect histone H3 acetylation in vivo. For this, we first harvested bone marrow cells from wild-type and mutant pups at P7 for protein extract preparation and immunoblotting. As shown in Figure 8A, Brpf1 loss led to dramatic reduction of histone acetylation at lysines 9, 14, and 23 in the bone marrow. By contrast, acetylation at lysine 18 of histone H3 was not affected in the mutant bone marrow (Figure 8B), indicating that the effect is specific to certain sites. There were some effects on histone H4 acetylation at lysine 16 (Figure 8B), but they were much milder compared with those on lysines 9, 14, and 23 of histone H3 (Figure 8A). Consistent with hematopoietic-specific effects, no changes in lysine 23 acetylation were detected in the mutant kid-ney (Figure 8C). Lysines 9 and 14 of histone H3 are well known to be important for marking active genes. By contrast, much less is known for acetylation at lysine 23 of histone H3. Interestingly, this mark has recently been shown to be highly abundant in U2OS osteosarcoma and HeLa cells (62, 63) and was reported in 2010 to serve as a unique ligand for the important chromatin reader TRIM24 in breast cancer (64), suggesting the importance of lysine 23 acetylation in vivo. Moreover, MORF and a related Drosophila protein acetylate histone H3 at lysine 23 (65, 66). In light of these box transcription factor crucial for fetal HSCs (51). The zinc finger
transcription factor GFI1 is important for HSC self-renewal (52, 53). The homeodomain transcription factor HOXA9 interacts with MEIS1 and PBX1/2 to form a trimeric DNA-binding complex that is important for HSC proliferation (54–57). HOXA7 has functions similar to those of HOXA9 (58). HLF (hepatic leukemia factor) is a bZIP transcription factor important for HSC identity (59). Inter-estingly, Mecom, Hoxa9, and 4 other downregulated genes (Ets1, Myct1, Eya1, and Egr; Table 1) were shown to be direct targets of the histone methyltransferase MLL in an HSC-rich cell population (60), suggesting a potential interaction between BRPF1 and MLL. In addition, RNA-Seq revealed defective transcription of multiple genes specific to hematopoietic progenitors (Supplemental Figure 9). For example, consistent with defects in B cell lineage (Supple-mental Figure 3, C and D, and Figure 5G), transcription of Ebf1, Lef1, and Pou2af1, which encode 3 transcription factors important for B cell development, was dramatically reduced (Supplemental Figure 9). Thus, the RNA-Seq results suggest that BRPF1 loss leads to transcriptional reduction of genes important for HSCs and hematopoietic progenitors.
To verify this conclusion based on RNA-Seq, we performed qPCR with RNA from sorted fetal liver LSK cells at E14.5. RT-qPCR analysis confirmed reduction in a majority of targets select-ed for analysis (Table 1 and Supplemental Figure 9). Moreover, transcript levels of 2 BRPF1 paralogs (BRPF2 and BRPF3) and 3
Figure 7. Brpf1 deletion alters LSK cell programs. (A and B) After staining with antibodies against
lineage-specific markers (PerCPCy5.5-conjugated CD3ε, B220, Gr1, and Ter119) together with antibodies lineage-specific for HSC markers (Sca1-APC and cKit-Pacific blue), P6 bone marrow cells were fixed, permeabilized, and restained with Ki67-FITC. n = 7 for control and n = 4 for Brpf1fl/fl Vav1-iCre (vKO) pups. (C) Bone marrow cells were stained with the antibodies as in A and B, except that Ki67-FITC was replaced with annexin V-PECy7. n = 6 for control and n = 4 for vKO. (D) Percentage of ROS-positive cells in LSK, CD150+LSK, CD150–LSK,
and MP populations in the control and mutant bone marrows at P9. n = 3 for each group. (E) Percentage of senescent cells in LSK, CD150+LSK, CD150–LSK, and MP fractions in the control and mutant bone marrows
at P9. n = 6 for control pups and n = 3 for vKO pups. *P < 0.05, **P < 0.01, ***P < 0.001. For statistical analysis, unpaired 2-tailed Student’s t tests were performed; average values are presented as the mean + SEM in A–C and as the mean ± SEM in D and E.
ability to activate 3 different histone acetyltransferas-es, BRPF1 is a unique chromatin reader with the poten-tial to mediate crosstalk between different chromatin modifications (26–28). The results presented herein demonstrate that BRPF1 is highly expressed in HSCs from the fetal liver (Supplemental Figure 1C) and serves as an essential regulator in the HSC and hema-topoietic progenitor compartments (Figures 2–6). The results also support its function upstream from mul-tiple multipotency genes important for HSC stemness (Table 1 and Supplemental Figure 9). Because HSCs emerge at the AGM region and start to migrate to the liver at E10.5 (1), it is intriguing to note that effects of Brpf1 deletion become evident at E12.5 (Figures 5 and 6). Notably, Vav1-iCre fails to initiate complete excision at E11.5 (67), so it will be necessary to utilize a different Cre line, such as Vec-Cre (67), to examine the function of BRPF1 at the time window between E10.5 and E12.5. The important role of BRPF1 in HSC development is potentially novel because little is known about functions of chromatin readers in HSC homeostasis (Figure 8E). These readers, such as the BET family of bromodomain proteins (68), have been shown to be valuable as drug targets, so the important role of BRPF1 in HSCs and hematopoietic progenitors suggests its potential as a molecular target for devel-oping therapeutic means for treating hematopoiesis-related disorders.
Roles in HSC homeostasis have been reported for enzymatic chromatin modifiers: the DNA meth-yltransferase DNMT3a in promoting HSC differen-tiation (69); the DNA demethylase TET2 in repressing HSC expansion (70); 3 histone methyltransferases (MLL1, EZH1 and EZH2) and a subunit of a histone H2A ubiquitin ligase complex (BMI1) in HSC self-renewal and maintenance (71–76); the acetyltransfer-ase MOZ in HSC development (77, 78); and the deacet-ylase HDAC3 in HSC proliferation (79). Among them, MOZ, BMI1, and MLL regulate fetal HSC functions (Figure 8E). Our results indicate that BRPF1 plays an essential role at the fetal stage (Figure 8E). It remains to be determined whether BRPF1 has any roles in post-natal maintenance of HSCs. Interestingly, BRPF1 loss led to decreased expression of multiple genes, such as Mecom, Hoxa9, Ets1, Myct1, Eya1, and Egr (Table 1), that are also regulated by MLL (60). This similarity suggests potential interac-tion between BRPF1 and MLL.
Bone marrow transplantation (Figure 6, E and F) and gene expression profiling (Table 1 and Supplemental Figure 9) indicate that BRPF1 acts on HSC development starting at or prior to E12.5, which is quite intriguing in light of HSC emergence at the AGM region and subsequent migration to the fetal liver around E10.5 (Figure 8E) (1). Further investigation of its role within this narrow time window shall yield new insights into epigenetic networks important for HSC ontogeny (80).
Brpf1 deletion causes bone marrow failure through a potentially new mechanism. One striking phenotype of Brpf1 mutant pups is findings, we performed indirect immunofluorescence microscopy
to analyze this epigenetic mark in sorted bone marrow LSK cells and on bone marrow sections. The fluorescence signal for lysine 23 acetylation was undetectable in sorted mutant LSK cells at P7 (Figure 8D). Moreover, the lysine 23 acetylation level was low in the mutant bone marrow at P5, but the fluorescence signal was not affected in the adjacent bone (Supplemental Figure 11). Together, these results indicate that BRPF1 is important for specific histone H3 acetylation in the bone marrow.
Discussion
BRPF1 is a multivalent chromatin reader crucial for fetal HSC devel-opment. Because of its multiple histone-binding domains and the
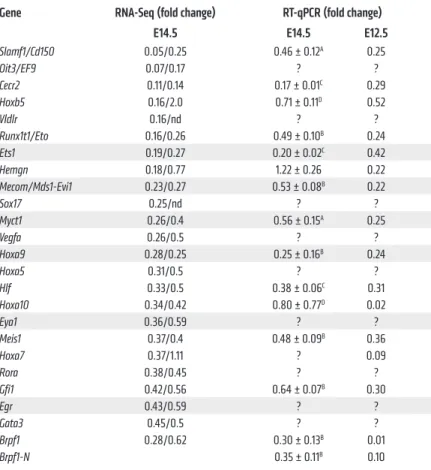
Table 1. Reduced transcription of known and potential HSC signature genes
Gene RNA-Seq (fold change) RT-qPCR (fold change)
E14.5 E14.5 E12.5
Slamf1/Cd150 0.05/0.25 0.46 ± 0.12A 0.25 Oit3/EF9 0.07/0.17 ? ? Cecr2 0.11/0.14 0.17 ± 0.01C 0.29 Hoxb5 0.16/2.0 0.71 ± 0.11D 0.52 Vldlr 0.16/nd ? ? Runx1t1/Eto 0.16/0.26 0.49 ± 0.10B 0.24 Ets1 0.19/0.27 0.20 ± 0.02C 0.42 Hemgn 0.18/0.77 1.22 ± 0.26 0.22 Mecom/Mds1-Evi1 0.23/0.27 0.53 ± 0.08B 0.22 Sox17 0.25/nd ? ? Myct1 0.26/0.4 0.56 ± 0.15A 0.25 Vegfa 0.26/0.5 ? ? Hoxa9 0.28/0.25 0.25 ± 0.16B 0.24 Hoxa5 0.31/0.5 ? ? Hlf 0.33/0.5 0.38 ± 0.06C 0.31 Hoxa10 0.34/0.42 0.80 ± 0.77D 0.02 Eya1 0.36/0.59 ? ? Meis1 0.37/0.4 0.48 ± 0.09B 0.36 Hoxa7 0.37/1.11 ? 0.09 Rora 0.38/0.45 ? ? Gfi1 0.42/0.56 0.64 ± 0.07B 0.30 Egr 0.43/0.59 ? ? Gata3 0.45/0.5 ? ? Brpf1 0.28/0.62 0.30 ± 0.13B 0.01 Brpf1-N 0.35 ± 0.11B 0.10
Wild-type and mutant LSK cells were prepared from control and mutant fetal livers at E14.5 for RNA-Seq. Selected multipotency genes with reduced expression in 2 different RNA-Seq experiments were used for validation by RT-qPCR with RNA from wild-type and mutant LSK cells sorted from E12.5 and E14.5 fetal livers. The values are shown as the fold change in the mutant when compared to the control. For each gene, numbers in the “RNA-Seq” column represent fold change in 2 different RNA-Seq experiments. For RT-qPCR at E14.5, the data were derived from 3 different sets of pooled LSK cells and are shown as the mean ± SEM; n = 7 for the control and n = 5 for Brpf1fl/fl Vav1-iCre embryos. For statistical analysis, unpaired 2-tailed Student’s t tests were performed. AP < 0.05, BP < 0.01, CP < 0.001. DNot statistically significant. For RT-qPCR at E12.5, the data were
based on 1 set of sorted fetal LSK cells pooled from 4 wild-type or mutant embryos. Genes regulated by MLL are highlighted in gray. See the main text and Supplemental Figure 9 for discussion about known and potential roles of the listed genes in HSCs and progenitors. nd, not detectable; ?, not investigated.
The Journal of Clinical Investigation
R E S E A R C H A R T I C L Epremature aging due to defective glucose metabolism. By contrast, the glucose level was normal in Brpf1 mutant pups (Supplemental Figure 12). Although not examined directly, the bone marrow of Sirt6–/– pups may be histologically normal, as their HSCs are
func-tional (81). Bone marrow failure is a key feature of diseases with aplastic anemia. In a mouse model of Fanconi anemia, the p53/ that they were healthy in postnatal week 1 but all dead in week 3
(Figure 1). Immunophenotyping and functional transplantation assays indicate that deficient HSCs and hematopoietic progenitors in the fetal liver and bone marrow contribute to bone marrow fail-ure (Figfail-ures 2–6). Bone marrow failfail-ure has been reported for pups lacking the deacetylase SIRT6 (81). Interestingly, the pups exhibit
Figure 8. BRPF1 regulates histone acetylation in the bone marrow and LSK cells. (A and B) Immunoblotting analysis of histone H3 and H4 acetylation in
wild-type and Brpf1fl/fl Vav1-iCre (vKO) bone marrow cell extracts at P7. (C) Immunoblotting for histone H3 acetylation at lysine 23 in kidney protein extracts at P7. (D) Immunofluorescence microscopic analysis of histone H3 acetylation at lysine 23 in LSK cells sorted from the wild-type or mutant bone marrow at P7. Scale bar: 50 μm. In A and B, results were similar for bone marrow cells from 3 pairs of wild-type and mutant pups. The experiment in D was repeated 3 times, and similar results were obtained with over 100 wild-type or mutant cells. (E) Cartoon explaining the roles of BRPF1 and 3 other chromatin regula-tors important for fetal HSC homeostasis. The hemogenic endothelium at the AGM region gives rise to pre-HSCs for subsequent migration to the fetal liver, where definitive HSCs (HSC-d) merge and travel to the bone marrow for eventual maturation to generate mature HSCs (HSC-m). In addition to its role as a chromatin reader due to its multiple histone-binding domains, BRPF1 acts as a co-writer to activate the acetyltransferases MOZ, MORF, and HBO1 (107). Thus, BRPF1 is a unique multivalent chromatin reader (23–25).
Pathologically, BRPF1 regulates leukemogenesis and aberrant MOZ-containing proteins, and has been shown to be essential for self-renewal of leukemic stem cells (39, 40, 95). Like the MOZ gene, the MORF gene is rearranged in leukemia (41, 42). This gene is also mutated in leiomyoma (96), prostate cancer (97), and breast cancer (98). Moreover, the MOZ and MORF genes are also amplified in dif-ferent types of cancer (99) and mutated in developmental disorders with intellectual disability (100–106). Related to these develop-mental disorders, BRPF1 is important for murine neural stem cells (35, 37). In addition, it will be important to investigate whether the BRPF1 gene is also mutated in patients with related developmental disorders. Thus, how BRPF1 interacts with MOZ, MORF, and other partners to regulate stem cells in leukemia and other diseases is an exciting question awaiting further investigation.
Methods
Mice. Mice were in the C57BL/6J background except that the γ-irradiated recipient mice used for competitive bone marrow trans-plantation were the congenic strain C57BL/6.SJL-Ptprca Pepcb/BoyJ
(Jackson Laboratory, stock 002014). Heterozygous Brpf1LacZ mice
were originally obtained from the European Mutant Mouse Archive (ID 04257) to produce Brpf1fl/fl mice as described previously (34). The Brpf1fl allele contains 2 loxP sites flanking exons 4–6 of the Brpf1 gene
(34). To generate hematopoietic-specific knockouts, Brpf1fl/fl mice were
bred with the Vav1-iCre strain (Jackson Laboratory, stock 008610) (46). Knockout efficiency was verified by genomic PCR, RT-PCR, and/ or RT-qPCR. Genomic PCR was carried out as described (35–37). For RT-PCR or RT-qPCR, cells were harvested from the bone marrow, thymus, spleen, kidney, or fetal liver. After staining with different combinations of fluorophore-conjugated antibodies (Supplemental Table 5, see below), different hematopoietic lineages were sorted on a FACSAria sorter (BD Biosciences) directly into tubes containing QIAzol (QIAGEN) or TRIzol (Thermo Fisher). RNA was extracted with an miRNeasy or RNeasy Mini Kit (QIAGEN). PCR and RT-qPCR were performed as described previously (35–37). Primers are listed in Supplemental Table 6.
Flow cytometry. Total bone marrow cells were flushed out of femurs and tibias with DMEM containing 2% FBS and penicillin/strep-tomycin (Gibco). Spleen, thymus, and fetal liver tissues were minced in the same medium. Single-cell suspensions were prepared by pass-ing them through 40-μm cell strainers (StemCell Technologies). Red blood cells were lysed with Red Blood Cell (RBC) Lysis Buffer (eBio-science). The nucleated cell number was counted on an automated cell counter (Bio-Rad, TC10). FVD-eFluor 506 (eBioscience) was used as a viability dye to exclude dead cells. For lineage labeling, fetal liver, neonatal bone marrow, or spleen cells were stained with PerCPCy5.5-conjugated monoclonal antibodies against 4 lineage (Lin)-specific cell surface markers (CD3ε, B220, Gr1, and Ter119; eBioscience; Supplemental Table 5), whereas for adult bone marrow cells, 5 mark-ers (CD3ε, B220, Gr1, Ter119, and Mac1; eBioscience) were used. For detection of HSCs and progenitors, cells were stained with respec-tive combinations of fluorophore-conjugated monoclonal antibodies (cKit-PECy7 or cKit-Pacific Blue, Sca1-APC, Flt3-PE, CD34-FITC, IL-7Rα-PE, CD150-PE, CD48-FITC, and CD16/32-PE; eBioscience; Supplemental Table 5). Combinations of fluorophore-conjugated monoclonal antibodies specific for cell surface markers were: long-term HSC, CD34–Flt3–LSK; short-term HSC, CD34+Flt3–LSK; MPP,
p21 DNA damage response is exacerbated (82). Synergy of p53 mutants with loss of the inhibitor MDM2 or MDM4 also leads to bone marrow failure (83, 84). Due to defective telomere functions, bone marrow failure is also a feature of dyskeratosis congenita. As a model of this genetic disease, mice lacking POT1B, a subunit of a complex required for telomere protection, exhibit bone marrow failure and defective HSCs due to p53-dependent apoptosis (85, 86). Of relevance, hematopoietic-specific Brpf1 deletion promoted apoptosis (Figures 5L and 7C), but there were no obvious defects in p53-dependent processes such as Cdkn1a expression (Supple-mental Table 4). Together, these considerations suggest that bone marrow failure in Brpf1 mutant pups occurs through a previously unrecognized mechanism.
BRPF1 regulates histone H3 acetylation in stem cells and human diseases. BRPF1 is conserved from Caenorhabditis elegans to humans (42). It regulates neuron asymmetry, hindgut develop-ment, and fecundity in worms (87). Fish Brpf1 maintains pharyn-geal segmental identity and skeletal development (88). Thus, an important role in mouse HSCs is unexpected. Whether fish Brpf1 regulates hematopoiesis is presently unclear. Mammalian BRPF1 is paralogous to BRPF2 and BRPF3 (26, 27). Deletion of mouse Brpf2 leads to embryonic lethality at E15.5 and faulty erythropoiesis (89). By contrast, Brpf3 is dispensable (90). Thus, despite their sequence similarity, the 3 BRPF proteins have distinct roles in vivo. Related to their differences, BRPF1 interacts with the acetyltransferases MOZ, MORF, and HBO1 (26–28), whereas BRPF2 and BRPF3 target pre-dominantly (if not exclusively) HBO1 (89–91). In mammals, there are 3 JADE proteins, each of which shares similarity with BRPF1 in 2 PHD fingers and 2 small motifs (26). However, JADE proteins do not show any homology to the bromodomain and PWWP domain of BRPF1 (26). Moreover, JADEs activate only HBO1 (26, 28). Thus, compared with BRPF2, BRPF3, and JADEs, BRPF1 is unique.
Known interactions of BRPF1 with MOZ, MORF, and HBO1 are based on cell-based assays in vitro (89–91), so an important question is which acetyltransferases BRPF1 activates in HSCs and other hematopoietic cells in vivo. Among the 3 acetyltransferas-es, MOZ is critical in HSCs (77, 78, 92). Through interacting with BRPF2, HBO1 is important for development of erythrocytes and thymocytes (89, 93). Its role in HSCs remains unclear. Similarly, the function of MORF in hematopoiesis also awaits investiga-tion (94). Our results show that BRPF1 is crucial for histone H3 acetylation at lysines 9, 14, and 23 (Figure 8, A and D). The find-ing about lysine 23 acetylation is excitfind-ing and potentially novel, as this histone mark is poorly characterized but highly abundant, at least in 2 human cell lines (62, 63). Moreover, enok (a fly acetyl-transferase homologous to MOZ and MORF) is crucial for histone H3 acetylation at lysine 23 in vivo and MORF targets the same site in lung cancer cells (65, 66). MOZ is paralogous to MORF (42), so it is expected to acetylate histone H3 at lysine 23. By contrast, mouse Hbo1 is crucial for acetylation of histone H3 at lysine 14 in vivo (93). At their mRNA levels, mouse Morf appears to be expressed at a much lower level than Moz and Hbo1 in fetal liver HSCs at E12.5 (Supplemental Figure 10B) and fetal liver LSK cells at E14.5 (Table S4), so it is tempting to propose that BRPF1 mainly targets MOZ and HBO1 to control histone H3 acetylation in HSCs and hematopoietic progenitors. Further studies are needed to substantiate this interesting possibility.
The Journal of Clinical Investigation
R E S E A R C H A R T I C L Ewhich was reviewed and approved by the Facility Animal Care
Com-mittee of McGill University, Montreal, Quebec, Canada.
Supplemental information. Information about antibodies and addi-tional experimental procedures is included in the Supplemental Infor-mation section, which also contains Supplemental Tables 1–6 and Supplemental Figures 1–12.
Author contributions
LY initiated the project. LL finished the project. LY and LL carried out all experiments. KY provided ideas on H3K23 acetylation. JZ and EW performed bioinformatics analysis. JB and AN helped design flow cytometric experiments. LY and LL prepared drafts of the man-uscript. XJY supervised the project and finalized the manman-uscript.
Acknowledgments
The research was supported by operating grants from Cana-dian Institutes for Health Research (CIHR to AN and XJY) and Natural Sciences and Engineering Research Council of Canada (NSERC to XJY).
Address correspondence to: Xiang-Jiao Yang, Goodman Cancer Center, Room 413, 1160 Pine Avenue West, Montreal, Quebec H3A 1A3, Canada. Phone: 514.398.5883; E-mail: xiang-jiao. [email protected].
CD48–CD150–LSK (Figure 3F and Supplemental Figure 1C) or
CD34+Flt3+LSK (Figures 4F and 6F); HPC1, CD48+CD150–LSK; HPC2,
CD48+CD150+LSK; LMPP, Lin–Sca1+cKit+Flt3hi; CLP, Lin–IL-7Rα+
Sca1locKitlo; CMP, Lin–Sca1–cKit+CD34+CD16/32–; GMP, Lin–Sca1–
cKit+CD34+CD16/32+; MEP, Lin–Sca1–cKit+CD34–CD16/32–; and fetal
liver HSC, Lin–Sca1+cKit+CD48–CD150+. Three pairs of conjugated
monoclonal antibodies (CD19-PE vs. Gr1-PerCPCy5.5, Mac1-PerCP-Cy5.5 vs. Gr1-PE, and Ter119-PerCPMac1-PerCP-Cy5.5 vs. CD71-PE) were used to assess B lineage, myeloid differentiation, and erythroid differentia-tion, respectively. For thymocyte differentiadifferentia-tion, CD4-PE and CD8a-FITC were used. All fluorophore-conjugated monoclonal antibodies were from eBioscience. Flow cytometry was performed with a 3-laser LSR II or 4-laser LSR Fortessa flow cytometer (BD Biosciences). FACS Diva (BD Biosciences) and FlowJo (TreeStar Inc.) software pack-ages were used for data analysis. Sorting of HSCs, LSK cells, and other hematopoietic cells was performed on the FACSAria cell sorter.
Statistics. Statistical analysis was performed with unpaired 2-tailed Student’s t tests, with the exception of Supplemental Figure 7, in which 1-way ANOVA was used for multiple comparisons in cell cycle analyses. P values less than 0.05 were considered to be statistically significant, and data are presented as the mean ± SEM or mean + SEM. Graphs were generated with Prism 6 (GraphPad Software).
Animal study approval. Animal-related procedures used in this study were carried out according to the Animal Use Protocol 5786,
1. Orkin SH, Zon LI. Hematopoiesis: an evolv-ing paradigm for stem cell biology. Cell. 2008;132(4):631–644.
2. Doulatov S, Notta F, Laurenti E, Dick JE. Hema-topoiesis: a human perspective. Cell Stem Cell. 2012;10(2):120–136.
3. Copley MR, Beer PA, Eaves CJ. Hematopoietic stem cell heterogeneity takes center stage. Cell
Stem Cell. 2012;10(6):690–697.
4. Morrison SJ, Scadden DT. The bone marrow niche for haematopoietic stem cells. Nature. 2014;505(7483):327–334.
5. Dzierzak E, Speck NA. Of lineage and legacy: the development of mammalian hematopoietic stem cells. Nat Immunol. 2008;9(2):129–136. 6. Medvinsky A, Rybtsov S, Taoudi S.
Embry-onic origin of the adult hematopoietic sys-tem: advances and questions. Development. 2011;138(6):1017–1031.
7. Rossi DJ, Jamieson CH, Weissman IL. Stems cells and the pathways to aging and cancer. Cell. 2008;132(4):681–696.
8. Biffi A, et al. Lentiviral hematopoietic stem cell gene therapy benefits metachromatic leukodys-trophy. Science. 2013;341(6148):1233158. 9. Aiuti A, et al. Lentiviral hematopoietic stem cell
gene therapy in patients with Wiskott-Aldrich syndrome. Science. 2013;341(6148):1233151. 10. Naldini L. Ex vivo gene transfer and
correc-tion for cell-based therapies. Nat Rev Genet. 2011;12(5):301–315.
11. Hütter G, et al. Long-term control of HIV by CCR5 Delta32/Delta32 stem-cell transplanta-tion. N Engl J Med. 2009;360(7):692–698. 12. Appel SH, et al. Hematopoietic stem cell
transplan-tation in patients with sporadic amyotrophic lat-eral sclerosis. Neurology. 2008;71(17):1326–1334.
13. Copelan EA. Hematopoietic stem-cell transplan-tation. N Engl J Med. 2006;354(17):1813–1826. 14. McKinney-Freeman S, et al. The transcriptional
landscape of hematopoietic stem cell ontogeny.
Cell Stem Cell. 2012;11(5):701–714.
15. Novershtern N, et al. Densely interconnected transcriptional circuits control cell states in human hematopoiesis. Cell. 2011;144(2):296–309. 16. Rossi L, et al. Less is more: unveiling the
func-tional core of hematopoietic stem cells through knockout mice. Cell Stem Cell. 2012;11(3):302–317. 17. Li B, Carey M, Workman JL. The role of chromatin during transcription. Cell. 2007;128(4):707–719. 18. Kouzarides T. Chromatin modifications and their
function. Cell. 2007;128(4):693–705. 19. Ronan JL, Wu W, Crabtree GR. From neural
development to cognition: unexpected roles for chromatin. Nat Rev Genet. 2013;14(5):347–359. 20. Bonasio R, Tu S, Reinberg D.
Molecu-lar signals of epigenetic states. Science. 2010;330(6004):612–616.
21. Suganuma T, Workman JL. Signals and combina-torial functions of histone modifications. Annu
Rev Biochem. 2011;80:473–499.
22. Kohli RM, Zhang Y. TET enzymes, TDG and the dynamics of DNA demethylation. Nature. 2013;502(7472):472–479.
23. Taverna SD, Li H, Ruthenburg AJ, Allis CD, Patel DJ. How chromatin-binding modules interpret histone modifications: lessons from professional pocket pickers. Nat Struct Mol Biol. 2007;14(11):1025–1040.
24. Latham JA, Dent SY. Cross-regulation of histone modifications. Nat Struct Mol Biol. 2007;14(11):1017–1024.
25. Musselman CA, Lalonde ME, Côté J, Kutate-ladze TG. Perceiving the epigenetic landscape
through histone readers. Nat Struct Mol Biol. 2012;19(12):1218–1227.
26. Doyon Y, et al. ING tumor suppressor proteins are critical regulators of chromatin acetylation required for genome expression and perpetua-tion. Mol Cell. 2006;21(1):51–64.
27. Ullah M, et al. Molecular architecture of quartet MOZ/MORF histone acetyltransferase com-plexes. Mol Cell Biol. 2008;28(22):6828–6843. 28. Lalonde ME, et al. Exchange of associated
factors directs a switch in HBO1 acetyltrans-ferase histone tail specificity. Genes Dev. 2013;27(18):2009–2024.
29. Qin S, et al. Recognition of unmodified histone H3 by the first PHD finger of bromodomain-PHD finger protein 2 provides insights into the regulation of histone acetyltransferases monocytic leukemic zinc-finger protein (MOZ) and MOZ-related factor (MORF). J Biol Chem. 2011;286(42):36944–36955.
30. Klein BJ, et al. Bivalent interaction of the PZP domain of BRPF1 with the nucleosome impacts chromatin dynamics and acetylation. Nucleic
Acids Res. 2016;44(1):472–484.
31. Poplawski A, et al. Molecular insights into the recognition of N-terminal histone modifica-tions by the BRPF1 bromodomain. J Mol Biol. 2014;426(8):1661–1676.
32. Vezzoli A, et al. Molecular basis of histone H3K36me3 recognition by the PWWP domain of Brpf1. Nat Struct Mol Biol. 2010;17(5):617–619. 33. Wu H, et al. Structural and histone binding
abil-ity characterizations of human PWWP domains.
PLoS ONE. 2011;6(6):e18919.
34. You L, Chen L, Penney J, Miao D, Yang XJ. Expres-sion atlas of the multivalent epigenetic regulator Brpf1 and its requirement for survival of mouse